ISSN Online: 1947-394X ISSN Print: 1947-3931
DOI: 10.4236/eng.2017.912063 Dec. 29, 2017 1060 Engineering
Analysis of Stress Backlogs
during Case-File Processing
in Forensic Science Laboratory
Gloria Cuthbert Omari1, Samwel Victor Manyele2, George Mwaluko1
1Department of Mechanical and Industrial Engineering, University of Dar es Salaam, Dar es Salaam, Tanzania
2Government Chemist Laboratory Authority, Dar es Salaam, Tanzania
Abstract
Case-file backlogs were identified as one of the cause factors affecting the com-petitiveness of the forensic science laboratory (FSL). Backlogs represent case-files that remain unprocessed or unreported within a selected time interval (year, week or month) which leads to increased customer complaints, rework, cost of analysis, degradation of biological samples, etc. Case-file backlogging was quantified in three consecutive years (2014 to 2016), using the following pa-rameters: case-files received and case-files processed, difference of which gives case-files backlogged. There was a need to define time interval for a case-file to be regarded as backlogged (that is, one week), results of which can translate into backlogged case-files per month or year. A data collection tool was estab-lished and used for three work stations (forensic chemistry, biology/DNA and toxicology laboratories). The tool includes starting and ending date for each time interval, in which the numbers of case-files received and processed were entered followed by computing the backlogs. It was observed that, case-files reported increased between 2014 and 2016 leading to a decrease in backlogged case-files. The annual percentage of the case-files backlogged was highest for forensic tox-icology. The highest number of case-files backlogged was observed for forensic chemistry, followed by forensic biology/DNA. The number of case-files back-logged per analyst per year was highest in 2014 and dropped continuously to-wards 2016, being comparably higher in forensic biology/DNA and chemistry. Probability density functions (PDFs) and cumulative distribution functions (CDFs) of backlogs data indicated that a large number of backlogs created in previous weeks were eliminated. It was concluded that the effect of case-file backlogging on FSL competitiveness can be minimized by continued management effort in backlog elimination.
How to cite this paper: Omari, G.C., Ma-nyele, S.V. and Mwaluko, G. (2017) Analy-sis of Stress Backlogs during Case-File Processing in Forensic Science Laboratory.
Engineering, 9, 1060-1096.
https://doi.org/10.4236/eng.2017.912063
Received: November 15, 2017 Accepted: December 26, 2017 Published: December 29, 2017
Copyright © 2017 by authors and Scientific Research Publishing Inc. This work is licensed under the Creative Commons Attribution International License (CC BY 4.0).
DOI: 10.4236/eng.2017.912063 1061 Engineering
Keywords
Forensic Science Laboratory, Case-File Processing, Backlogs, Forensic Chemistry, Forensic Toxicology, Forensic Biology/DNA, Case-File Influx
1. Introduction
The word forensic comes from the Latin word forensis which implies public, to the forum or public discussion; argumentative, rhetorical, belonging to debate or discussion. Thus, Forensic Science relates to fact-finding through use of scientif-ic methods, and the applscientif-ication of those facts to laws or in a court of law. Crim-inal investigation is an ancient science that may have roots as far back as 1700 BC. When a serious crime is investigated, the investigation process typically con-sists of four steps: physical evidence is collected at the crime scene by police of-ficers or crime scene investigators; the physical evidence is analyzed by forensic scientists (often chemists) in a laboratory; all the evidence (that means the ana-lyzed physical evidence and other evidence like eye witness stories, police reports, crime scene sketches and interrogation, etc.) is interpreted by detectives; and evi-dence is presented in court.
In Tanzania, forensic sciences are used around the country to resolve civil dis-putes, to justly enforce criminal laws and to protect public. There is one main fo-rensic science laboratory in Tanzania, publicly owned and specializing in foren-sic toxicology, chemistry and biology/DNA. Forenforen-sic scientists are always involved when unbiased, objective and scientific analysis is needed to find the truth and to seek justice in a legal or civil proceeding. A forensic science laboratory is a common term for a facility where personnel process evidence using scientific methodolo-gy (more often related to crimes and crime scenes). The evidence processing and analysis in a forensic science laboratory include DNA, blood alcohol, blood and urine drug analysis, drug of abuse analysis and chemicals generically referred to as controlled substances, explosive evidence analysis, toxicological analysis, arson and many other areas. Drugs of abuse or controlled substance identification are the analysis performed in the largest percentage in the Tanzanian FSL. In most countries, like Tanzania, FSLs are a critical component of criminal investigations and the administration of justice, which are publicly funded. The FSL examine and report on physical evidence in criminal matters and also provide court testimony or expert witness regarding that evidence. The FSLs receive requests for forensic services from a variety of sources, including the police, other law enforcement of-ficials, medical examiners, advocates and correctional facilities. The critical prob-lem facing most FSLs is workload, leading to high backlogs, analysis of which forms the main focus of this study.
DOI: 0.4236/eng.2017.912063 1062 Engineering
laboratory from a single criminal incident, which may require more than one re-quest for forensic science services but may also involve a large number of samples or exhibits that require laboratory analysis. For instance, a laboratory may receive samples of stained clothes; specie remains and fresh blood (splatter) from the same case that requires analysis by different disciplines of the FSL. This study ex-amined workload in terms of both case-files received and reported. The main prob-lem addressed in this paper is large extent backlogs in the different forensic science disciplines.
Greatest personnel need is based on the largest number of backlogged case-files or samples. The ability to process a larger percentage of evidence depends on nu-merous factors including the complexity of the procedures, use of innovative solu-tions, and availability of competent, skilled and experienced analysts and other resources. When laboratories are unable to complete all outstanding requests, the remaining requests are backlogged. The completion rate will be lower for more complex types of analysis, such as DNA analysis and biology screening. Biology screening (usually in preparation for DNA analysis) represents the next highest need for an increase in full-time analysts, followed by firearm and tool marks analysis and analysis of trace evidence, such as hair and fibers.
There is no industry wide agreement about what constitutes a backlog. Iden-tifying a case-file as backlogged depends on time it stays in the laboratory with-out being reported. Some researches like the National Institute of Justice (NIJ), assume that case-files held for 30 days or more are classified as backlogged. Many FS laboratories, however, consider a case backlogged if the final report has not been provided to the agency that submitted the case. The definition one uses na-turally affects the count of cases backlogged. In addition to the definition of a back-log, identifying the type of backlog is also important. In this study, case-file is assumed to be completed after a final report is signed by the Chief Government Chemist, and backlogs are counted for 7, 14 and 30 days (i.e., a week, 2 weeks and 4 weeks).
DOI: 10.4236/eng.2017.912063 1063 Engineering
Why is demand increasing for forensic testing in Tanzania, is a question that attracts attention of researchers. The demand for DNA testing, for instance, is ris-ing primarily because of increased awareness of the potential for DNA evidence to help solve cases. The demand is coming from two primary sources: 1) the in-creased amount of DNA evidence that is collected in criminal cases; and 2) the expanded effort to collect DNA samples from convicted felons and arrested per-sons. For instance, the increase in demand for forensic chemistry analysis is main-ly due to proper control of drugs of abuse, legality of owning firearms, and un-controlled use of chemicals and precursor chemicals potential, for manufactur-ing drugs of abuse.
The forensic cases backlog within the FSL can have significant effects. Backlogs may delay legal proceedings that are waiting for results of analysis. On the other hand, backlogs can also prevent the timely capture of criminals, prolong the in-carceration of innocent people who could be exonerated by evidence, and adversely affect families of missing persons waiting for positive identification of remains. Additionally, delays may increase the costs to contributors who must turn to pri-vate laboratories for testing because the public FSL is not able to produce timely results.
In Tanzania, public funds have been used to purchase automated testing equip-ment and high-throughput instruequip-ments, hire new personnel and validate more efficient standard operating procedures. Without this funding, the backlog pic-ture would be much worse. The FSL management has several programs to help laboratories address their workload. Some programs address overall DNA back-log reduction; others are specifically for testing samples from convicted offend-ers and arrestees. Different strategies have been suggested to manage workload in FSL. Most laboratories engage special procedures to manage their workloads in-cluding the following strategies: prioritizing requests by investigative need, screening out requests for cases that will not be prosecuted, allowing customers to cancel requests for services no longer needed, assisting laboratories in the same system that have larger backlogs, and establishing backlog reduction programs with short and long term goals.
The program’s short-term goal is to reduce the backlog of untested cases by pro-viding crime laboratories with funds to work more cases. In-house long-term goal is to build the capacity of FSLs by providing funds to purchase high-throughput instruments capable of processing multiple samples at the same time, automated robotic systems and laboratory information management systems to manage the data generated more efficiently. Funds can also be used to validate newer, more ef-ficient laboratory procedures and hire additional personnel. Out-sourcing is nor-mally not practiced in Tanzania, especially for cases that require forensic science laboratory analysis.
im-DOI: 0.4236/eng.2017.912063 1064 Engineering
plementation of LIMS can reduce backlogs, allow for effective tracking, and also assist personnel and laboratory management. This study established forms and datasheets to track turnaround times and backlogs. In the FSL, evidence can re-quire testing in multiple case working laboratories, while some pieces of evi-dence from a case may not require any forensic testing. Testing evievi-dence in mul-tiple laboratories leads to extended turnaround time (TAT), hence case-files enters backlogged form. Evidence receiving personnel maintain a paper-based chain-of-custody to record inter-unit exchange of evidence. Determining back-log statistics and tracking cases through the FSL is intensive without automated systems.
The FSL in Tanzania is under a great pressure to keep up with increasing case-file workloads. Demand on the FSL in Tanzania has expanded leading to the proportion of the backlogged cases to increase accordingly. This problem led to the initiation of this study in order to quantify the backlogs and hence find means of reducing the backlogs. Due to FSL’s backlogs and lengthy turnaround time, cus-tomer frustrations have been on rise caused by the need to complete the analysis in time for scheduled hearing dates and general court decisions. Most laborato-ries are undersized, underequipped, understaffed, and overwhelmed with back-logged evidence analysis requests. FSL has extremely limited capability in the type of toxins, drugs of abuse, and blood drug analysis that can be conducted, and as mentioned earlier, it has suffered with backlogged evidence analysis requests for many years. In this study, data on backlogs collected from three different FSL disciplines from three different FS in three consecutive years was analyzed. This study forms the backbone of the laboratory expansion efforts currently being underta-ken by the FSL management.
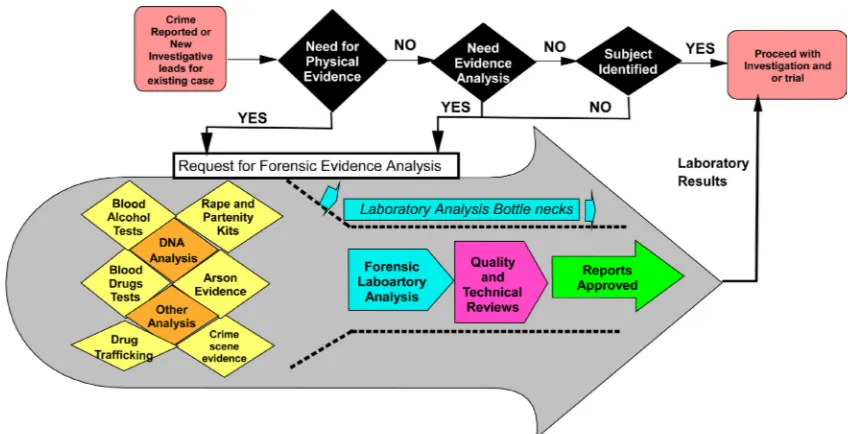
DOI: 10.4236/eng.2017.912063 1065 Engineering Figure 1. Forensic science laboratory evidence analysis workflow showing bottleneck due to increasing number and types of analysis requests with its connection to the major clients.
Based on Figure 1, the fact that technology for forensic laboratory analysis changes faster, there is a need of new supplies such as software’s, equipment and timely delivered reagents and maintenance services. Quality and technical re-views is important to meet the international standards such as the ISO 17025 and 17020. In addition, skilled personnel who can interpret and approve the tech-nical report are required all the time. A forensic techtech-nical report needs to be writ-ten clearly and effectively, as it engages the readers and their needs (investigator, prosecution or the judiciary), while also meeting the report’s objectives. While proving, the report should be structured to have a maximum impact and the ap-prover should edit with an eye for errors and improvements that can be made and hence present a report that appears professional. Therefore, according to Figure 2, such bottlenecks will cause a delay in deciding whether forensic results re-ceived can proceed with the investigation or trial or if there are new investigative leads obtained.
2. Literature Review
2.1. Categories of Backlogs in Forensic Science Laboratories
Laboratory backlogs are usually expressed using number of samples submitted to the FSL expressed on monthly [5] or yearly basis [6] [7] [8]. Others report also categories of cases whether requested but not yet analyzed or potential cases un-requested (Goulka et al., 2010). Some researchers report the nature of case-files backlogged as homicides and rape cases [8] [9], crimes against person [6] and prop-erty crimes [6] [8] [9]. Other researchers eliminate and report laboratory back-logs by stating the type of analysis required such as DNA analysis sample [1] [2]
[3] [7] [10] [11] [12]. In California, for instance, the total backlogs were expressed
con-DOI: 0.4236/eng.2017.912063 1066 Engineering
trolled substances [13].
The backlogged cases exist in both forensic science laboratories (such as, DNA laboratories reported above) and in the law enforcement agencies [9]. Forensic toxicology and chemistry backlogs are least reported in literature compared to DNA cases. Surveys on law enforcement evidence backlogs shows that property crimes are not routinely requested for analysis because, with limited capacity, more se-rious crimes have taken precedence with changing trend [7] [8] [9].
To reduce backlogs, the law enforcement officers have discretion on what evi-dence to send for analysis. In England, for example, police departments choose which sex-assault evidence should be subjected to DNA testing [14]. Anything not submitted to the FSL is not regarded as backlog in the law enforcement shelves. Backlogs in FSL have attracted attention of the public, pressure groups in the world [15], media [16] [17], leading to wider range of responses from elected of-ficials, and law enforcement leaders [16] [17] [18] [19]. To eliminate backlogs in FSL, some laboratories have adopted information technologies designated to im-prove laboratory workflow LIMS [3]. Computerized systems like LIMS can receive and catalog requests, track evidence and sample, and report location and status during analysis, and facilitate the creation, dissemination and archiving of reports
[1] [2].
2.2. Backlogs of Forensic DNA Evidence
The DNA evidence backlog is complex and requires an understanding of the types of backlogs that exist and the ways forensic science laboratories work. The average time that it takes the FSL to provide DNA testing results, for example, is lengthy especially in USA, where it takes turnaround time ranging from ap-proximately 150 days to over 600 days [12]. Additional staffing with the exper-tise to perform DNA analysis would assist in reducing the backlog, while the management is pursuing various strategies to help reduce the forensic DNA case backlog.
This study has been able to identify the type of backlog being referenced (that is, DNA casework backlogs, toxicology and chemistry backlogs). In addition, some samples can be degraded or fragmented requesting extra time due to produced partial genetic profile with allele and/or locus dropout [20], which leads to ex-tended TAT and hence backlogs. In this study, untested evidence collected from crime scenes and stored in law enforcement evidence rooms that has not been submitted to a FSL for analysis was not considered as FSL backlog. In this study, data has been captured by using dates of submission and report approval, by ex-amining case by case throughout the year. Addressing the Forensic DNA Case-work Backlog has been a continuous effort in FSL, such that the FSL has increased its capacity to work cases significantly, although the laboratories are unable to com-pletely eliminate the backlogs.
2.3. Backlogs in Forensic Chemistry Testing
ar-DOI: 10.4236/eng.2017.912063 1067 Engineering
son, etc. Drug problems in our communities have escalated recently in Tanzania. Law enforcement is in a continual fight against illegal drug manufacturing, pos-session, sale, and use. Crimes committed due to drug use and abuse range from burglary, to robbery/armed robbery, rape cases and murder. Proprietors of this type of crime are usual in the middle of their criminal character and often have a history of drug abuse [21].
Currently, large quantities of drug evidence are collected and submitted to fo-rensic science laboratory at GCLA. New designer drugs emerge regularly, re-quiring forensic science laboratories to develop new analytical techniques and spend more time on analysis. Both situations add to the substantial evidence analysis backlogs. In many cases, timely analysis of substances is of critical im-portance in numerous ongoing investigations. Although results are reported time-ly compared to DNA testing, forensic chemistry laboratory has a controlled sub-stance analysis backlog of cases. Unfortunately, those backlogs are not due to lengthy analysis and confirmation of a particular drug, but rather, for a labora-tory test reports for drugs. This is caused by large number of submission and sam-ple influx [22]. When results require repeated work, case-files with masked sam-ples or mixed products, etc., the forensic scientists require extended turnaround times to resolve the analytical challenges, leading to increased backlogs. The con-trolled substance/illicit drug backlog is partly due to the laboratory being least funded with less equipment, even when analysts are added to increase the analy-sis capacity.
It should be noted that, forensic chemistry laboratory does most of the Drug Urine Investigation (DUI) blood analysis (alcohol and other drugs) controlled sub-stance analysis. The prescription opioid pain relievers and heroin kills many people due to overdose. Common drugs involved in prescription opioid deaths include: methadone, oxycodone, and hydrocodone. Large quantities of drug evidence are collected and submitted to FSL, with types ranging from heroin, cocaine hydroch-loride, bhang (Cannabis sativa sp.), mirungi-khat (Catha edulis) and others. In many cases, timely analysis of substances is of critical importance in numerous ongoing investigations. Undercover detectives, drug task force officers, patrol of-ficers, and others conduct drug buys, reverse buys, and related operations to iden-tify and apprehend drug dealers, traffickers, illicit drug manufacturers, etc. Fail-ure to correctly determine that a substance is in fact a particular drug; or that a substance is not the purported drug, but rather, a fake non-drug substance may poses significant problems to the investigations.
DOI: 0.4236/eng.2017.912063 1068 Engineering
reference sources such as a similar printed or electronic reference source. The FSL conducts confirmatory analysis using a Gas Chromatograph Mass Spectrometer (GCMS) for the purpose of reliability and accuracy [23] [24]. However, many illi-cit drugs are manufactured in a manner (disguised) to duplicate the physical size, shape, color, and markings of prescription medications, etc. The reference sources often used to examine such evidence in a criminal case are not accurate to any known degree of uncertainty.
2.4. Backlogs in Forensic Toxicology
The charter for forensic toxicology at GCLA states 14 days from receiving to is-suing of the laboratory results, although this time is often exceeded, leading to backlogs. Other laboratory reports take even longer backlogs. The toxicology sec-tion for instance, has the unique capability to complete blood alcohol evidence analysis from DUIs in approximately 3 to 4 weeks, that is, 21 to 28 days. Such attended tests lead to longer TAT and backlogs. Low analysis capability reduces the ability to solve crimes, prevent crime, and save lives and keep the customers comfortable and satisfied. Without sufficient forensic toxicology laboratory ca-pacity and capability, not all potential evidence can be recovered, some evidence becomes unusable, many cases are not prosecuted, and numerous cases remain unsolved.
The toxicology laboratory at GCLA is the only laboratory in the country, such that it must have sufficient capacity to offer full service of forensic evidence analy-sis. Forensic toxicology requires large evidence processing work space, specialized equipment, laboratory facilities (freezers and cold rooms, digesters, fume hoods, etc.) office, and support areas to conduct the analysis and other associated actions correctly and in a timely manner.
Compared to forensic chemistry, in addition to increasing in demand (requests) of the use of forensic science in judiciary system forensic toxicology faces a chal-lenge of isolating metabolites in human body remains such as organs to trace toxic substances, leading to backlogs. The toxicology laboratory is overwhelmed with evidence backlogs of its own. The FSL does not have sufficient forensic labora-tory capacity to process all of the available toxicological evidence from crime scenes. Much of the potential evidence sits on cold room shelves without undergoing processing and analysis (i.e., backlogged) due to poor sample collection tech-niques.
3. Methodology
3.1. The Concept of Stress Backlog
DOI: 10.4236/eng.2017.912063 1069 Engineering
TAT. These factors have attributed to different workloads which not limited to unattended case-files, pending samples to be analyzed, increased Turnaround time for analysis, unsatisfied clients/customers external and within the organiza-tion. Dealing with such unexpected responsibilities and pressure that do not align with normal FSL activities, knowledge, skills or expectations of the analysts has been defined in this study as stress backlog. Thus, stress backlogs were de-termined as number of case-files unattended that cause stress among FSL em-ployees.
A backlog may be of either administrative type (forms that need filing, docu-mentation, instructions, and analytical reports to be written or reviewed), that keeps piling up on FSL manger’s desk, for instance. This causes an extended to-tal TAT and slowly the FSL performance starts decreasing. Stress backlog drains the energy and reduces the competitiveness of FSL which then takes its focus away from where it should be. Backlog may have an impact on the FSL’s future earn-ings, as it is unable to meet demand. Thus, stress backlog is a buildup, undone or pending work that needs to be attended and completed. In this study backlogs of case-files within the FSL were determined and evaluated.
3.2. Determination the Stress Backlog
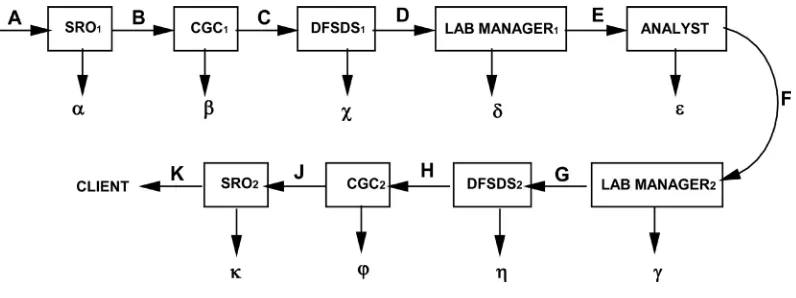
The number of backlogged case-files was determined on each work station by com-paring case-files in and case-files out, in a specified time interval, say 7 days, as shown
in Figure 2. The backlogs were determined for SRO work station, for example, by
the Equation (1):
A B− =α (1)
For SRO as a work station, backlogs are created while receiving and distribut-ing case-files, such that A is the number of case-file received at SRO’s office, B is the number of processed case-files (transferred to CGC for instructions submit-ted) and the difference between A and B is the stress backlog, denoted as α.
[image:10.595.142.540.566.715.2]The flow streams from A (request) to K (reports), contain different actions in-cluding instructions (A to E), sample submission by SRO (E), analysis, report preparation (E to F), report review (G, H), report approval (H, J) and report col-lection (K). All these actions points suffer from piling uncompleted tasks, when
DOI: 0.4236/eng.2017.912063 1070 Engineering
assessed in 7, 14 or 30 days periods, defined in this study as stress backlogs. At each point, a comparison of case-files received and completed, leads to number of case-files backlogged. Analysis of all kinds of backlog from α to к in Figure 2
is a complex engineering problem which requires a separate study.
It should be noted that for SRO’s office, another type of backlog is defined using symbols “к”, that is, the analytical reports remaining there without being delivered to the clients or uncollected reports. Also, only the analysts has one type of backlog that is, which appears once (once through) denoted as “ε” in
Figure 3, with subscript “c” denoting case-files. All other blocks have two types
of backlog for case-file receiving process to the analyst level, and report flow from analyst to the client (i.e., each case-file passes these points twice). For sim-plicity of analysis in this study, the case-files backlog is thus defined for com-bined blocks SRO1 to CGC2, leading to general or overall Bgc defined as per
Equ-ation (2):
(
)
gc c c
B = A −J (2)
Defining Ncr and Ncp as number of case files received and processed,
respec-tively, across the FSL, leads to the overall backlog Equation (3):
(
)
gc cr cp
B = N −N (3)
Equations ((2) and (3)) apply for overall backlog analysis regardless of the FSL discipline. When backlog data for specific discipline is required, a section is made across point D and the former point J in Figure 2, leading to Equation (4) for each laboratory discipline:
(
)
(
)
, , , , ,
gc i c i c i cr i cp i
B = D −J = N −N (4)
where i = 1, 2, 3, representing the three laboratory disciplines.
Specifically, the quantity Bgc comprise of all delayed processes from α to φ as
per Equation (3). Although several backlogs are defined as per Figure 2, in this study however, only Bgc was assessed. While there are backlogs of case-files in all
steps of case-file processing ladder, the backlogs are different in nature covering samples, un-submitted samples, and untested, unveiled instructions, incomplete reports, unreported reports, un-dispatched reports, etc. Analysis of such back-logs is complex. This study focuses on backlogged case-files after submission to the laboratory manager, director up to final approval by CGC, as per Equation (2). It should be noted that the backlog represented as Kc was removed in the
analysis because it depends on external client’s performance in collecting the re-ports, and is beyond FSL’s control. Moreover, the above analysis covers only back-logs in case-files, which travel from point A to K in Figure 2 different from sam-ples, which start at point A and ends at point F, after analysis is completed.
3.3. Time Interval for Backlog Determination and Statistical Analysis
DOI: 10.4236/eng.2017.912063 1071 Engineering
days interval can be used. Backlog involving administrative or approval processes require estimation starting from 2 days to 30 days. The data for backlog using Bgc
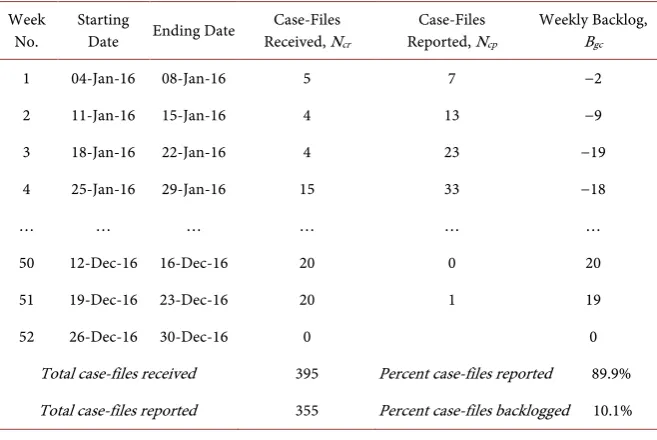
was established on weekly basis, as baseline time interval. Based on the analysis conducted in this study, that is, case-files only, backlogs were initially recorded based on weekly basis (Table 1) which can be transformed into 14 days (bi-weekly backlogs) and 30 days (monthly backlogs). As shown in Table 1, the final results at the end of a calendar year are the same. The bi-weekly backlog data is useful when results are to be compared with the laboratory service charter for FSL. In this study 7 days, or one week (five working days) was used as a reference time, so that N = 52 weeks, is long enough for statistical analysis. Statistical analysis was conducted by estimating average values, standard deviation, skewness and kur-tosis of 7-day (weekly) backlogs, with N = 52 (weeks per year).
3.4. Negative and Positive Backlog Values
Given a total number of case-files received into the FSL discipline per week (Figure 3), if the number of case-files received is higher than the number of case-files re-ported or processed (case-files out) then, Bgc > 0 and the backlog value is a positive
integer. This implies that the specific laboratory is creating new backlog. On the other hand, when Bgc < 0, it means many case-files were reported than
re-ceived, indicating that the respective discipline of FSL was dealing (processing) withheld or formally backlogged cases as a means of dealing with backlogs eli-mination.
3.5. Determination of Percentage Case-Files Backlogged
Let Ncr = number of case-files received into the FSL and that, at the end of the
[image:12.595.209.538.508.728.2]year Ncp case-files are processed and reported, then the percentage case-files
Table 1. Determination of weekly backlog during case-file processing in forensic biology/ DNA for 2016.
Week No.
Starting
Date Ending Date
Case-Files Received, Ncr
Case-Files Reported, Ncp
Weekly Backlog,
Bgc
1 04-Jan-16 08-Jan-16 5 7 −2
2 11-Jan-16 15-Jan-16 4 13 −9
3 18-Jan-16 22-Jan-16 4 23 −19
4 25-Jan-16 29-Jan-16 15 33 −18
… … … …
50 12-Dec-16 16-Dec-16 20 0 20
51 19-Dec-16 23-Dec-16 20 1 19
52 26-Dec-16 30-Dec-16 0 0
Total case-files received 395 Percent case-files reported 89.9%
DOI: 0.4236/eng.2017.912063 1072 Engineering
backlogged, Pcg, can be determined from Equation (5):
100% 1 100%
cr
cr cp cp
cg
cr
N N N
P
N N
−
= × = − ×
(5)
Equation (3) can be used regardless of the time interval used to define back-logs (7, 14 or 30 days, or 1 year).
4. Results and Discussion
4.1. Overall Analysis of Case-Files Received and Reported by FSL
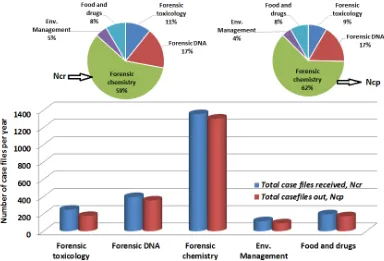
In the FSL, there are three laboratories which mainly receive forensic case-files (forensic toxicology, forensic chemistry and forensic biology/DNA). However, three other laboratories receive case-files for analysis of product quality, microbiology food, drugs and environmental management, but also support the FSL where ne-cessary. In all six laboratories, there is a big difference in the number of case files received (Ncr) and processed and reported (Ncp), a comparison of which is shown
in Figure 3 (for Y2016). Forensic chemistry laboratory receives and processes
the largest number of case files followed by forensic biology/DNA, as summarized in the pie chart for Ncr data. To express the extent of case files backlogs, a
com-parison between Ncr and Ncp values for the five laboratories is presented in
[image:13.595.153.537.431.692.2]Fig-ure 3.
Figure 3 shows also that, in forensic chemistry laboratory Ncr is almost equal
to Ncp in most laboratories (with exception of forensic toxicology) that is, the
FSL has reached a point where the output or analytical reports released is equal
DOI: 10.4236/eng.2017.912063 1073 Engineering
to demand based on the requests received from different authorities. This shows that the performance of FSL has increased in terms of case-file processing, at-tending case-files submitted for analysis requested for forensic chemistry. The higher values of Ncr and Ncp indicate that there is increase in demand of forensic
chemistry services compared to other FSL services. This may be due to increase in quality of analytical reports and reliability of results. This can be attributed to the fact the FSL has increased spending in advertising and training of stakehold-ers especially during public events.
Large number of case-files (Ncr) in forensic chemistry causes staff to consume
most of their working hours dealing with backlog elimination since such surge in case-files in one laboratory discipline causes backlogs in other laboratories as more manpower is directed towards that laboratory. Analysts from other discip-lines are always re-allocated to help reduce the piling case-files, especially during instrumental analysis and drafting the reports. This means there is re-allocation of staff and budget from other disciplines of FSL, because reagents and chemicals are consumed more than what was planned. Therefore, an increase in budget or re-allocation of funds is inevitable. To minimize backlogs, emergency fund for elec-tricity and water bills (as utility) is consumed faster than the normal rate. Differ-ences in percentage distribution of Ncr and Ncp among different laboratories, are
a clear picture of differences in demand placed on the laboratories and performance (how much is managed by each laboratory).
Forensic laboratory analysis to support investigations is costly but the parties commissioning these investigations are often unaware of this fact. For them, the forensic laboratory investigations are “free”, and they behave as if there are no financial or capacity limitations. This is a major problem that has created back-logs in FSLs. Backlog elimination causes other work in the FSLs to drag behind due to inconveniences caused by extra expenditure sharing and shifting analysts, increased need for new staff allocation, frequent review of the budget and stra-tegic plans which impact the FSL competitiveness negatively.
4.2. Analysis of Case-Files Influx into Different FSL Disciplines
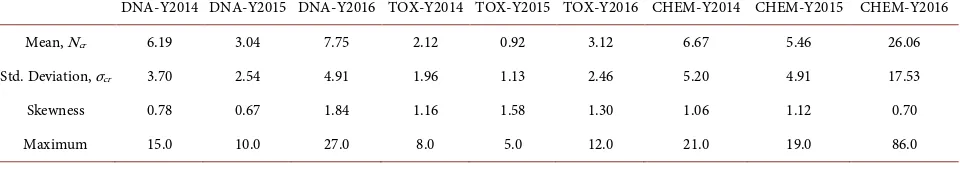
[image:14.595.59.539.644.730.2]The statistical analysis of the case-file influx into the FSL in three consecutive years is presented in Table 2. While the mean case-file influx shows the number of case-files per week, standard deviation gives an estimate of the fluctuations in the data for N = 52 weeks. The values of skewness shows that the inherent probability
Table 2. Statistical analysis of the weekly case-file influx into forensic science laboratory in the three consecutive years (Y2014 to Y2016).
DNA-Y2014 DNA-Y2015 DNA-Y2016 TOX-Y2014 TOX-Y2015 TOX-Y2016 CHEM-Y2014 CHEM-Y2015 CHEM-Y2016
Mean, Ncr 6.19 3.04 7.75 2.12 0.92 3.12 6.67 5.46 26.06
Std. Deviation, σcr 3.70 2.54 4.91 1.96 1.13 2.46 5.20 4.91 17.53
Skewness 0.78 0.67 1.84 1.16 1.58 1.30 1.06 1.12 0.70
DOI: 0.4236/eng.2017.912063 1074 Engineering
distributions of the case-file influx data are closer to the normal distribution, but slightly skewed to the right hand side (towards higher values of case-file influx per week). The maximum values indicate the largest recorded number of case-files re-ceived per week in the respective laboratories for each calendar year.
It should be noted that the case-files received during each week are regarded as new cases, while case-files processed and reported during a given week may include those accumulated in the former weeks. The unattended case-files at the end of the week are regarded as backlogs regardless of when they are received. Similarly, on annual basis, unattended case-files at the yearend are included as backlogs in the following calendar year. Figure 4 presents the weekly average data for new case files received or a demand for forensic analytical services for the three consecutive years.
[image:15.595.214.538.505.694.2]The capacity of laboratories to complete cases-files grew at about the same rate as new cases were submitted, as shown by the “completed cases” data. But the number of new cases submitted grew faster than did the capacity to process the new and present workload, hence, a backlog. Backlog is partly the result of repeated decisions by the law enforcers by submitting new or extra samples in particular cases that had been already completed the laboratory analysis. Most of the forensic laboratories refuse to straight identification which involves a drugs analysis case work without a suspect. Thus, such cases may be pending to the submission of the suspect’s reference sample adding to backlog. This is observed in more serious cases such as those of rape, murder which need biology/DNA testing. In any case, the growing reliance on forensic evidence to solve and pros-ecute crimes contributes to the increase in forensic case processing and hence the backlog.
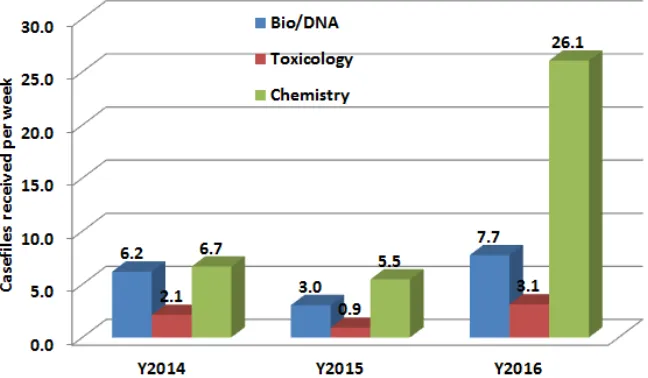
Figure 4 shows the weekly case-file influx into the three FSL disciplines
(fo-rensic chemistry, biology/DNA and toxicology) for three consecutive years 2014, 2015 and 2016. In all the three years studied, the case-file influx was the highest
DOI: 10.4236/eng.2017.912063 1075 Engineering
for forensic chemistry, which increased about four times in the Y2016. This in-crease led to higher demand for new, powerful and validated forensic detection methods which have the great effect in the criminal investigations. The Ncr for
forensic biology/DNA changed slightly to 6.2 in Y2014 to 7.7 case-files per week on average in Y2016. On the other hand, case-files influx for toxicology was the lowest (at a maximum of 3 case-files per week in Y2016).
[image:16.595.242.509.428.693.2]However, the fact that forensic chemistry had more case-files received than any other forensic science discipline, calls for action on the two factors that have a significant impact on the caseload in forensic chemistry laboratory that is the crime rate and the scientific and technological capabilities of the laboratory. The way in which crime rate impacted forensic chemistry laboratory performance and the rest of the FSL is similar to the way it influences the broader law en-forcement community. However, the impact of scientific progress and technolo-gical innovation is far more complicated, and clearly sets forensic chemistry la-boratory apart from their main customers. Advances in forensic science tech-nology tend to increase the caseload in the forensic chemistry laboratory some-times dramatically even when the crime rate is not equivalently high. On the other hand, to various extents powerful forensic techniques replace more traditional and time-consuming investigative methods, or at a minimum can provide more focus to a criminal investigation.
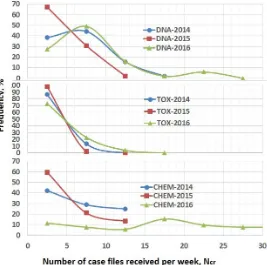
Figure 5 shows the PDFs of Ncr data from three FSL laboratories fromY2014
to Y2016. The PDFs of Ncr data differ in shapes between different laboratories,
showing that the case-file reception data differ and is also affected by different
DOI: 0.4236/eng.2017.912063 1076 Engineering
factors. This is due to differences in the nature and frequency of occurrence of crimes, skills among investigators that utilize the FSL disciplines. For instance, frequency of occurrence of poisoning incidences requiring toxicological analysis is different from crimes requiring DNA test. On the other hand, forensic chemi-stry case files involve crimes related to drugs of abuse, arson samples, explosives, etc., occurrence and frequency of which are completely different from toxicology cases. Comparison of PDFs will allow the FSL to plan for analytical capacity in the three laboratories in terms of utilities, financial and human resources. In Y2016, the PDFs can be characterized by wider span and long tails, showing that case-files are received in large numbers per week.
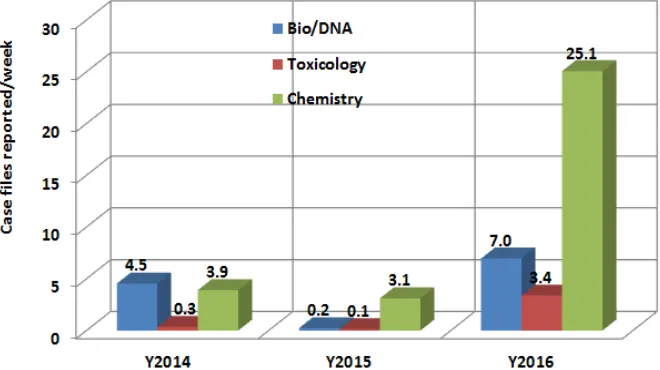
4.3. Analysis of Case-Files Reported by Different FSL Disciplines
Although drug evidence accounts for the largest share of forensic workload (com-pared to toxicology, biology/DNA analysis, and other requests), the process of iden-tifying a controlled substance is not as time-consuming as other forensic functions. It was observed in this study that, forensic chemistry had processed about 25.1 case-files per week, being 6 times increase compared to Y2014, attributable to increased demand for analysis, as shown in Figure 6. In addition, highest case-files reporting in forensic toxicology was observed only in Y2016 at 3.4 case-files per week.
[image:17.595.210.540.508.693.2]On the other hand, highest case-file reporting in forensic toxicology and biol-ogy/DNA was observed also in Y2016 at 3.4 and 7.0 case-files per week, respec-tively, as shown in Figure 6. This increased reported case-file per week for biol-ogy/DNA was contributed by increased capacity via purchase of new equipment which further streamlined the testing processes such as polymerase chain reac-tors (PCR), micro-centrifuges, vortexes, pipettes and a bone grinder for chal-lenged samples. For toxicology laboratory, the increased performance in Y2016 can be attributed to the completion of rehabilitation of the laboratory in Y2015
DOI: 10.4236/eng.2017.912063 1077 Engineering
and procurement of glassware, sample preparation facilities and placement of new support staff including laboratory attendants.
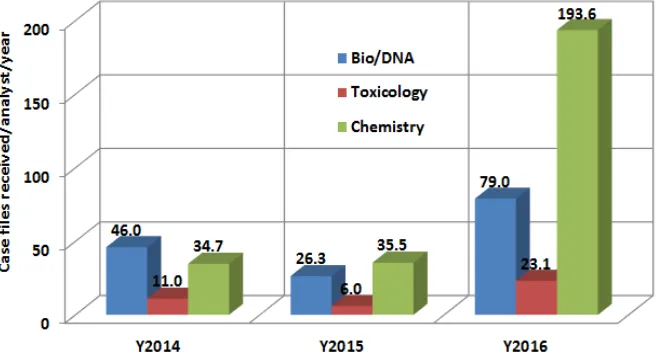
4.4. Analysts’ Workload Based on Case-Files Received and Reported
[image:18.595.211.539.518.697.2]Information on workload and performance of analysts (the average number of requests the analysts completes in a given period) can be used to determine which forensic disciplines is the overloaded or understaffed. Figure 7 shows the average case-file influx per analyst per year for the three consecutive years. The number of analysts available to carry out case-file processing is a key factor in dealing with backlog elimination even when enough facilities and resources exist. For biolo-gy/DNA, the number changed from 46 to 79 per analyst per year, from Y2014 to Y2016, respectively. The number of case-files received per analyst per year was the highest for forensic chemistry, which changed from 34.7 to 196.6 case-files per analyst per year between Y2014 and Y2016. This is a bottleneck for an acceptable analyst performance, since increased work load lead ultimately to customer complains because analysts’ performance drops.
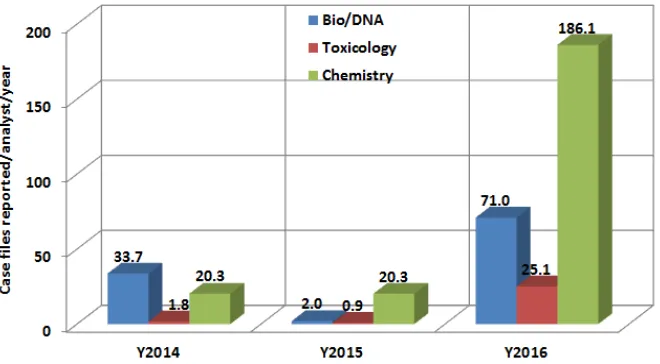
Figure 7 shows the number of case-files reported per analyst per year for three
consecutive years and also for all three forensic science disciplines. The impact of fewer forensic scientists is clear from Figure 7, whereby, case-files reported per analyst per year increased from 33.7 (Y2014) to 71.0 (Y2016) for forensic biolo-gy/DNA, 1.8 (Y2014) to 25.1 (Y2016) for forensic toxicology and 20.3 (Y2014) to 186.1 (Y2016) for forensic chemistry while the number of analysts remained con-stant. While there is always a requirement to match capacity with demand for analysis, increased demand based on case files received, Ncr, and stagnating skills
development contributed to observed increase in reports per analyst per year. While the number of case-files reported per analyst per year for forensic toxi-cology increased 14 times between Y2014 and Y2016, the workload was, however, overwhelming for forensic chemistry, during which the number of case-files reported
DOI: 0.4236/eng.2017.912063 1078 Engineering
[image:19.595.211.541.382.564.2]by each analyst rose about 9 times per year. It was further observed that, the actual case-file processing in forensic biology/DNA was approximately 33.7 (Y2014), 2.0 (Y2015) and 71.0 (Y2016) case-files reported per analyst year, about 2 times increase, as shown in Figure 7. This shows that the case-file processing capacity for forensic biology/DNA increased more than twice in Y2016 as compared to Y2014, while the highest increase was observed in forensic toxicology. Thus, the rehabilitation of forensic toxicology laboratory had stronger impact to the FSL competitiveness than purchase of equipment for forensic biology/DNA. The de-crease in reporting capacity for the forensic biology/DNA laboratory in Y2015 can be attributed to internal challenges such as extended delay in repair of the DNA analyzer. Moreover, re-Allocation of analysts from other laboratories to the fo-rensic chemistry improved the case-file processing capacity for FSL to match the demand.
Figure 8 shows the PDFs of Ncp data (number of case files processed and
re-ported) per week in the three laboratory disciplines from Y2014 to Y2016. Dif-ferent from the Ncr data, the PDFs for Ncp have similar shapes, indicating that the
factors affecting the FSL capacity in processing the case-files are similar for the three laboratories. The only difference is the span of Ncp values, being highest for
forensic chemistry followed by forensic biology/DNA and lowest for forensic toxicology. The shape of the PDFs for Ncp data did not change between Y2014
[image:19.595.55.539.649.737.2]Figure 8. Case-files reported per analyst per year in different FSL laboratories from 2014 to 2016.
Table 3. Statistical analysis of the case-file processed and reported by forensic science laboratory in the three consecutive years (Y2014 to Y2016).
Laboratory discipline DNA-Y2014 DNA-Y2015 DNA-Y2016 TOX-Y2014 TOX-Y2015 TOX-Y2016 CHEM-Y2014 CHEM-Y2015 CHEM-Y2016 Mean, Ncr 4.54 0.23 6.96 0.35 0.13 3.38 3.90 3.12 25.06
Std. Deviation, σ 5.96 0.73 8.97 0.97 0.40 4.36 5.84 5.44 22.70
Skewness 1.85 4.00 1.95 3.56 3.12 1.71 1.83 3.35 0.52
DOI: 10.4236/eng.2017.912063 1079 Engineering
and Y2016, indicating that a common working culture exist in all laboratories which has not changed with time.
[image:20.595.210.538.378.698.2]The key question answered by the results shown in Figure 5 and Figure 8 is whether the dynamics of case-file reception is the same as that of processing and reporting. The results show clearly that the two dynamical systems are different (different shapes of PDFs), leading to another complex dynamics of backlogs creation. Until when the two dynamics are forced to have the same characteris-tics, backlogs will remain a continuous and complex problem in FSLs.
Figure 9 and Table 3 provide the fitted probability distribution functions using
EasyFit software to compare between Ncr and Ncp data or their inherent dynamics.
The two data sets for Y2016 were described by three highly ranked distribution functions, both of which agreed Wakeby distribution function as the first ranking. Although the two data sets were described by Wakeby distribution function, the PDFs are completely different based on the parameters, as shown in Figure 9.
4.5. Detailed Analysis of Backlogs Data in FSL
Based on Table 1, Figure 4 and Equations ((2) and (3)), the difference between Ncr and Ncp expressed as a percentage of Ncr gives the percent of case file
back-logged, Pcg. Figure 10 shows the percentage backlogged case-files for different
la-boratories in GCLA for the year 2016. The percent of annual backlogged case-files
DOI: 0.4236/eng.2017.912063 1080 Engineering Figure 10. Percentage backlogged case-files for different laboratories in GCLA for Y2016.
for forensic toxicology is alarming, indicating that 29% of case-files were being backlogged. This can be attributed to lack of sophisticated equipment to analyze the toxicology samples thoroughly or efficiently. Moreover, a 10.1% annual back-log rate for forensic bioback-logy/DNA is also worth noting.
The backlog rate for food and drugs laboratory and environmental manage-ment laboratory were presented in Figure 10 for comparison purposes, although the data presents an alarm to the FSL management. Case-files backlogs shown in
Figure 10 have a large effect on customer satisfaction. Delay in release of results
that is more than the 14 days stated in the client’s charter, results in customer com-plaints. The value of Pcg could also result from late submissions of requests in
De-cember 2016, which still necessitates administrative efforts by the FSL management. The increase in Pcg causes the stakeholders (the judiciary, investigators and the
pa-thologists) to have a drawback in managing their cases, especially where cases de-pend on FSL results in making their final decisions. Despite the large number of case-files received in forensic chemistry, it is interesting to note that the Pcg at the
end of the year is lower compared to forensic toxicology and biology/DNA.
In addition, the technology driven case-file reports, such as DNA, have more demand because forensic science services increases quickly for such type of evi-dence, but are often not adequately factored into the budgetary models used to allocate resources to different entities within the forensic science laboratory. The expected result of abrupt peak for demand on services is a backlog creation. An increase in demand caused by an innovative forensic procedure, does not spon-taneously lead to a corresponding increase in financing as it does not come with creation of additional financial resources for publically owned entities. Also, most FSLs do not have service level agreements (SLA) with their customers or clients, limiting the amount of work that can be commissioned.
DOI: 10.4236/eng.2017.912063 1081 Engineering
Figures 4-6 in relation to the number of backlogged case-files shown in Figure 10.
This means that, there is legal pressure from the clients as compared to other labor-atories of different field in forensic science or non-forensic disciplines of the labora-tory (such as environmental management, foods and drugs laboratories). As stated above, however, when the FSL uses a new technology that allows releasing more elaborative and precise laboratory results using a technology that reduces time of report production hence reducing the turnaround time, the budgeting system does not automatically support the move. This means that backlogged case-files within the FSL is only reduced by fast pace of equipment as shown in Figure 10. However, there may be a large number of case-files that are pending within the law enforcement departments which need laboratory testing, caused by poor com-munication between the laboratories and law enforcement departments, and which is not counted as FSL backlogs in this paper.
Case-files backlogged for forensic toxicology was very high in Y2014. The work-ing environment for forensic toxicology laboratory was very complicated and it has never been managed up to the time of this study. It required intensive reno-vation in terms of working environment, space and specialized equipment and instruments, such as external cold rooms, macerators, and sensitive instruments such LC-MS-MS for toxins characterization and poison detections. In addition, more specialized or experienced staff are required, for instance, staff with medi-co-legal experience and practices. Currently, they are only staff with general che-mistry and molecular biology backgrounds.
The intense amount of resources and staffing necessary to complete the case-work may be the cause of high percentage of backlogged case-files in forensic science laboratories such as the forensic toxicology and environmental manage-ment laboratory (as shown in Figure 10). Also, the salaries for laboratory ana-lysts and technicians in FSL are not competitive with private industry with the former working in difficult environment. That is, public laboratories mostly serve as training grounds for analysts before they move to green pastures and better positions in the private laboratories or other high-paying institutions.
The case-files received and processed in the FSL differ in respect of the type of cases handled and the type of samples received within the same case-file even if they belong to the same discipline. The disparity among samples and case-files depends on crime scenes where the samples are collected, the mode of collection and the type of samples within that specific case. Case-files with biological or ani-mal/human remains tend to have complications during laboratory analysis as they require intensive processes in sample preparations before the exact chemical or bi-ological, ingredients or component or the unknown product is identified.
DOI: 0.4236/eng.2017.912063 1082 Engineering
the forensic fields that have experienced significant technological advances such as those in DNA analysis case-files. The largest increase in demand has been wit-nessed in forensic DNA analysis where such kind of processes has always affected the customers especially when the results are delayed.
4.6. Comparison of Case-File Backlogs in Different Laboratory Disciplines
4.6.1. Time Series of Weekly Backlogs
[image:23.595.56.543.333.706.2]The number of backlogged cases in forensic science laboratories changes daily among each discipline. When different laboratory disciplines are to be compared, the data collection starts at point D and ends at point J in Figure 2. New forensic evidence is submitted weekly while older cases are closed every day. Because the number is constantly changing, estimates of the number of backlogged cases are always difficult. This study presents in details a new technique for weekly backlog data collection and analysis, time series of which are shown in Figure 11 for the three laboratory disciplines. The results show that in forensic toxicology labora-tory, the number of weekly backlogged are lowest, where investigators submit very
DOI: 10.4236/eng.2017.912063 1083 Engineering
few forensic evidence cases for analysis. Due to few case-files received and re-ported for forensic toxicology, the difference, Bgc is small leading to lower
num-bers of backlogged case-files throughout the year.
This is not the case in forensic chemistry laboratory, which receive large num-bers of case-files, reporting in large numnum-bers, but Bgc is of high magnitude both
positive and negative. The negative Bgc values indicate that the laboratory has been
struggling for completing old cases most of the time, hence, highest the negative backlog. Thus, the forensic chemistry can be categorized as having strong posi-tive and negaposi-tive fluctuations in Bgc. This is observed in Figure 11 for cases of
forensic chemistry laboratory which shows highest positive and negative backlog values.
Forensic biology/DNA laboratory shows intermediate values of weekly back-logs between the other two laboratories. There are weeks where the values of Bgc
are higher and negative, due to case-file processing involving old cases (e.g., week
#5 and #30). This can be attributed to samples within the case-files being of low
grade and quality also known as compromised samples. However, samples that have been completed instantly or within the client’s charter statement are direct samples for paternity cases which do not require re-processing as they are most-ly fresh samples and few in one case-file.
[image:24.595.209.541.507.691.2]4.6.2. Comparing Backlogs between Different FSL Disciplines
Figure 12 shows that, forensic biology/DNA managed to reduce its backlog in
the year 2016, attributable to extended working hours, whereby staff were al-lowed to work extra hours. This means, FSL spent extra funds to tackle backlog. This causes deficit to other activities within the forensic science following budget re-allocation. For the case of forensic toxicology, during the year 2014, the aver-age value of 6.2 case-files backlogged per week was the highest for all laborato-ries, which decreased faster to −0.3 case-files per week in Y2016. This is due to
DOI: 0.4236/eng.2017.912063 1084 Engineering
renovation of the laboratories. In the year 2016, the renovation has just been completed, leading to less casework being backlogged (which decreased to 0.8 and −0.3 case-files backlogged per week for Y2015 and Y2016, respectively). In the Y2016, the forensic toxicology was dealing with previous workload, leading to negative averaged backlog values. This may be contributed by the effort of train-ing, outreach programs and awareness on the proper use of chemicals, especially industrial, agriculture and veterinary pesticides to the respective stakeholder, leading to reduced poisoning cases. Strict management, empowerment of regulatory sys-tems and law enforcement on chemical safety, such as, Industrial and Consumer Chemicals (Control and Management) Act (ICCA) and Tanzania Pesticide Research Institute (TPRI) has contributed to the lowering of casework received in forensic toxicology laboratory.
For the case of forensic chemistry, this laboratory has managed to maintain low level of average weekly backlogs due to the fact that procedures within forensic chemistry laboratory are not complicated and advanced compared to the other two forensic science disciplines. However, given the large number of case-files received, the laboratory performance has also improved during the study period. The laboratory has also managed the processes within by eliminating the dead time, which is the time where case-files remain in stand still without being processed. As for forensic biology/DNA, this specific laboratory experiences variations in sample influx which causes fluctuation of backlog with the average of 1.7 (Y2014), 2.8 (Y2015) and 0.8 (Y2016) case-files per week. The values of average backlogged per week pre-sented in Figure 12 are lower but manifest into large numbers in a month and also per year. However, significance technology changes have made the stakehold-ers to request for this type of analysis as it gives confirmatory results compared to speculations.
The pie chart inserted in Figure 12 shows the overall distribution of back-logged case-files among the FSL disciplines in the three-year period. Based on this distribution, it can be concluded that the backlog creation problem exist al-most equally in the three laboratories. The pie chart shows also that the total number of backlogs was slightly higher in the toxicology laboratory (37%) followed by fo-rensic chemistry (34%).
Furthermore, while Figure 10 shows that forensic chemistry has a low Bgc at
the end of the Y2016, Figure 12 presents high value of weekly backlogs in Y2016 compared to other laboratories. In spite of having both largest number of case-file influx (Figure 4 and Figure 5), also [22], the average backlogs per week are al-most the same in Y2016 for forensic chemistry and forensic biology/DNA, that is, 1.0 and 0.8 case-files per week, respectively, indicating high performance in both forensic chemistry and biology/DNA laboratories.
DOI: 10.4236/eng.2017.912063 1085 Engineering Figure 13. Case-files backlogged per analyst per year in different laboratory disciplines from Y2014 to Y2016.
Figure 13 shows the number of case-files backlogged per analyst per year. The
dif-ference between the two quantities is the case-files reported per analyst per year, presented in Figure 7.
Taking a case of forensic chemistry in Y2016, Ncr = 193.6 case-files received
per analyst per year, Ncp = 186.1 case-files processed per analyst per year, yelds
Bgc = 7.4 case-files backlogged per analyst per year (as shown in Figure 13). It is
thus important to address the problem of workload on analysts and support staff (attendants, SROs, registry etc.) if backlog are to be eliminated.
While biology/DNA analysis is generally requested in both criminal and civil cases, the demand and attention given to biology/DNA appears to exceed that of other forensic disciplines where case-files backlogged per analyst per year re-mained the highest in Y2015 and Y2016. Such public attention has resulted into complaints and criticism. Results presented in Figure 12 shows that more ana-lysts were required in the Y2015 and Y2016 in forensic biology/DNA and che-mistry, while a different case is depicted in Y2014. While re-allocation of staff to cover increased workload in some laboratories is inevitable, it creates instability of the workforce, necessitating creation of multi-professional laboratory analysts that could play similar roles in different laboratory disciplines.
low-DOI: 0.4236/eng.2017.912063 1086 Engineering
er entry levels require intensive supervision and it is difficult to get senior chem-ists in the labor market to fill supervisory posts in the FSL. Consequently, the study focused on identifying and elimination of bottle necks (as presented in Figure 1) so as to increase efficiency and hence competitiveness apart from obtaining fund-ing to hire additional forensic scientists and supervisors. In this study, a number of possible ways to achieve this goal have been identified.
Based on the data on backlogs presented in Figure 12 and Figure 13, it is clear that the FSL is required to hire additional staff to meet the expectations of the stakeholders and the communities they serve as extended TAT results also from inadequate staff to process the incoming samples. However, no standards exist re-garding the number of FSL analysts and supervisors necessary to meet the need of a particular community with a particular crime rate. To set such a standard in the future would require further research.
4.7. Statistical Analysis of Weekly Backlog Data
[image:27.595.55.540.618.723.2]Statistical analysis was used to build an insight of the nature of case-file backlogs data series, in order to allow proper planning of backlog elimination in the FSL.
Table 4 shows the statistical analysis of backlog data in forensic science
labora-tories for Y2016. Results show that the values of standard deviation for Bgc data
differ among the laboratories that is, forensic chemistry (σ = 28.01), toxicology (σ = 4.92), and biology/DNA (σ = 10.28). The Bgc data from forensic chemistry
laboratory has the highest standard deviation, meaning that on weekly basis the laboratory shows strong fluctuations in the backlogs compared to other labora-tories. A high standard deviation shows that the backlog data is widely spread (less predictable) since the laboratory receives large numbers of case-files, attached with legal pressure from the clients, but due to fewer analysts, backlogs are con-tinuously generated.
The backlog data for forensic biology/DNA shows high standard deviation of 10.28, next to forensic chemistry indicating strong fluctuations. This is due to the fact that high abrupt demand for cases which require forensic testing exist from time to time. In 2016, the number of case-files increased as well as sample influx, with each sample having a report that carries its own weight. This is dif-ferent from other laboratories such as environmental management, food and drugs testing where few samples are received. While Figure 10 shows fluctuation
Table 4. Statistical analysis of the case-files received, reported and backlogged on weekly basis (N = 52) for Y2016.
Parameter Case-files received (Dc, Ncr) Case-files reported (Jc, Ncp) Case-files backlogged, Bgc
FSL Discipline Bio/DNA Toxicology Chemistry Bio/DNA Toxicology Chemistry Bio/DNA Toxicology Chemistry
Mean 7.60 3.12 26.06 6.83 3.38 25.06 0.77 −0.27 1.00
Std. Deviation 4.98 2.46 17.53 8.93 4.36 22.70 10.28 4.92 28.01 Skewness 1.74 1.30 0.70 1.97 1.71 0.52 −0.60 −0.73 0.24
DOI: 10.4236/eng.2017.912063 1087 Engineering
with highest magnitude in Bgc for forensic chemistry, Table 4 shows that the weekly
average values are comparable to those of forensic biology/DNA, due to high neg-ative and positive backlogs. Results show also that backlogs data have stronger fluctuations than both Ncr and Ncp data for all laboratories. The Bgc data,
howev-er, shows lower values of skewness (closer to zero) compared to Ncr and Ncp,
indi-cating distributions closer to a normal distribution.
[image:28.595.209.539.463.691.2]Statistical analysis was further conducted by using PDFs of weekly backlogs data for forensic chemistry. The statistics on annual drug test request submissions and the corresponding backlogs are currently very high. Drug seizures have oc-cupied a substantial share of laboratory work in the FSL. Increased number of re-quests for drug test is an observed challenge to the FSL management. Rere-quests for the analysis of drug seizures constitute approximately half of the total volume of forensic requests submitted to FSL laboratories annually in the GCLA. Although drug seizures account for the largest share of forensic workload (compared with toxicolo-gy, biology/DNA analysis, and other requests), the process of identifying controlled substances is not as time-consuming as other forensic functions.
Figure 14 presents the PDF of weekly backlog data for forensic chemistry for
three consecutive years. Results differ widely between the three consecutive years (Y2014, Y2015 and Y2016). The values of Bgc were more uniform and
concen-trated near zero for the year 2014 with a peak at Bgc = 5 case files backlogged per
week. In Y2015, however, two peaks were observed in the PDF indicating that two or more factors were affecting the backlogs. The peak for Bgc < 0 can be at-tributed to increased effort on backlog elimination by processing older case-files, whereas, the peak at Bgc > 0 indicates frequent generation of new backlogs in the
laboratory. During Y2016, the values were spread to the left (up to −60 case-files
DOI: 0.4236/eng.2017.912063 1088 Engineering
per week) and to the right (up to 65 case-files per week). The extent of laborato-ry backlogs is indicated by the spread of backlog data on the right and left hand sides of the PDF. This shows that, more case-files were backlogged per week in the year 2016, indicated by wider spread of backlog values with long tails on both sides. The spread of Bgc data up to −60 case-files per week indicates that efforts for
eli-minating old backlogs were effective, processing up to 60 old case-files per week. On the other hand, there was high generation of new backlogs up to 65 case-files per week. That is, this year the laboratory did not perform well in terms of crea-tion of backlogs, due to several reasons, including overwhelming number of case-files, large number of samples per case-file, managers spending days in at-tending court sessions, renovation of the working areas, etc. The large number of negative backlog values for 2016 means files received in previous week were be-ing processed together with case-files received in the same week, which leads to extended TAT.
In Y2015, the weekly backlog data shows bi-modal behavior (two peaks on ei-ther side of the vertical axis), at Bgc = 5 and −15 case-files per week, respectively.
This shows that there were two dominant phenomena existing in the laboratory, which are creation of new weekly backlogs at low rate (peak on positive side) and elimination of existing or old backlogs at high rate (peak on negative side). For the years 2016 and 2014, the single peaks were on the side of new backlogs created in the laboratory at around Bgc = 5 case-files per week.
Figure 15 shows the CDFs of the weekly backlog data for the three
consecu-tive years. Cumulaconsecu-tive distribution function (CDF) of backlogged case-file data, Bgc, (a real valued variable) is the probability of that Bgc will take a value less than
or equal to x. The wide span of Bgc values in Y2016 indicates that there were more
backlogs created in Y2016 than in the previous years (Bgc > 0) and also more of
the formerly backlogged case files were processed (Bgc < 0). Results show that up
to 65 case-files were backlogged per week in 2016, while up to 55 old backlogged case-files were processed and reported per week. The Bgc were the lowest in
Y2014 with narrow span of Bgc values within 10 case-files per week. The larger
negative value of Bgc in Y2014 than the positive values, indicates that more of the
old backlogged case-files were processed than new backlogs were generated. The behavior of CDF for forensic chemistry was similar for all years except the span of Bgc values, which changed from one year to another, indicating the extent of
the backlogs problem. As shown in both Figure 14 and Figure 15, backlogs grow in magnitude (indicated by span of Bgc data) due to increasing demand for
FSL services, but on average, the number of case-files backlogged decreases with time (Figure 12). The probability of not finding a backlogged case-file (Bgc = 0)
for forensic chemistry is low between (35% - 50%) for all the three years. The probability of finding less than 10 backlogged case-files per week was 13% and 4% for Y2016 and Y2014, respectively, while there was no chance of finding Bgc <
10 in Y2015.
DOI: 10.4236/eng.2017.912063 1089 Engineering Figure 15. Plots of cumulative probability functions for weekly backlogged case-files in forensic chemistry laboratory for three consecutive years.
The PDFs are characterized by horizontal location of the peaks (values of Bgc
with highest frequency), span or range of Bgc values and the shape in general.
Differences in the three aspects indicate that different factors affect the dy-namics of backlog creation in these laboratories at different times. For DNA la-boratory, the PDFs are of the same shape with same peak location at Bgc = 5
case-files per week for the three consecutive years, while there was a shift in peak location from case-files per week = −5 to 5 case-files per week and changing shape of PDFs for toxicology between Y2014 and Y2016. The characteristics of the PDFs for Forensic chemistry laboratory were described thoroughly in Figure 14.
Figure 17 shows the cumulative functions of weekly backlogs for the three
laboratory disciplines from Y2014 to Y2016. Due to presence of positive Bgc
val-ues, for all laboratories, it is evident that there was a generation of new weekly backlogs for all laboratories. The extent of backlog creation (positive values of Bgc) was greatest for forensic chemistry and toxicology. For the case of forensic
DOI: 0.4236/eng.2017.912063 1090 Engineering Figure 16. Probability density functions of the number of case-files backlogged per week for the three forensic science laboratories in three consecutive years.
Figure 17 shows that the probability of finding new backlogged case-file (Bgc >
0) for all laboratories in Y2016 was observed to be 55%, while it was high at 70% for the both Y015 and Y2015. This shows also that backlogs creation decreased towards Y2016.as depicted also in Figure 12. On the other hand, negative values of Bgc indicates backlog elimination efforts in all the three FSLs. Forensic
toxi-cology had the least effort in Y2016 and none of the efforts were observed in the preceding years. Forensic biology/DNA had a moderate effort followed by fo-rensic chemistry, for which elimination of backlog was more effective (Bgc values