LAKE ALEXANDRINA
A thesis
presented for the degree of Doctor of Philosophy in Zoology
in the
University of Canterbury, Christchurch, New Zealand
by
JOHN HAYES
CONTENTS
Page
List of Tables
;v
List of Plates vi
List of Figures vii
Abstract x
CHAPTER
I
GENERAL INTRODUCTION
II
STUDY AREA
82. 1 INTRODUCTION
8
2.2 LOCATION AND CATCHMENT OF LAKE ALEXANDRINA
8
2.3 CLIMATE
9
2.4 SCOTTS CREEK
11
III
GENERAL SAMPLING PROGRAMME AND METHODS
15
3. 1 ADULT UPSTREAM MIGRANTS
15
3.2 OUTMIGRANT UNDERYEARLINGS
163.3 RESIDENT UNDERYEARLINGS
17
3.4 ESTIMATION OF ERROR
18
IV
EFFECT OF INTERFERENCE COMPETITION FOR
SPAWNING SPACE ON SPAWNING SUCCESS
20
4. 1 I NTRODUCTI ON
20
4.2 SPAWNING MIGRATIONS
22
4.3 SIZE OF THE SPAWNING BED
27
4.3.1 METHODS
27
4.3.2 RESULTS
28
4.4 FREQUENCY OF REDO SUPERIMPOSITION
30
4.4.1 METHODS
30
4.5 FECUNDITY
33
4.5. 1 METHODS
33
4.5.2 RESULTS
33
4.6 SPAWNING SUCCESS
35
4.6. 1 MORTALITY DUE TO REDD SUPERIMPOSITION
35
4.6.1.1 METHODS
35
4.6.1.2 RESULTS
36
4.6.2 SURVIVAL OF EGGS IN UNDISTURBED REDDS
41
4.6.2.1 METHODS
41
4.6.2.2 RESULTS
42
4.6.3 OVERALL SPAWNING SUCCESS
43
4.6.4 RELATION OF
SPAWI~ING SUCCESS TO TIME
45
OF SPAWNING
4.7 DISCUSSION
46
4.7.1 GENERAL
46
4.7.2 ASSESSMENT OF LOSS IN REDDS
53
4.7.3 INFLUENCE OF TIME OF SPAWNING ON
SPAWNING SUCCESS
57
4.7.4 SPAWNING DYNAMICS
58
4.7.5 EGG CAPACITY OF THE SPAWNING BED
62
V
POPULATION DYNAMICS
65
5. 1 INTRODUCTION
65
5.2 RESULTS
66
5.2. 1 JUVENILE OUTMIGRATION
66
5.2.2 MARK RECAPTURE OF RECENTLY EMERGED FRY
70
5.2.3 SPECIES COMPOSITION OF RESIDENT
JUVENILES
71
5.2.4 DENSITY
73
5.2.5 POPULATION SIZE AND MOTALITY OF 0+
RAINBOW TROUT
78
5.2.5.1 METHOD OF POPULATION ESTIMATION
78
5.2.5.2 RESULTS
79
5.2.6 GROWTH
82
5.2.7 BIOMASS
90
5.2.8 PREDATION ON FRY
92
5.2.8.1 METHODS
92
5.2.8.2 RESULTS
92
5.2.9 GUT CONTENTS OF UNDERYEARLING BROWN
AND RAINBOW TROUT
94
5.2.9.1 METHODS
94
5.2.9.2 RESULTS
94
5.3 DISCUSSION
97
5.3.1 EMERGENCE AND OUTMIGRATION OF
JUVENILES
97
5.3.2 MORTALITY
103
VI
SOCIAL INTERACTIONS BETWEEN JUVENILE BROWN AND RAINBOW
TROUT FROM SCOTTS CREEK
1106. 1
INTRODUCTION
1106.2
METHODS
1126.2.1
EXPERIMENTAL FACILITY
1126.2.2
EXPERIMENTAL PROCEDURE
1146.2.3
PROCESSING OF DATA
1166.3
RESULTS
1186.3.1
GENERAL
1186.3.2
MICRODISTRIBUTION
1196.3.2.1
RECENTLY EMERGED FRY
1196.3.2.2
PRIOR RESIDENCE
1236.3.2.3
FINGERLINGS
1256.3.2.4
HABITAT SHARING BETWEEN RECENTLY
EMERGED RAINBOW FRY AND
FINGERLINGS
1326.3.3
AGGRESSIVE BEHAVIOUR
1346.3.3.1
BEHAVIOURAL COMPONENTS OF
AGGRESSION
1346.3.3.2
RATES OF AGGRESSIVE ACTIVITY
1396.3.3.3
PRIOR RESIDENCE
1466.3.3.4
SIZE DEPENDENT AGGRESSION
1506.4
DISCUSSION
1526.4. 1
GENERAL MICRODISTRIBUTIONS AND SOCIAL
INTERACTIONS
1526.4.2
PRIOR RESIDENCE
1586.4.3
SIZE RELATED AGGRESSION
159VII
GENERAL DISCUSSION
1627.1
COMPETITION BETWEEN BROWN AND RAINBOW TROUT
IN THE CONTEXT OF COMPETITION AND NICHE
THEORIES
1627.2
INTERFERENCE COMPETITION FOR SPAWNING SPACE
166 7.3COMPETITION BETWEEN UNDERYEARLINGS IN
171RELATION TO MIGRATORY STRATEGIES
7.4
INFLUENCE OF INTERSPECIFIC COMPETITION IN
SCOTTS CREEK ON THE POPULATION EQUILIBRIUM
OF BROWN AND RAINBOW TROUT IN LAKE
ALEXANDRINA
1797.5
IMPLICATIONS FOR MANAGEMENT
1842. 1 2.2 2.3 2.4 2.5 3. 1 3.2 3.3 Table 2. 1 4. 1 4.2 4.3 4.4 4.5 REFERENCES APPENDICIES
BACK CALCULATION OF INCUBATION PERIODS
Particle size composition (by dry weight) of samples of the three categories of spawning substrate.
Records of redds constructed on eight regularly observed sites during the 1980 spawning season.
Survival of eggs from deposition to fry emergence for various species of Salmonidae.
Monthly mean lengths of brown and rainbow trout in each electrofishing sampling section over three summers. Number and mean size of fish used in the behavioural experiments conducted in the observation troughs during the spring of 1981.
Predicted percent embryo survival for substrate categories from Scotts Creek according to the relationship between percent embryo survival and substrate composition expressed in geometric mean diameter. From Shirazi and Seim (1979).
Cumulative distribution of particle diameter of samples of three categories of spawning gravel from Scotts Creek. Weekly number of upstream migrant rainbow trout entering Scotts Creek in 1962. From Moore et ala (1962).
LIST OF TABLES
Physical characteristics of the sections studied. Species, numbers and sex composition of upstream migrants passing through the adult fish trap in 1980. Mean lengths and weights of 1980 and 1981 spawners. Geometric mean particle diameter (mm) and variance for samples from substrate categories A, Band C.
Composition of the spawning bed and number of redd sites. Lengths and weights of female brown trout spawning in the experimental sections.
4.6 Proportion of the area of each brown trout redd in
Section 2 (constructed about 13 May) superimposed during
4.7
4.8
.4.9
the period 14 May to 16 June 1981.
Spawning success of female brown trout in each of the experimental sections.
Calculation of loss of brown trout embryos in Section 2 due to redd superimposition by rainbow trout.
Survival estimates of undisturbed eggs in the gravel determined by excavation of protected redds.
4.10 Comparative spawning success of female rainbow trout spawning during three periods of the 1980 spawning
4. 11 5. 1
5.2
5.3
5.4
season.
Egg capacity of the Scotts Creek spawning bed.
Numbers of recently emerged fry marked with fluorescent spray recaptured in the fry trap at the mouth of
Scotts Creek following release 1 km upstream on 22 and 30 November 1980 and 1 January 1981.
Mean number of fish and percentage species composition in electrofishingcatches over three summers.
Monthly densities (fish m-2) in each electrofishing section over thr~e summers.
Comparison of January density with instantaneous mortality rate (M) over the period January to April using combined mean monthly estimates for the three years 1980-1982.
5.5 Monthly estimates of biomass of 0+ rainbow trout between points A and B in Scotts Creek over three
5.6 5. 7 6. 1 6.2 6.3 6.4 summers.
Gut contents of 90 spent adults taken from Scotts Creek between 18 July and 6 October 1980.
Gut contents of 0+ brown and rainbow trout taken from Scotts Creek in the summer of 1979/80.
Mean proportions of recently emerged brown fry and rainbow fry in the different categories of microhabitat in each experiment of series I.
Comparison of F values from factorial analyses of
variance of the brown and rainbow trout tests in Series I. Comparison of mean proportions of recently emerged brown and rainbow fry in the different categories of
microhabitat between the first two days and the remaining days in the prior residence experiments.
F values for comparison between the first two days and the remaining days in each habitat pair in the prior residence experiments.
6.5 Mean proportions of fingerling brown and rainbow trout and recently emerged rainbow fry in the different categories of microhabitat in each experiment of
Series II. 128
6.6 Comparison of F values from factorial analysis of variance of the brown and rainbow fingerlings and
rainbow fry tests in Series II. 131
6.7 Percent frequency of individual behavioural component use, and tests of significance between the species and size
classes. 135
6.8 Comparison of percent frequency of individual agonistic behavioural components between intra- and interspecific interactions within each size class for experiments with
brown and rainbow fry and fingerlings in sympatry. 137 6.9 Comparison of percent frequency of individual agonistic
behavioural components between within-size-class and between-size-class interactions for each size class in experiments with brown and rainbow fingerlings in
sympatry with rainbow fry. 138
6.10 Mean species rates of aggression for the two size classes in each microhabitat, and U test significance levels for comparisons within species between microhabitats and
between species within microhabitats. 140
6.11 Comparison of mean species rates of aggression in
allopatry with species rates of aggression in sympatry in
each microhabitat. 142
6.12 Comparison between intra- and interspecific mean rates of aggression in each microhabitat for both size classes of
each species 145
6.13 Comparison between mean species rates of aggression in sympatry and .mean species rates of aggression when either
species was given prior residence. 148
6.14 Comparison between mean within-size-class and
between-size-class rates of aggression of brown and rainbow fingerlings and rainbow fry in the mixed size
class experiments. 151
Plate 3. 1
6. 1
LIST OF PLATES
Adult fish trap and fry trap in position near the mouth of Scotts Creek.
Observation troughs used in the study of social interactions among underyearlings.
16
LIST OF FIGURES
Figure Page
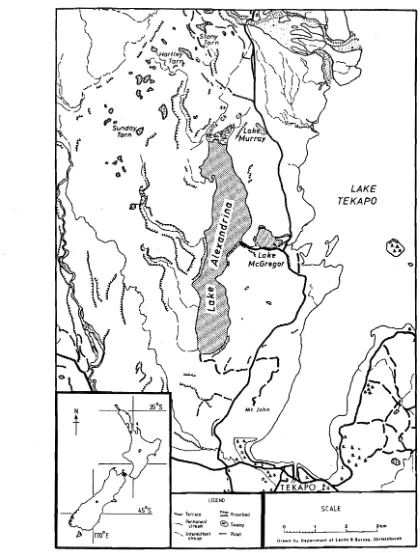
2. 1 The study area. 10
2.2 Map of Scotts Creek showing the trap site, the electrofishing sampling sections and the most
frequently used spawning areas. 11
2.3 Mean weekly water temperature and range in Scotts Creek
from May 1980 to March 1982. 12
4. 1 Daily number of upstream migrant brown and rainbow trout
in 1980. 23
4.2 Daily number of upstream migrant brown and rainbow trout
in 1981. 23
4.3 Length distributions of upstream migrant brown and
rainbow trout 1980. 26
4.4 Graphical representation of redd superimposition at site 3a. 32 4.5 Relationship between fecundity and length for brown
trout~ 34
4.6 Relationship between fecundity and length for rainbow
trout. 34
4.7 Daily catches of brown trout fry caught in fry traps below each of the experimental sections (1 and 2) over
the period 23 July to 2 September. 39
4.8 Comparison between number of adult rainbow trout arriving on the spawning ground and the number of their emergent progeny caught in the fry trap for three periods of the
spawning season. 48
4.9 Simulation of an arrival pattern of females onto a . simplified spawning bed of 25 spawning sites, and'the predicted pattern of fry emergence, given a redd site occupation period of one day, an egg deposition of 100 eggs/female, and capacity of spawning space filled
but not exceeded. 61
4.10 Simulation of an arrival pattern of females onto a simplified spawning bed of 25 spawning sites, and the predicted pattern of fry emergence, given a redd site occupation period of one day, an egg deposition of 100 eggs/female, and capacity of spawning space
initially exceeded by 50 fish. 61
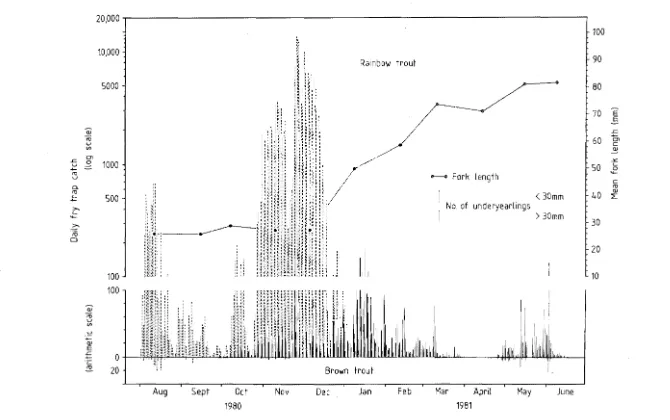
5.1 The brown and rainbow trout underyearling outmigration
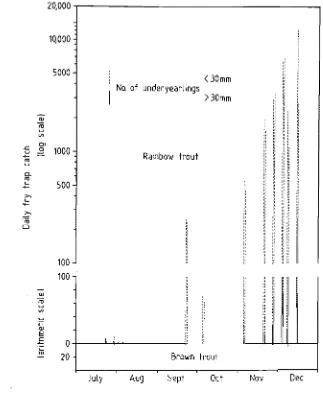
1980-1981 and monthly mean lengths of rainbow migrants. 68 5.2 The emergent rainbow trout outmigration during selected
periods of 1981 indicating the temporal pattern of fry
5.3 Combined monthly mean densities of underyearling rainbow trout in electrofishing sections 1 and 2 over three summers.
5.4 Survival curves for 0+ rainbow trout for three summers.
5.5 Monthly instantaneous loss of 0+ rainbow trout over
76
80
three summers. 82
5.6 Growth in length of 0+ brown trout in Scotts Creek
over three summers. 84
5.7 Growth in length of 0+ rainbow trout in Scotts Creek
over three summers. 84
5.8 Growth in weight of 0+ brown trout in Scotts Creek
over two summers. 85
5.9 Growth in weight of 0+ rainbow trout in Scotts Creek
over three summers. 85
5. 10 Monthly instantaneous growth rate of 0+ brown trout
in Scotts Creek over two summers. 86
5.11 Monthly instantaneous growth rate of 0+ rainbow trout
in Scotts Creek over three summers. 86
5.12 Comparison between monthly mean lengths of resident and migrant underyearlings for brown and rainbow trout over
the 1980-1981 summer. 88
5.13 Comparison between resident and migrant 0+ rainbow trout monthly length percent frequency distributions
over the 1980-1981 summer. 89
6. 1 Cumulative plots of microdistributions of recently emerged brown and rainbow fry in allopatry and in
sympatry. 120
6.2 Numbers of resident fry remaining, after emigration, in the observation troughs during prior residence and non-prior residence sympatry tests of Series I. 6.3
6.4
6.5
6.6
Cumulative plots of microdistributions of brown and rainbow fingerlings in a110patry and in sympatry. Number of resident rainbow fry remaining, after
emigration, in the observation troughs during the mixed size class sympatry tests and during the test with rainbow fry in allopatry in Series II.
Comparisons of species rates of aggression in allopatry and in sympatry overall, and in each microhabitat, for brown and rainbow trout of the two size classes.
Comparison of intraspecific and interspecific rates of aggression in sympatry in each microhabitat for brown and rainbow trout of the two size classes.
127 129
133
141
6.7 Comparison of mean species rates of aggression in sympatry and when either species was given prior
residence in each microhabitat. 147
6.8 Comparison between intraspecific and interspecific rates of aggression for each species when either species was
given prior residence. 147
6.9 Comparison between mean species rates of aggression recorded in the first two days and during the remaining days of each experiment in each microhabitat when either
species was given prior residence. 149
6.10 Comparison between mean within-size-class and
between-size-class rates of aggression in fingerling brown and rainbow trout and rainbow fry in mixed size
ABSTRACT
Interference competition for spawning space, and competition for space between underyearlings, was studied in sympatric populations of brown and rainbow trout using Scotts Creek, the major spawning tributary of Lake Alexandrina, between November 1979 and September 1983.
Redd superimposition severely limited the spawning success of both species and favoured late spawning rainbow trout. The overall spawning success, from egg deposition to fry emergence, was 2.1% for rainbow trout and 0.2% for the earlier emerging brown trout. Redd
superimposition caused a 94% reduction in the spawning success of brown trout in an experimental spawning section of Scotts Creek. Spawning of female rainbow trout was investigated with simple models to aid in understanding the relationships between arrival pattern of females, capacity for spawning space and associated redd superimposition, and pattern of fry emergence. The potential for competition for spawning space to influence timing of runs through selection acting on time of spawning was also considered.
The potential for competition for space between underyearlings in Scotts Creek was determined from an investigation of social
interactions and microhabitat partitioning in stream observation troughs. Species and size appeared more important than prior residence in
governing dominance relationships. Rainbow trout were socially dominant as fry in riffles, and after the fry stage brown trout were socially dominant in all microhabitats tested. Social conflict between fry and fingerlings was minimized by size dependent aggression, aggression being highest between fish of similar size.
Study of comparative abundance, migration and population dynamics of 0+ brown and rainbow trout in Scotts Creek provided
underyearlings in the stream and its role in regulating populations of the two species in Lake Alexandrina. The juvenile salmonid populations in Scotts Creek were dominated by late emerging 0+ rainbow trout despite a much greater tendency shown by brown trout to remain in the stream following emergence. Rainbow trout juvenile output from Scotts Creek was heavily dependent on recently emerged fry whereas that of brown trout was dependent more on fish which had undergone a period of stream residence. Competition between juvenile brown and rainbow trout was discussed in relation to the migratory strategies employed by each species with respect to lotic versus lentic rearing.
Competition between brown and rainbow trout was discussed in the context of competition and niche theories. Hutchinson's multidimensional hypervolume concept of the niche was shown to be inadequate for species such as freshwater fish which have multistage lifecycles. A modification to Hutchinson's model is proposed which takes into account the entire
lifetime of a species with population regulatory mechanisms, including competition, potentially acting at various stages of the lifecycle.
GENERAL INTRODUCTION
Competition has received considerable attention from ecologists in the past twenty-five years, the renewed interest arising from studies of the "ecological niche" and "competitive exclusion" in the first half of this century (Diamond 1978). Grinnell (1904,1908) was the first naturalist to express an appreciation of the concepts of the niche and competitive exclusion. However, sustained interest in competition did not develop until Lotka (1925) and Volterra (1926) had developed mathematical equations to model competition and Gause (1934) had demonstrated
competitive exclusion in simple laboratory populations of ciliates. These and subsequent studies by laboratory ecologists (e.g., Crombie 1946, Park 1948) and by field ecologists (e.g., Lack 1945,1947, Elton 1946) led to the formulation of the concepts of the niche (see Hutchinson 1957) and competitive exclusion which together provide the basis for modern niche and competition theory. In broad terms the niche consists of the
resources a species uses, where it finds them and the strategy by which it harvests them (Diamond 1978). Competition occurs when a number of animals (of the same or different species) utilize common resources the supply of which is short; or, if the resources are not in short supply, competition occurs when the animals seeking that resource nevertheless harm one another in the process (Birch 1957). Competition can be by
exploitation or by interference. In exploitative competition, individuals by using resources, deprive others of the benefits to be gained by those resources. Interference competition is more direct and occurs when
competing species and in extreme cases competitive exclusion of a species may occur. The competitive exclusion principle (Hardin 1960) (or Gause's
principle) states that species must "occupy different niches" to coexist, because otherwise one species will competitively exclude the other.
Much of the evidence for competition presented in the past has been inferential rather than direct and this has resulted in a
questioning of the importance of competition in community ecology by some authors (e.g. Connor and Simberloff 1979, and see review by Schoener 1982). Until recently, field experiments demonstrating interspecific competition have been rare (e.g., see review by Connell 1975). However the past five years has seen a rapid growth in such experiments, many of which have presented direct evidence for interspecific competition (see reviews by Schoener 1983 and Connell 1983). Schoener (1983, pg. 273) concludes that; " ••• interspecific competition has now been established experimentally in a great variety of natural systems and among a great variety of organismsl1
• However, examination of the reviews by both
Connell and Schoener reveals that the evidence for competition in freshwater systems is sparse, and particularly for freshwater fish.
Competition between freshwater fish must be considered in the context of their multistage lifecyc1es since often a different set of resources is utilized, and the potential for interspecific competition is likely to b~ different, at each stage. Although competition may be
/
potent~l;'y
important at any stage, its realization can be dependent uponP~~~tion regulatory forces acting on the populations at an earlier /stage. For example, adverse predation and physical conditions can reduce
/
determine the realization of competition at some later stage.
Situations in which interspecific competition might be expected to be most severe and most apparent, and therefore able to be
demonstrated, arise when closely related but geographically isolated species are brought into unnatural sympatry by man. Such species may have considerable niche similarity but might not necessarily have mechanisms to alleviate interspecific competition with each other as they might with competitors in their native ranges. Two such species are brown trout (Salmo trutta Linnaeus) and rainbow trout (Salmo gairdneri
Richardson) in New Zealand, where they occur in many lakes and rivers in unnatural sympatry. Brown trout (originally of English stock) and rainbow trout (apparently "steelhead" i.e., anadromous rainbow trout) were
introduced into New Zealand in the late 1800s, from Tasmania and
California respectively (MacCrimmon and Marshall 1968, MacCrimmon 1971, Scott and Fraser 1978). Depending on the system, either species can
dominate in New Zealand waters. A review of the distribution of these two species in New Zealand, by Allen and Cunningham (1957), indicated that factors determining dominance are varied and complex, possibly involving climate, geology and ecology. As they are ecologically very similar, sympatric populations of brown and rainbow trout may experience severe interspecific competition, which in some systems may determine the balance between the species.
Freshwater fish may compete for food, space or spawning sites. Although competition for spawning sites will probably occur much less frequently than competition for food (or food-related space), its effects are liable to be conSiderably more damaging to a population (Larkin
1956).
competition may be obtained. The results of an extensive survey of the efficiency of natural propagation of trout in New Zealand waters by Hobbs
(1948) indicated that a number of trout populations in New Zealand were limited by redd superimposition. Redd superimposition is a type of interference competition for spawning site and occurs when a female in digging a redd in which to deposit her own eggs in the gravel of a stream bed disturbs or dislodges eggs deposited previously by other fish. In New Zealand. rainbow trout generally spawn later than brown trout. Thus, in waters where these two species occur in sympatry, and where suitable spawning areas are limited and spawner densities are high, dominance by rainbow trout might be favoured by interspecific competition for spawning space, mediated through redd superimposition. This situation is most likely to ciccur, and be detected, in physically stable waters.
A mixed population of brown and rainbow trout dominated by the latter species occurs in Lake Alexandrina, a high country lake in the South Island of New Zealand, The spawning areas in this system are
limited and are utilized by large numbers of trout. Therefore
interspecific competition for spawning space, mediated through redd
superimposition, was investigated in the major spawning tributary of Lake Alexandrina, Scotts Creek, as a possible factor causing the dominance of rainbow trout in this system. Scotts Creek fulfilled all the
prerequisites considered necessary for interspecific competition for spawning space to occur and be detected i.e., it had a limited physically stable spawning ground which was utilized by both brown and rainbow
trout. with rainbows spawning later and in high densities. In addition, its small size and ease of access made such an investigation feasible.
favour. This competition was considered in relation to its possible
importance in influencing dominance relationships between the populations of brown and rainbow trout in Lake Alexandrina. This investigation
required consideration of the effects of larger size and prior residence of brown trout, acquired through early emergence, on interactions between the species.
A period of residence in spawning tributaries of some lakes can be advantageous for survival of underyearlings (see review by Northcote 1978). Thus the competitive ability of a species at the underyearling stage in the spawning tributary may be crucial in determining its
population dominance status. For example, in Lake Eucumbene (Australia) a decline in the rainbow trout population was attributed mainly to
competition from juvenile brown trout (Tilzey 1972). Rainbow trout were forced out of the spawning streams by earlier emerging brown fry and exposed to heavy predation from adult brown trout at the lotic:lentic interface. Apparently juvenile brown trout are capable of excluding juvenile rainbow trout from the small stream environment. However, evidence of competitive exclusion in nature is rare (Wangersky 1978). rather, coexistence of competitors appears to be the rule and competitive exclusion the exception. Studies on naturally sympatric juvenile stream dwelling salmonids (e.g., Hartman 1965 on steelhead trout and coho
salmon, and Glova 1978 on cutthroat trout and coho salmon) indicate that their coexistence may depend primarily on differences in their
behavioural ecology which result in competing populations partitioning resources (principally spatially) in streams. The small stream
environment provides three major types of flowing water habitat: riffles, pools and glides (runs) or intermediate channels (Mundie 1974), in which resources may be partitioned horizontally between habitat types or
Larkin (1956) hypothesized that this characteristic is an adaptation to the instability of freshwater environments and is possessed by freshwater fish in general. Consequently freshwater fish are able to utilize a wide variety of food and habitat types. Sympatric populations may exhibit much niche overlap, particularly if resources are plentiful, but when
competition becomes more intense a greater degree of niche separation may occur. Niche separation occurs as each population confines its range of resource utilization to those resources to which it is best adapted to utilize or compete for (Nilsson 1956).
Therefore potential competitive interactions between
underyearling brown and rainbow trout in the stream environment were investigated in relation to habitat. utilization. The importance (or degree of realization) of potential competition between underyearling brown and rainbow trout in Scotts Creek was evaluated by studying their population dynamics and comparative species abundance and was considered in relation to the outcome of competition for spawning space on these components.
Connell (1975) described three general methods used to detect or measure biological interactions (such as competition or predation) under natural conditions: 1/ observations of patterns existing in nature with assessment of their apparent fit to theoretical models, 2/ searching for the "natural experiment" e.g., comparing the niche of a species between locations where a competitor is present and absent (this experimental approach suffers from lack of an adequate control), and 3/ the controlled field experiment, which Connell regards as the preferred approach. In the present study, a combination of field observations and a controlled
CHAPTER II
STUDY AREA
2. 1 INTRODUCTION
Field work was carried out at Lake Alexandrina, located in the Mackenzie Basin of the South Island of New Zealand (Fig. 2.1). The study of competitive interactions between, and juvenile population dynamics of, brown and rainbow trout was carried out in Scotts Creek, the major
tributary of Lake Alexandrina.
2.2 LOCATION AND CATCHMENT OF LAKE ALEXANDRINA
Lake Alexandrina is situated 1.6 kilometres southwest of Lake Tekapo in the upper catchment of the Waitaki River (latitude 43°56'
°
South, longitude 170 27' East) at an altitude of 716 m.a.s.l •• It is set in glacial till, which has a slightly subdued morainic topography, and outwash gravel (Gair 1967). More detailed information on the
geomorphology of the area is given by Mansergh (1973) and Laird and Lewis (1976). The lake is 7.2 kilometres long and has a mean depth of 13.6 metres and a maximum depth of 27 metres (Irwin 1978). It has a shoreline of 16.8 kilometres and covers an area of 658 hectares (Moore et al. 1962).
along the eastern shore into Lake McGregor which in turn drains into Lake Tekapo.
Tussock grasslands (in which Festuca novaezealandiae is dominant), introduced pastoral grasses and weedmats of Hieracium pilosella and ~ prealtum clothe most of the catchment. Much of the drier shoreline is dominated by willow (Salix sp.), matagouri (Discaria toumatou) and sweet briar (Rosa rubiginosa) and
the marsh areas by raupo (Typha oriental is), and sedges (Carex spp.).
2.3 CLIMATE
The climate in the Upper Waitaki Basin is governed by prevailing wind systems. Characteristically, northwesterlies (fohn type winds)
succeed anticyclones as they lose intensity and are terminated with cold front passages (O'Connor 1975). Annual precipitation in the area is about 900mm. Seasonal variation in rainfall is small, ranging from a mean of 148mm in both winter and summer to 154mm in autumn. Snow falls
occasionally around Lake Alexandrina in most winters but seldom persists on the ground for any length of time. The Lake Alexandrina locality
experiences cold winters and warm summers. Extreme mean daily maximum and minimum air temperatures recorded in the area during the period 1927 to
o 0
1974 were -9 C and 28 C, and the mean annual air temperature for the same
o
'0
,'"
Sunday,.f.!f Tarn '\II'r
45·S ~ Terrace ~ RIverbed
... ~::flt ~ Swamp
- .... Intermithmf - Road
stream
LAKE TEKAPO
[image:22.566.72.492.104.657.2]SCALE
2.4 SCOTTS CREEK
Scotts Creek emerges from a small swamp approximately 1.5
kilometres north of Lake Alexandrina and meanders for most of its length through improved pasture and modified tussock grasslands and wetlands (Fig. 2.2). It is confined by well defined banks which are high in places and frequently overhanging. Tussock and introduced grasses provide good riparian cover for most of the stream's length. During the summer. watercress (Nasturtium sp.) grows profusely in the upper region of the stream above the grill (Fig. 2.2). The stream has a total length of
Swamp
E
A - E • limits of different stream sections
s. sampling sections
... ..c most fretpJenti y used spawning areas
Figure 2.2 Map of Scotts Creek showing the trap site. the electrofishing sampling sections and the most frequently used spawning
[image:23.563.87.494.302.669.2]2.4 kilometres. a mean gradient of 13mkm-1 and a mean discharge of approximately 0.125m3s-1• It has a fairly stable flow and is not
subject to flooding. Peak discharges are insufficient to cause scouring of bed materials coarser than sand. The stream follows a predominantly riffle:run sequence interspersed by a few pools, and flows over a bed composed of varying amounts of mud, sand and rounded gravels and stones.
Mean water temperatures recorded during the study period ranged from about
1fc
during summer to ~C during winter (Fig. 2.3). Maximumo
summer water temperatures rarely exceeded 18 C and minimum winter
o
temperatures rarely fell below 5 C.
18
M
14
12
)1
~
I
\1~ 10
jj
j
!lljl
!
j
1I1I1-
roI
~
~ 8
E
I
I
~ ~
6
4
2
0
M J A S 0 N 0 F M A M J J A S 0 N o J F M
1980 W~ 1982
Figure 2.3 Mean weekly water temperature and range in Scotts Creek from May 1980 to March 1982.
[image:24.563.59.510.312.615.2]grill which is usually dropped into position at the start of each
spawning season. The better spawning areas, as indicated by the apparent quality of the spawning substrate and frequency of use by spawners, occur within the stretches of stream bounded by arrows in Figure 2.2. Much of the gravel used by spawners has been depOSited in the stream by members of the South Canterbury Acclimatization Society in an endeavour to improve spawning conditions.
The underyearling salmonid populations in five sections of the stream (Sections 1,2,3a,3b and 4) were studied over varying periods between 1979 and 1982. These sections were chosen, on the basis of
general morphometry and flow characteristics, as being representative of different stretches of the stream. Sections 1 and 2 were considered to represent the stretch between points A and B shown in Figure 2.2 and
sections 3a,3b and 4 to represent the stretches between points Band C, C and 0, and D and E respectively. Physical characteristics of the stream, including depth, water veloCity, flow characteristics, amount of bank overhang and composition of the stream bed were measured in each section (Table 2.1). These characteristics were determined from parallel
SEcn
1 2 3a 3b 4
Length (m) 50 61 58 51 50
Mean width (m) 2.18 + 0.12 2.28 + 0.21 2.88 + 0.24 1.98 + 0.14 2.90 + 0.25 Area (m2
) 109 + 6 139 + 13 167 + 14 101 + 7 145 + 13
Mean depth (cm) 30.9 + 2.39 26.7 -+ 3.44 26.2 + 2.69 34.9 + 2.25 31.1 -+ 2.12 Mean midstream water velocity (m.s-1
) 0.46 + 0.029 0.51 + 0.048 0.46 + 0.033 0.18 + 0.024
- -
-Flow characteristics - slow
(%)
65 38 63 89 . 100" II - turbulent
(%)
35 62 37 11a
Bank overhanging >10 cm
(%)
15 28 3*" II )120 cm
(%)
4 38 97* 1100 (96*) 100*Stream bed covering
(%)
13 3 37 27 94
sand 40 20 32 2
assorted gravels and stones/
<2.5 cm particle diameter 3
a
6a
a
<5.0 cm
"
II3 8 22 18
a
<7.5 cm II II
11 51 3 28 6
<10.0 cm II II 19 15
a
25a
10 cm < rocks < 12.5 cm diameter 6 2
a
0.5a
rocks> 12.5 cm II 5
1 0.1
a
a
CHAPTER III
GENERAL SAMPLING PROGRAMME AND METHODS
3. 1 ADULT UPSTREAM MIGRANTS
Information on size and timing of the spawning runs of brown and rainbow trout in Scotts Creek was obtained from daily totals of upstream migrants caught in a fish trap at the stream mouth. The trap was of conventional design, consisting of two fences in a V configuration
leading fish upstream into a holding pen. Initially, it was made entirely of wire netting supported by steel standards (Plate 3.1), but later was modified to minimize debris accumulation by substituting vertical wooden slats for wire netting in the holding pen.
The trap was operated continuously from 5 May 1980 until 15 October 1980, except for a three day period in late August when it was sealed and adult fish were denied access to the stream. In the following season, the trap was operated continuously from 9 April 1981 until 18 June 1981. Then it was operated for periods of one week at approximately monthly intervals until October, with the aim of establishing the
approximate timing of that seasons rainbow trout spawning run.
The trap was attended at least once daily and records were taken of the species, sex, length (cm) and weight (kg) of each fish caught. Fish were then released and allowed to continue upstream. At regular intervals spent fish returning downstream were herded with hand held wire netting screens, penn€d and manhandled over the trap to allow their
Plate 3.1 Adult fish trap and fry trap in position near the mouth of Scotts Creek.
3.2 OUTMIGRANT UNDERYEARLINGS
Fence traps of the design used by Armstrong and Argue (1977) were used to trap juvenile downstream migrants. Traps were plywood and stainless steel screen installations built across the stream. Downstream migrants were directed by the screens into a sluice trough which emptied
into a plywood live box (Plate 3.1). When in operation, the traps were cleared at least twice daily depending on debris accumulation.
Outmigrant underyearlings (progeny of 1980 spawners) were
Daily totals of outmigrants usually were obtained from direct counts, but when large numbers of emergent fry (i.e., more than
approximately 3000 fry per night) were caught, totals were estimated by volume subsampling.
Monthly mean lengths (mm) of outmigrant fry were estimated from pooled weekly samples.
3.3 RESIDENT UNDERYEARLINGS
Population and growth rate estimates of underyearlings in the stream were made once a month from November to April inclusive for three consecutive years (1979-1980 to 1981-1982). In 1981 an additional
estimate was made in June. Population estimates for the stream were calculated by extrapolating population estimates made for the
representative stream sections (described in Section 2.4) regularly
sampled each summer, to the total area of the stream. Not all of the five stream sections were sampled each year. Sections 1,2,3a and 4 were
sampled regularly during the summer of 1979-1980, whereas Sections 1,2 and 3b were sampled during the following two summers. Total length of the stream sampled each year (i.e., 219 metres in 1979-1980 and 162 metres in 1980-1981 and 1981-1982) was greater than one tenth the length of the spawning ground.
Estimates of populations within sections were made by the removal method (Zippin 1958). Each section was isolated with stainless steel mesh screens abutted against permanent bedlogs at either end of the section. The section was then electrofished at least three times in an
sampling was completed. When decreasing catches were not achieved between successive runs, the pooled total was used as an approximate minimum estimate of the population size. When decreasing catches were achieved in only the latter runs, numbers in previous runs were added to a population estimate calculated by the removal equation (in Zippin 1958) for the number of fish remaining.
All fish captured were anaesthetized with benzocaine (0.003%) and species and fork length (mm) were recorded for each fish. Scale samples (for age determination) were taken from fish suspected of exceeding the length range of age 0+ fish. When completely recovered fish were returned to the section sampled.
Species biomass was computed from the mean measured fork length converted to mean weight,by linear regression. The equation for each species was derived from lengths and weights (gm) of freshly killed fish from samples taken, in the 1979-1980 summer (rainbows), and in the
1979-1980 and 1981-1982 sampling periods (browns).
3.4 ESTIMATION OF ERROR
When the mean of a population parameter was calculated by converting between functionally related variables using the linear equation:
Y
=
a +bX
a measure of the reliability of the estimated parameter was obtained by combining the variance due to regression with the variance due to
estimating X in the equation:
~ A var
X
_ 2 A2 var ~var Y = var b ( --- + X ) + b + var a - 2X covar(b,a)
A A A A
4. 1
CHAPTER IV
EFFECT
of
INTERFERENCE COMPETITION FOR SPAWNING SPACE ONSPAWNING SUCCESS
I NTRODUCTI ON
In some New Zealand freshwater systems in which brown and rainbow trout occur in sympatry and in which rainbow trout are numerically dominant, dominance by rainbows might be favoured by interspecific interference competition for spawning space, mediated through redd superimposition. Later spawning by rainbow trout gives them the potential to limit brown trout populations by dislodging and
destroying their eggs through redd superimposition.
Hobbs (1940) concluded that trout stocks in New Zealand had developed to the point where a considerable portion of redds were
superimposed and that redd superimposition had the potential to regulate the density of natural populations.
Although losses due to redd superimposition have been reported for a number of salmonids. very little quantitative work has been
published to indicate the magnitude of such losses. The first and most detailed work of this kind was by McNeil (1962) on pink and chum salmon spawning in three coastal Alaskan streams. He gave evidence for a direct relationship between egg loss and density of females spawning: that egg displacement increases as the density of spawning females increases, ultimately reaching a point at which females displace from the spawning bed a number of eggs equal to the number they deposit. His model has gained wide acceptance among Pacific salmon researchers because it explains the inverse relationship between spawner density and spawning efficiency that is frequently observed.
This chapter investigates the hypothesis that superimposition of brown trout redds by rainbow trout severely limits the spawning success (defined as the proportion of eggs deposited surviving to emergence) of brown trout spawning in Scotts Creek, and is a major factor causing dominance of rainbow trout over brown trout in Lake Alexandrina.
4.2 SPAWNING MIGRATIONS
The spawning runs of both brown and rainbow trout into Scotts Creek began in early April and continued for brown trout until July, and for rainbow trout until the middle of October (Figs. 4.1 and 4.2). The adult fish trap was installed on 9 May 1980. by which time 91 rainbow trout (59 males and 32 females) and 22 brown trout (9 males and 13 females) were present already in the stream. Previous observations that season on numbers of spawners and redds indicated that few fish would have spawned and returned to the lake before the trap was installed. In 1980 2932 spawners were trapped entering the stream in; species and sex composition of these fish are given in Table 4.1. Fifteen percent of brown trout were blind, and these were destroyed since they were incapable of spawning.
I
Table 4.1 Species, numbers and sex composition of upstream migrants passing through the adult fish trap in 1980.
, ,
j Sex ratio Speci es Percent of
No. females:males Totals total migrants
Ra i nbow trout males 997 1.869 2860 97.5
females 1863
Brown trout males 20 2.100 62 2.1
females 42
Quinnat salmon males 3
2.333 10 0.3
females 7
[image:34.564.79.511.454.730.2]100
90 Males
I I
80 I
Females I I
I
70 I
VI I
.... I
c: I
I
11)
60 ,
'- I
Ol I
'15 ,
50 Rainbow trout ' I
E
I'Q <II
40
'-.... VI
Cl. 30 ::I .... 0 20 ci z 10 0
10 Brown trout
20
April May June July Aug Sept Oct
Figure 4.1 Daily number of upstream migrant brown and rainbow trout in 1980. (Number in creek by 10 May; rainbow females (32), males (59), brown females (13), males (9)).
100
90 Males
80 Females
VI 70
....
c:I'Q
60
'-Ol '15
E 50 Rainbow trout
I'Q OJ 40
'-....
VICl. 30 ::I
-
0 20 d z 10 0 10 20April May
Brown trout June July
I I I ~
::
,II 01'.,'
,,'.,'
I,' ", ,,' " , ,, I
.
,Aug ,
,
'I ,
, , , , , • ,
.
" I
Sept Oct
[image:35.563.53.507.83.778.2] [image:35.563.103.499.83.321.2]Over the period of the 1981 spawning season when the trap was operated continuously (i.e., from 9 April to 18 June) 512 rainbow trout, 116 brown trout and 34 quinnat salmon entered the stream to spawn. This was 1.6 times, 1.9 times and 3.4 times more respectively than was
recorded over the same period the previous season. However, the form of the rainbow trout run was similar in the two seasons, i.e. there was a pronounced peak late in each season (Figs. 4.1 and 4.2).
In all three species females outnumbered males. Towards the latter half of the rainbow trout run the sex ratio progressively favoured females (Figs. 4.1 and 4.2), whereas very early in the season it favoured males. Female brown trout and salmon occasionally were seen digging redds unaccompanied by males; this may be a consequence of the grossly uneven sex ratios (Table 4.1).0~ six occasions, possible evidence for mixed spawning between brown and rainbow trout was observed. On four such occasions female brown trout were paired with male rainbow trout, and on two occasions the reverse was seen. Interspecific aggressive interactions between male trout were observed frequently.
Mean lengths and weights of spawners were similar between the two species of trout and between years (Table 4.2). Length distributions of 1980 spawners are shown in Figure 4.3.
Table 4.2 Mean lengths and weights of 19BO and 1981 spawners.
- S.E. !
n x
19BO 19B1 1980 1981 1980 19B1
i
..-... Brown trout males 20 33 55.0 57.4
1.:~
E
u
females 42 Bl 55.0 57.B 0.81 0.54
...
:r:
l
-e!)
Rainbow trout males 995 448 56.0 55.7 0.69 0.25
:z: l.J.J
....J
females 1843 687
1
56.0 56.5 0.57 0.16Brown trout males 7 33
i
2.41 2.63 0.144 1.435..-...
females 22 Bl 2.82 3.02 0.161 0.079
01
:,.,::
...
I
-Rainbow trout males 934 238 2.29 2.12 0.018 0.033
::c e!)
...
females 1818 274 2.47 2.47 0.012 0.026
14
Brown females 12
10 [= 55cm
8 n=43
6
4
2
0
QJ
10
0'1
Rainbow females
ro 4 -c:
8 [= 56em
QJ
u
t..
QJ
6
0.... n=1843
4
2
0
10
Rainbow males
8 [= 56em
6 n=995
4
2
0
30 40 50 60 70 80
Length (em)
[image:38.563.117.472.101.657.2]4.3 SIZE OF THE SPAWNING BED
4.3.1 METHODS
The extent of utilized spawning gravel was divided visually into three categories based on composition of the surface gravel: A - coarse, B - intermediate and C - fine, following Shirazi and Seim (1979). Extent of spawning substrate was described in terms of length rather than area because the stream was too narrow for more than one discrete redd to occur across its width. One to three 10cm-diameter core samples were taken, to a depth of 25cm, from redd sites representative of each
category. Each sample was sieved through a geometric progression of sieve sizes from 64mm to O.063mm. Gravel composition was described by geometric mean particle diameter. Shirazi and Seim (1979) proposed geometric mean particle diameter as the appropriate statistic for characterizing quality of spawning gravel. It is a convenient standard measure which enables comparison of sediment results between studies. It relates to
permeability and porosity of sediments and to embryo survival (see Appendix Fig. 3.1) at least as well as percent fines (an ambiguous
statistic commonly used in the past), and it is a complete description of total sediment particle composition (Shirazi and Seim 1979).
Geometric mean particle diameter was calculated by the quantile graphical method (Shirazi and Seim 1979) and ;s given by:
percentiles of the cumulative distribution of particle diameter. Spatial spawning capacity is described more realistically in terms of individual redd sites available to spawners than in terms of area or length of spawning ground. Number of available redd sites of each grade of substrate was therefore recorded about the time of peak spawner densities when spawning capacity would be approached or exceeded. Redd sites characteristically were mounds of gravel (greater than one square metre) with a mean spacing when contiguous of approximately three metres. This spacing presumably approximates the minimum spacing requirements of females spawning concurrently. Number of redd sites available is
equivalent to the maximum number of redds which can be constructed simultaneously.
4.3.2 RESULTS
One and a half kilometres of Scotts Creek is available to spawning fish (i.e., from the mouth to the grill) and of this length approximately 940m is utilized by fish for spawning. Utilized gravel varied greatly in particle composition but broadly could be divided into the three categories (Table 4.3). Full substrate composition and
cumulative distribution of particle diameter is given in (Appendices 2.1 and 3.2).
during peak spawning were occupied continuously.
Table 4.3 Geometric mean particle diameter (mm) and variance for samples from substrate categories A, Band C.
~
Substrate category
A ! B
L:
i
1 1 I 2 3 2
dg 23.8 5.4 11.5 20.0
I
5.5 6.9I
I
2.35 1
4.64 4.08
I
2.01 2.50og 3.50 I
I
I
Table 4.4 Composition of the spaw.ning bed and number of redd sites.
I
Substrate category
A
I
B C Total1 ength (m) 68.5 480.5
I
391 940number of redd 24
166 147 337
sites
characteristics in order of preference appeared to be bed configuration, substrate particle size, consolidation of the substrate and water
velocity.
4.4
FREQUENCY OF REDO SUPERIMPOSITION
4.4.1
METHODS
The frequency with which redds were superimposed during the 1980 spawning season was estimated from maps of successive redds recorded on eight redd sites. Six sites, chosen early in the season, were in
locations where a redd had been dug recently on previously undisturbed gravel, and were positioned at fairly regular intervals over the length of the stream. The remaining two sites were chosen later in the season near two of the original sites at which observations had been
discontinued. At each site, four aluminium poles were arranged in a rectangle enclosing the initial redd and driven into the banks. Lengths of cord, graduated at 10cm intervals, were suspended between the poles along each bank, and to these a length of nylon monofilament was attached and suspended across the stream. Using the monofilament as a cursor, the distance from the perimeter of the redd to the nearest length of string (i.e., to the nearest side of the rectangle) was measured at 10cm
graphically show the frequency, sequence and completeness of the redd superimposition. The area of each redd superimposed once, twice, three times etc. was calculated and expressed as a percentage of the total area.
4.4.2 RESULTS
Frequency of redd superimposition was high throughout the season. At one site eight redds were constructed during one incubation period (Fig. 4.4). A record of redds dug on each site and the proportion of each redd superimposed is given in Appendix 2.2. Of 46 redds observed for more than one month, 89% were superimposed. The mean proportion of redd area superimposed was approximately 65%, and mean frequency at which redds were superimposed was once every 19 (± 4) days.
Digging activity on some sites was so intense that it resulted in displacement of most of the gravel downstream leaving underlying
boulders exposed, and rendering the site unusable. Observations made over three spawning seasons indicate that such intense digging activity was common and caused continual changes in stream bed topography.
General observations showed that once a redd had been dug on a site there appeared to be a greater likelihood of re-digging in that
location i.e., redds appeared to be contagiously distributed. This was particularly obvious late in the season when previously unused sites were heavily utilized once an initial redd was dug. McNeil (1967) demonstrated that pink salmon redds were contagiously distributed in an experimental spawning channel.
VI
Q) L.
-I-Q)
E
4--c
Q)
LJ
300
1st measurement 16/5/80
- - - - 2 nd 7/6/80
3rd /I 17/6/80
250
200
...
'\
150 \
\
\
\
\ \ 100
50
...
...
"
...
"-...
-"
"
O+---~---~---~~---,---~~---+-L
o
50 100 150Centimetres
200 250 300
was no obvious trend in frequency of redd superimposition on any site. However, since site attractiveness continually changes through digging activity of fish altering the configuration of the stream bed, frequency of redd superimposition at anyone site need not necessarily exhibit a general trend.
Time of redd site occupation was variable, ranging from less than one day to four days, but the mode appeared to be about three days.
4.5 FECUNDITY
4.5.1 METHODS
Fecundity, defined here as the number of ripening eggs in a female prior to spawning, was determined for brown and rainbow trout from samples of 17 and 28 females respectively, collected from the fish trap during the 1980 and 1981 spawning seasons. Size range of fish in the samples adequately represented size range observed in the spawning runs. Fork length of each fish was recorded and the ovaries were preserved in Gilson1s fluid. Number of eggs in the ovaries was estimated later by volumetric sub-sampling. The relationship between egg number and length of female was then examined.
4.5.2 RESULTS
Egg number and fish length were significantly correlated in female brown trout (P < 0.01, r
=
0.851) (Fig. 4.5), but not in femaleregression:
LnF = 2.823 LnL - 2.790
For rainbow trout, fecundity was estimated by the mean number of eggs per female which was 5272 (± 416).
0 0 ~ x VI C1 C1 QJ ~ 0 ci z 10 8 7 6 5 4 3
40 50 60 70 60 90 100
Length (em)
Figure 4.5 Relationship between fecundity and length for brown trout.
10 9
6
0 7 0
~
x
VI 6
.
.
C1
...
C1
·
OJ ~. · . .
0 5 ciz
..
4
.
·
r=0.2293
40 50 60 70 80 90 100
Length (em)
[image:46.564.47.531.171.768.2]4.6 SPAWNING SUCCtSS
4.6.1 MORTALITY DUE TO REDD SUPERIMPOSITION
4.6.1.1 METHODS
An experiment designed to measure mortality of brown trout eggs and alevins due to redd superimposition by later spawning rainbow trout was carried out during the 1981 spawning season. On 26 April 1981 five female and four male brown trout from the spawning run were placed in each of two contiguous 50 metre sections (1 and 2) of Scotts Creek located immediately below the grill at the upper end of the spawning ground. Spawning substrate in both sections was composed entirely of B (intermediate) grade gravel. The fish were confined within each section (by grills placed at either end) until they had completed spawning. On 14 I~ay the spent fish were removed and the redds in the lower section
(Section 2) were exposed to superimposition by later spawning rainbow trout. The downstream grill on Section 2 was replaced with an adult fish trap which was operated continuously until 16 June. This ensured that only rainbow trout entered Section 2. During this period regular mapping of the brown trout redd sites was carried out to obtain a crude estimate of the severity of any redd superimposition taking place. The brown trout run was judged to be practically finished by 16 June so the trap was removed and fish were allowed unrestricted access to Section 2 to spawn. I allowed for an incubation period (i.e., the period from time of
fertilization to time of emergence) of approximately two and
judged to be complete. At this time the populations of brown fry remaining in each section were estimated by electrofishing using the removal method (Zippin 1958).
Spawning success of the two groups of female brown trout was compared. and mortality of eggs and alevins due to redd superimposition was calculated.
4.6.1.2 RESULTS
Female brown trout were of similar size in the two sections (Table 4.5); mean length of each group was approximately 56cm and mean weight 2.8kg.
Table 4.5 Lengths and weights of female brown trout spawning in the experimental sections.
Section 1 I Section 2
length (cm) weight (kg) I 1 ength (cm) weight (kg)
62.0 3.5 59.5 3.1
58.0 2.9 52.0 2.2
55.5 2.7 49.5 2.0
53.5 2.5 62.0 3.9
53.0 2.4 56.5 2.9
Mean 56.4 2.8 55.9 2.8
i
within eight days. Each female constructed a single redd. In both sections one redd was partially superimposed, but in each case I
considered loss of eggs would have been slight since the superimposition occurred at the downstream edge of the redd and therefore probably missed the egg pockets.
When rainbow trout were allowed entry into Section 2 the brown trout redds were severely superimposed. During the period from 14 May to 16 June, when records were taken regularly, 29 female and 16 male rainbow trout entered the section. By the end of this period a mean of 75% of the area of each brown trout redd had been superimposed (Table 4.6).
Table 4.6 Proportion of the area of each brown trout redd in Section 2 (constructed about 13 May) superimposed during the period 14 May to 16 June 1981.
I
Proportion of redd superimposed (% )
Redd site I Area (m2.) 1x \
2x f
3x
I
4x Totali
1 2.853 17 19 14 50
2 2.217 59 37 96
3 1.870 38 11 9 22 80
4 0.631 5 79 16 100
5 2.108 30 6 13 49
Mean 75
:
\ \
I
On 6 June I found about twenty strongly eyed eggs scattered on the stream bed immediately below a freshly superimposed brown trout redd in Section 2. Considering their fairly advanced stage of development. I think these were probably brown trout embryos.
Section 2 must have been fairly high since large congregations of adult rainbow trout (totalling over 50 fish) were observed in the section prior to installation of the fry traps. The original brown trout redds were unrecognizable since the stream bed topography had been altered
considerably by digging activity of the rainbow trout.
Total fecundity of each group of brown trout females (Table 4.7) was estimated by summation of individual fecundities calculated from the
length fecundity relationship (see pg. 34). To calculate potential egg deposition from total fecundity, I allowed for a 2.5% loss due to egg retention within females, non-fertilization, and non-lodgement of eggs in the substrate (Hobbs 1948).
Table 4.7 Spawning success of female brown trout in each of the experimental sections.
I
I
Section 1 Section 2
I
Total fecundity 27,246 + 10,499 26,796 + 10,392
(No. of eggs) - 7,577
-
7,486Potential No. of eggs 26,565 + 10,236 26,126 + 10,132
deposited - 7,388
-
7,299No. of free swimming 5911 358
fry
Spawning success 22.3 + 8.5% 1.4 + 0.5%
- 6.2% - 0.4%
i
500 400
<II 300 Section 1 Iii u VI O'l 200 .3
-..c. u ... ro u0.. 100
ro
"-...
>. 100
11111111
"-
'I.->. 80
'ro
-Cl ~ 60
ro u VI 40 u ... <II 20
III
11111111E ..c.
...
"- 0 .1
ro r
-20· Section 2
July I Aug Sept
Figure 4.7 Daily catches of brown trout fry caught in fry traps below each of the experimental sections (1 and 2) over the period 23 July to 2 September.