www.wjpr.net Vol 7, Issue 01, 2018. 1418
DEVELOPMENT AND VALIDATION OF A UV
SPECTROPHOTOMETRIC METHOD FOR SIMULTANEOUS
ESTIMATION OF NAPROXEN AND SUMATRIPTAN
1
*Vernekar Saumya and 2Dr. Theivendren Panneerselvam
1*
Asst Professor, Dept of Pharmaceutical Chemistry, PES’s Rajaram and Tarabai Bandekar,
College of Pharmacy, Ponda Goa India.
2
Professor, Karavali College of Pharmacy, Mangalore Karnataka India.
ABSTRACT
Naproxen is a non-steroidal anti-inflammatory drug (NSAID)
commonly used for reduction of moderate to severe pain, fever,
inflammation and stiffness. Sumatriptan is a 5HT agonist. Acting as an
agonist at these receptors, Sumatriptan reduces the vascular
inflammation associated with migraines. The objective of the present
work was to develop and validate a simple UV method for
simultaneous estimation of Naproxen and Sumatriptan in combined
dosage form.Q Absorption ratio method was used for calculation of
assay results. Methanol and Phosphate buffer pH 6.8 (50:50 v/v) was
used as a diluent. The developed method was validated according to
ICH guidelines and found to be specific, accurate, precise and robust.
Assay of the formulation was performed and the mean assay values were found to be within
acceptable limits. These methods can also be used to estimate NAP and SUM as independent
components. The developed methods are cost effective, time saving, simple and precise.
KEYWORDS: Naproxen, Sumatriptan, UV method, Q Absorption Ratio method.
1. INTRODUCTION
Naproxen is used for reduction of pain, fever, inflammation and stiffness caused by migraine,
osteoarthritis, kidney stones, gout, and menstrual cramps. It works by inhibiting COX-1 and
COX-2 enzymes.[1, 2] They work by reducing the levels of prostaglandins, chemicals that are
responsible for pain, fever, and inflammation.[3,4,5] Sumatriptan is a synthetic drug belonging
Volume 7, Issue 01, 1418-1427. Research Article ISSN 2277–7105
Article Received on 22 Nov. 2017,
Revised on 12 Dec. 2017, Accepted on 01 Jan. 2018
DOI: 10.20959/wjpr20181-10586
*Corresponding Author Vernekar Saumya
Asst Professor, Dept of
Pharmaceutical Chemistry, PES’s Rajaram and Tarabai
Bandekar, College of
www.wjpr.net Vol 7, Issue 01, 2018. 1419
to the triptan class, used for the treatment of migraine headaches.[6,7,8] It is structurally similar
to serotonin (5HT), and is a 5-HT agonist.[9,10] Sumatriptan reduces the vascular inflammation
associated with migraines. Hardly few techniques are available for this combination which
could be used for determination over a wide linear range.[11] Main objective is to develop and
validate[12] UV – Visible method using Absorption Q Ratio method which is accurate and
economical.
O
ONa
O
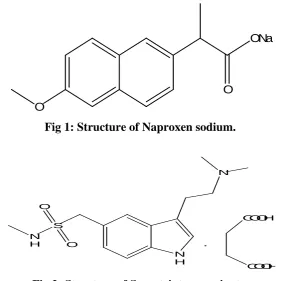
Fig 1: Structure of Naproxen sodium.
N H
N
S N
H O
O
COOH
COOH
[image:2.595.157.441.210.491.2].
Fig 2: Structure of Sumatriptan succinate.
2. MATERIALS AND METHOD
UV/Visible spectrophotometer (Shimadzu Model UV 1800) was employed with spectral
bandwidth of 1nm and wavelength accuracy of 0.3 nm (with automatic wavelength correction
with a pair of 1 cm matched quartz cells). Mettler M80 analytical balance was used for
weighing of active and placebo. Analytical grade reagents and solvents were used for the
study; Naproxen and Sumatriptan were procured as free gift samples. Tablet dosage form
HEADSET was bought from local market 100% methanol (Rankem, HPLC grade) was used
as diluent 1. Buffer pH 6.8 was prepared by taking 6.8g of potassium dihydrogen phosphate
in 1000ml of milliQwater. pH adjusted to 6.8 with dilute sodium hydroxide solution. 50:50%
v/v of buffer pH 6.8 and methanol was used as diluent 2. This was mixed in equal ratio and
www.wjpr.net Vol 7, Issue 01, 2018. 1420 2.1. Preparation of standard solution
39.34mg of Naproxen and 7.15mg of Sumatriptan was weighed accurately and transferred
into a dry 100ml volumetric flask. To this 70ml of diluent 1 was added and it was sonicated
for about 10mins. Volume was made up to mark with diluent 1. This was centrifuged for
10mins at 5000rpm. 6.25ml of supernatant was transferred to a 25ml volumetric flask.
Volume was made up to mark with diluent 2 and mixed thoroughly. The final concentration is 98.36 and 17.86 μg/ml of Naproxen and Sumatriptan resp.
2.2. Preparation of placebo solution
994.962mg of placebo equivalent to one tablet was weighed and transferred to 100ml
volumetric flask. This was treated as same as that of standard solution.
2.3. Preparation of test sample
10 tablets are weighed and average weight was taken. These tablets were finely crushed in
mortar and pestle and this powder was used for analysis. Weigh tablet powder containing
40mg and 6.8mg of Naproxen and Sumatriptan equivalent to 400ppm and 68ppm above
drugs respectively and transfer to a 100ml volumetric flask. To this 70ml of diluent 1 was
added and it was sonicated for about 10mins. Volume was made up to mark with diluent 1
and this solution was centrifuged for about 10mins at 5000 rpm. 6.25ml of supernatant was
transferred in a 25ml flask and volume was made up with diluent 2. This was mixed well and
used for assay of the formulation.
3. METHOD VALIDATION
Method was validated for Linearity, Precision, Accuracy, Robustness, LOD and LOQ.
3.1. Instrument parameters: UV-Vis spectrophotometer
Measurement mode: Photometric.
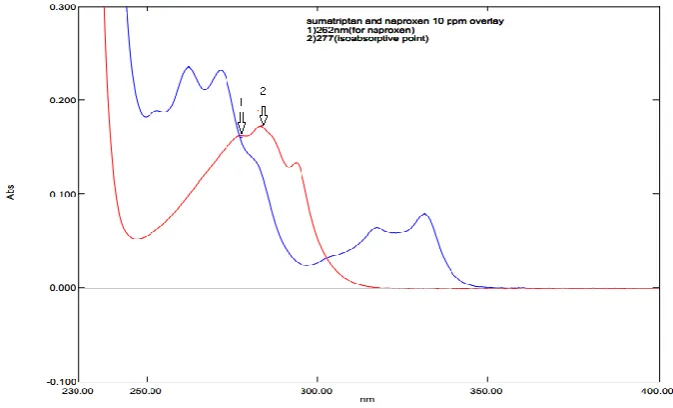
Wavelengths selected: 262nm (λmax of Naproxen) and 277nm (iso-absorptive point).
Scan speed: Medium.
Cuvettes: quartz cell with 1 cm pathlength.
Software used: UV probe.
3.2.Method for analysis
Blank solution is put in both the cuvettes, photometric mode is selected in the method file and
www.wjpr.net Vol 7, Issue 01, 2018. 1421
nm. Then autozero is selected and instrument ready for analysis. Read blank for correction.
Now put the standard solution in sample compartment and take absorbance’s at the required
wavelengths. Take 6 continuous readings to check for system suitability and RSD should not
be more than 2%. Same is done for placebo and test sample for assay. Each reading is taken
[image:4.595.128.465.194.398.2]in triplicate.
Fig 3: Overlain spectra of Naproxen and Sumatriptan.
4. RESULTS AND DISCUSSION
4.1.Assay
The % Assay found is between 97% to 103% for both Naproxen and Sumatriptan in bulk as
well as in dosage form. It passes the assay limit as per the compendial specifications.
If the main components are present in salt form then weight equivalent to pure drug should be
taken.
Table 1: Assay of Naproxen and Sumatriptan by proposed UV method.
Sr.no
Amount of drug present (μg/ml)
Amount of drug found
(μg/ml) % Assay
NAP SUM NAP SUM NAP SUM
Test 1 100.53 17.10 98.75 16.89 98.23 98.77
Test 2 100.45 17.08 98.64 16.93 98.20 99.12
Test 3 100.63 17.10 98.69 16.83 98.10 98.42
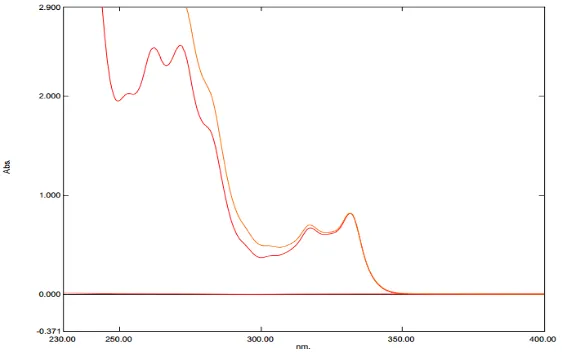
4.2. Specificity
Placebo doesn’t interfere at the absorbing wavelengths. Placebo equivalent to 1 tablet is taken
www.wjpr.net Vol 7, Issue 01, 2018. 1422
Also force degradation studies are done by treating in stress conditions and observing the
effect. The drugs are not affected by acid, alkali and water. However it undergoes excessive
oxidation with hydrogen peroxide due to presence of many oxidizable groups in both the
[image:5.595.160.440.173.339.2]drugs.
Fig 4: Placebo interference for Specificity studies.
Fig 5: Forced degradation studies with hydrogen peroxide.
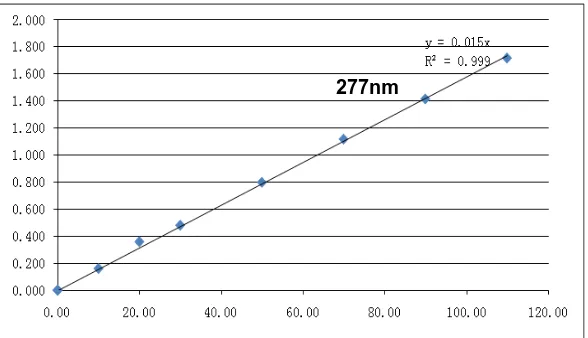
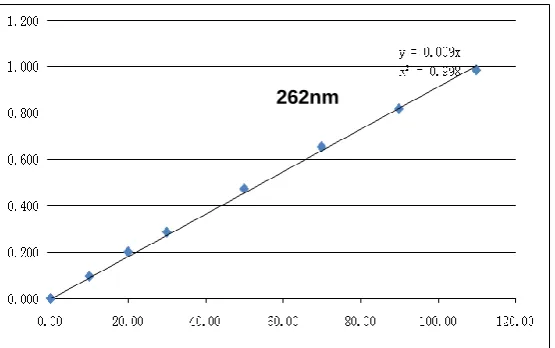
4.3. Linearity
Naproxen is found linear in range of 10 to 110 μg/ml. Sumatriptan is found linear in range of 10 to 110 μg/ml. Correlation coefficient is more then 0.999. The linearity was done for
[image:5.595.157.438.388.564.2]www.wjpr.net Vol 7, Issue 01, 2018. 1423 Fig 6: Linearity curve of Naproxen at 277nm.
Fig 7: Linearity curve of Naproxen at 262nm.
Fig 8: Linearity curve of Sumatriptan at 277nm.
277nm
262nm
[image:6.595.149.443.540.709.2]www.wjpr.net Vol 7, Issue 01, 2018. 1424 Fig 9: Linearity curve of Sumatriptan at 262nm.
4.4. Accuracy
Accuracy studies were done by doing recovery studies under presence of placebo. Recovery
was done at low, medium and high level ie. 50%, 100% and 150%. Recoveries are found in
the limit and thus the range is from 97% to 99% for Naproxen. For Sumatriptan it’s from
98% to 100%.
Table 2: Data for Accuracy studies by Recovery.
Ac
cu
rac
y
leve
l (%)
Amount of API added (μg/ml)
Amount of API
recovered (μg/ml) % Recovery % RSD
NAP SUM NAP SUM NAP SUM NAP SUM
50 50.06 8.31 48.83 8.22 97.8 98.9 0.46 1.4 100 99.05 17.13 97.6 16.45 98.5 97.3 0.20 1.5 150 150.60 25.4 146.48 24.68 97.8 97.2 0.27 1.4
4.5. Precision
It is carried out by doing repeatability study which showed RSD below 2% indicating that the
method is precise. Also intermediate precision is done and found suitable.
Solution stability is carried out to see the effect of storage on the sample. Solution is found
stable upto 48 hours and after that the degradation is NMT 6% as that compared to control.
www.wjpr.net Vol 7, Issue 01, 2018. 1425 Table 3: Data for Precision studies.
Precision studies Acceptance criteria Observation
Solution stablility %RSD NMT 2% Stable upto 48hrs at room temperature
Repeatability Individual assay 97-103% %RSD NMT 2%
Average Assay results 97-99% %RSD 0.2%
Intermediate precision
Intra Day study Individual assay 97-103% %RSD NMT 2%
Average Assay results 97-100% %RSD 0.8%
Inter Analyst study Individual assay 97-103% %RSD NMT 2%
Average Assay results 97-100% %RSD 0.1%
4.6. LOD (Limit of Detection)
It’s done according to the readings taken from calibration curve and it’s a not that much
required criteria for assay method. Values found from calibration curve are as follows.
Naproxen (262nm): 3.01, Naproxen (277nm): 1.83, Sumatriptan (262nm): 3.84, Sumatriptan
(277nm): 3.41.
4.7.LOQ (Limit of Quantitation)
Values found from calibration curve are as follows.
Naproxen (262nm): 9.14, Naproxen (277nm): 5.56, Sumatriptan (262nm): 11.65, Sumatriptan
(277nm): 10.33.
4.8. Robustness
To check for any variability allowed in the method robustness is a very important criterion to
be considered. For UV method wavelength change is done and also diluents change. The
results do not affect the method and it is found to be robust.
Allowable wavelength variation is from -1 to +1 nm. Allowable variation in diluent
composition is 10% of the organic phase. The %RSD for both the variations is below 2%.
5. CONCLUSIONS
A novel and simple Q absorption ratio method has been developed for simultaneous analysis
of Naproxen and Sumatriptan in tablet formulation. Simple, Accurate, Precise, Economical
UV method has been developed using phosphate buffer pH 6.8 and methanol (50:50 v/v) as
diluent. Determination is done at 262.0 and 277.0 nm over the concentration ranges of 10-110
µg/ml for both. Validation also covers parameters like Accuracy, Specificity, Robustness,
www.wjpr.net Vol 7, Issue 01, 2018. 1426 6) REFERENCES
1. Gondalia RP, Dharamsi AP. Spectrophotometric simultaneous estimation of sumatriptan
succinate and naproxen sodium in tablet dosage form. Asian J Pharm Clin Res, 2011;
4(2): 31-32.
2. Trinath M, Saurabh K Banerjee, Hari Hara Teja D, C. G. Bonde. Development and
validation of spectrophotometric method for simultaneous estimation of sumatriptan and
naproxen sodium in tablet dosage form. Pelagia Research Library, 2010; 1(1): 36-41.
3. Sagar D Solanki, Dr. Paresh U Patel, Dr. Bhanubhai N Suhagiya. Development and
validation of spectrophotometric method for simultaneous estimation of sumatriptan
succinate and naproxen sodium in pharmaceutical dosage form. J Pharm Sci Bio sci Res,
2011; 1(1): 50-53.
4. RP Gondalia, AP Dharamsi. Spectrophotometric simultaneous estimation of naproxen
sodium and sumatriptan succinate in tablet dosage forms. Int J Pharm Biomed Sci, 2010;
1(2): 24-26.
5. Yarram R Reddy, Kakumani K Kumar, MRP Reddy, K. Mukkantti. Rapid simultaneous
determination of sumatriptan succinate and naproxen sodium in combined tablets by
validated ultra-performance liquid chromatographic method. J Anal Bio anal Techniques,
2011; 2(3): 2-3.
6. Sagar D Solanki, Dr. Paresh U Patel. Development and validation of reversed-phase high
performance liquid Chromatographic method for simultaneous estimation of sumatriptan
succinate and naproxen sodium in pharmaceutical dosage form. Int J Pharm Pharm Sci,
2011; 4(1): 276-278.
7. Y Swapna, G Nagarjun Reddy, Chandra K Sekhar. A new RP -HPLC method for
simultaneous estimation of naproxen and sumatriptan in tablet dosage form. Int J Pharm
Bio Sci, 2013; 3(1): 179-185.
8. Gondalia Riddhi, Dr. Abhay Dharamsi. Simultaneous estimation of sumatriptan succinate
and naproxen sodium in bulk drug and pharmaceutical dosage form by RP-HPLC
method. J Drug Delivery & Therapeutics, 2013; 3(2): 93-97.
9. Krishna A, Kiranmai K, Rojy George, Meena maduri K, R.Ravinder reddy, Panikumar
AD. Simultaneous estimation of naproxen sodium and sumatriptan succinate in tablet
dosage forms by RP-HPLC method. J Pharm Res, 2011; 4(9): 3021-3023.
10.Kamepalli Sujana, D Gowri Sankar, Konda Abbulu. Simultaneous estimation of
sumatriptan succinate and naproxen sodium by RP-HPLC in bulk and pharmaceutical
www.wjpr.net Vol 7, Issue 01, 2018. 1427
11.Rajesh Nuni, M Sumithra, B V V Sandeep Kumar, Panjagala Satyanarayana, D.
Narasimha Rao. Analytical method development and validation for simultaneous
determination of sumatriptan and naproxen by RP-HPLC. Int J Adv Pharm Res, 2011;
2(7): 363-379.
12.ICH Harmonised Tripartite Guideline Validation Of Analytical Procedures: Text And