A STUDY ON DRUG UTILIZATION PATTERNS AND
EFFECTIVENESS OF ANTIDIABETIC AGENTS IN DIABETIC
PATIENTS
Anitha Vani M.*, Sunil Adhikari and Mahadevamma M. L.
Department of Pharmacy Practice, East West College of Pharmacy, Bengaluru, India.
ABSTRACT
Diabetes Mellitus is on alarming rise in India. Drug utilization studies
help to identify the extent of drug use and rationality. Objectives: To
determine the drug utilization pattern and effectiveness of anti-diabetic
agents in diabetic patients. Methodology: It was a Prospective &
Observational study carried out for a period of six months at Apollo
Multi-Specialty hospital, Bengaluru. The diabetic patients who visited
the Medicine, Cardiology and Endocrinology inpatient departments
were enrolled. The study was carried out after obtaining Institutional
Ethical committee clearance. Results: Of 285 prescriptions assessed,
179(62.8%) were males and 106(37.2%) were females. Most
[103(36.1%)] of the patients were in the age group of 61-70 years. HTN & hypothyroidism
were the most common co-morbidities seen. Prevalence of Type-1 & Type-2 DM was found
to be 4.6% and 95.1% respectively. Out of 285 patients 69 patients were on monotherapy, 82
were on dual therapy, 15 patients were on triple therapy of OHA, 227(79.6%) patients
received the Insulin monotherapy and 46(16.1%) received Insulin dual therapy. 96(33.7%) of
patients were given with both. Majority [131(46%)] of the patients were well controlled with
Metformin, Metformin & Glimepride, Metformin with Glimepride & Voglibose and Human
actrapid based on the GRBS levels and the rationality was found to be 98.2%. Conclusion:
This study concludes that DM can be well controlled by using both OHA and Insulin along
with the lifestyle modifications which increase the risk of metabolic changes that influence
the well being of the population.
KEYWORDS: Diabetes Mellitus, Drug utilization & Anti-diabetic agents.
Volume 7, Issue 1, 716-737. Research Article ISSN 2277– 7105
*Corresponding Author Anitha Vani M.
Department of Pharmacy
Practice, East West College
of Pharmacy, Bengaluru,
India.
Article Received on 07 November 2017,
Revised on 28 Nov. 2017, Accepted on 19 Dec. 2017
DOI: 10.20959/wjpr20181-10485
INTRODUCTION
Diabetes mellitus is a pandemic and metabolic disorder that has struck each and every corner
of the world and is on alarming rise in India.[1-2] According to the Indian Council of Medical Research (ICMR), a national diabetes study revealed that India currently has 62.4 million
people with diabetes. In 2010, approximately 285 million people worldwide had DM, and it
is estimated that more than 438 million people will have DM by 20303.The prevalence of diabetes for all age-groups worldwide was estimated to be 2.8% in 2000 and 4.4% in 2030.
The prevalence of diabetes is higher in men than women, but there are more women with
diabetes than men. The urban population in developing countries is projected to double
between 2000 and 2030. The most important demographic change to diabetes prevalence
across the world appears to be the increase in the proportion of people >65 years of age. The
number of people with diabetes is increasing due to population growth, aging, urbanization,
and increasing prevalence of obesity and physical inactivity.[4]
According to WHO(World Health Organisation), Diabetes mellitus is defined as a metabolic
disorder of multiple etiology characterized by chronic hyperglycemia with disturbances of
carbohydrate, protein and fat metabolism resulting from defects in insulin secretion, insulin
action, or both.[5]
Insulin produced by the pancreas lowers blood glucose. It is characterized by a defect in
insulin secretion and cellular resistance to the action of insulin. It requires lifelong treatment
with lifestyle modifications and medicines to prevent complications.[6]DM can cause both morbidity and mortality and requires appropriate treatment to improve the quality of life.
Poor management of these two disorders leads to several complications. Management of DM
requires both pharmacological and non-pharmacological interventions.[7]The various types of DM are discussed below:
I. Type-1 diabetes Mellitus (cell destruction, usually leading to absolute insulin deficiency).
A. Immune mediated,
B. Idiopathic.
II. Type-2 diabetes Mellitus (may range from predominantly insulin resistance with relative
insulin deficiency to a predominantly secretory defect with insulin resistance).
III.Other specific types
A. Genetic defects of cell function, B. Genetic defects in insulin action, C. Diseases of the
Uncommon forms of immune-mediated diabetes, H. Other genetic syndromes sometimes
associated with diabetes.
IV.Gestational diabetes mellitus[8]
Modern principles of management of diabetes focus on disease prevention, screening high
risk individuals and aggressive treatment of individuals in the pre-diabetic state. The current
pharmacotherapy of diabetes mellitus includes treatment with drugs such as insulin and oral
hypoglycemic agents. Oral hypoglycemic agents are heterogeneous in their modes of action,
safety profiles and tolerability. The main classes include agents that stimulate insulin
secretion (sulfonylureas and rapid acting secretagogues), reduce hepatic glucose production
(biguanides), delay digestion and absorption of intestinal carbohydrate (α-glucosidase
inhibitors), improve insulin action (thiazolidinediones) and incretin based therapies like
dipeptidyl peptidase-4 inhibitors.[9]
Irrational prescription can lead to non-adherence to medications which may lead to diabetes
related complication (both micro vascular and macro vascular) due to poor glycemic control.
It may also increase the drug and health care costs.[10]
The increasing number of subjects diagnosed with the disease suggests that it is necessary to
study and understand the profile of Oral Hypoglycemic Agents (OHA) and insulin use and
this increase in health demands, with a complex range of chronic medicines and poor
adherence to prescribed medicines, has forced clinical pharmacists to take a patient-centered
approachalong with the engagement of multidisciplinary expertise like physicians and other
hospital staff.
Analysis of prescription pattern as a part of drug utilization study is believed to be the most
productive and effective methods to assess and evaluate the prescribing attitude of physician.
Hence Drug utilization studies seek to monitor, evaluate and implement remedies in the
prescribing practice with the aim of making the medical care rational and effective
pharmacological management of Type-1 and Type-2 diabetes mellitus.
In this study, an attempt has been made to describe the current prescribing pattern and trend
of anti-diabetic drug therapy along with the effectiveness of these drugs in maintaining an
optimal glycemic level in diabetic patients and statistically analyzed the prescriptions on the
Demographic characters of patients.
Showing incidence of DM according to different age groups
Showing incidence of DM according to sex.
Analysis of prescription showing incidence with other diseases
Patterns of utilization of major Pharmacological drug classes.
MATERIALS AND METHODS
This was a Prospective and Observational study performed on 285 patients in Apollo
Multi-Specialty Hospital & Research centre, Bengaluru, for a period of 6 months with the primary
objective to evaluate the Drug Utilization pattern and effectiveness of anti-diabetic agents and
the secondary objectives include:
a. To review and analyze drug prescriptions of type-1 and type-2 diabetes mellitus patients
b. To assess the effectiveness of drugs based on glycemic control
c. To analyze the rational use of drugs in Diabetes Mellitus patients.
Inclusion Criteria
1. Newly diagnosed and known cases of DM with or without other co-morbidities who were
receiving anti-diabetic agents
2. All Patients irrespective of gender, age
Exclusion Criteria
Pregnant and Lactating women.
Source of Data and Method of Data collection
Patient’s demographics, clinical findings, laboratory and therapeutic data were collected from
inpatients and the main sources for the collection of data were Patient’s case notes, Treatment
charts /Medication charts, Lab data reports, Patient Discharge Summaries.
Study procedure
The present study was conducted in Medicine, Cardiology and Endocrinology in-patient
departments (IPD) with the sample size of 285 patients who met the Criteria. WHO based
prescription auditing pro-forma was used for data collection, which includes the medication
details (name, dose, frequency, route etc.), patient details (name, age and sex), socioeconomic
parameters, past medical history, disease diagnosed and duration of treatment. All the
DM patients with or without the co-morbidities. The Anti-Diabetic medications used in the
Diabetic patients were recorded along with the other required laboratory details. The
Anti-Diabetic medications used to treat the patients were then analyzed and compared with the
hospital based treatment standards.
Findings of Monotherapy and Combination therapy
The total prescriptions were analyzed for Anti-Diabetic agents and were screened for the
choice of drugs given, their class, type of therapy i.e., Monotherapy/Combination therapy,
strength and dose schedule, Duration of therapy, Therapeutic category. Drugs were grouped
in major classes of anti-diabetic monotherapy of OHAs – Sulfonylureas, Biguanides,
Thiazolidinediones, DPP-4 Inhibhitors, Alpha-glucosidase inhibitors, Meglitinides and
Insulin as – Rapid acting, Long acting, Intermediate acting, Short acting, Premixed insulin
analogue combinations. Monotherapy was defined as a prescription for one agent, or two
within the same drug class, Example:- Metformin, Human Actrapid. Combination therapy
was defined as a prescription for more than one agent from two classes, including two agents
in one formulation, Example:-Metformin+Glimepride, Human Mixtard (Soluble Insulin +
Isophane Insulin). The Prescriptions of combination therapy were also reviewed for Triple
therapy along with that of Dual therapy. All these parameters of monotherapy and
combination therapy were analyzed to assess the Rational use.
Statistical Methods: Descriptive and inferential statistical analysis has been carried out in
the present study. Results on continuous measurements are presented on Mean SD
(Min-Max) and results on categorical measurements are presented in Number (%).
Chi-square/ Fisher Exact test has been used to find the significance of study parameters on
categorical scale between two or more groups, Non-parametric setting for Qualitative data
analysis.
Significant figures
+ Suggestive significance (P value: 0.05<P<0.10)
* Moderately significant (P value: 0.01<P 0.05)
** Strongly significant (P value: P0.01)
Statistical software: The Statistical software namely SPSS 15.0, was used for the analysis of
RESULTS AND DISCUSSION
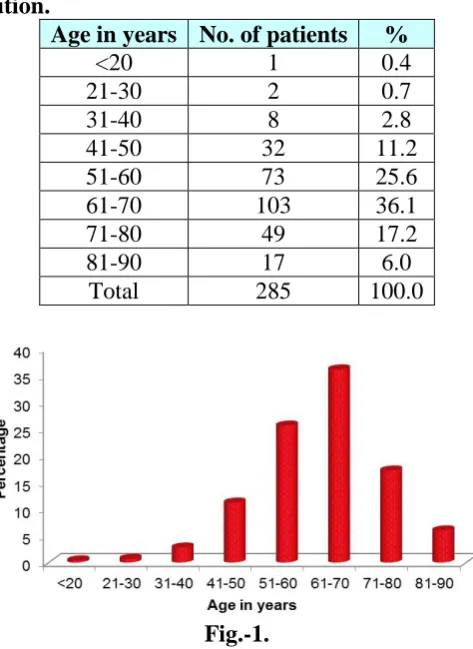
Table 1: Age distribution.
Age in years No. of patients %
<20 1 0.4
21-30 2 0.7
31-40 8 2.8
41-50 32 11.2
51-60 73 25.6
61-70 103 36.1
71-80 49 17.2
81-90 17 6.0
Total 285 100.0
Fig.-1.
The age distribution of 285 patients revealed that the DM is most common in the elderly
stage i.e., above 50 years of age than in the population of age group between 21-50 years.
Hence, as per the results obtained in our study, Prevalence of DM was found as
[image:6.595.212.388.552.760.2]Geriatrics>adults and middle aged people>children/teenagers of age <20 years.
Table 2: Gender distribution.
Gender No. of patients %
Female 106 37.2
Male 179 62.8
Total 285 100.0
Out of the 285 patients observed, male patients predominated over female patients in the
exposure of DM.
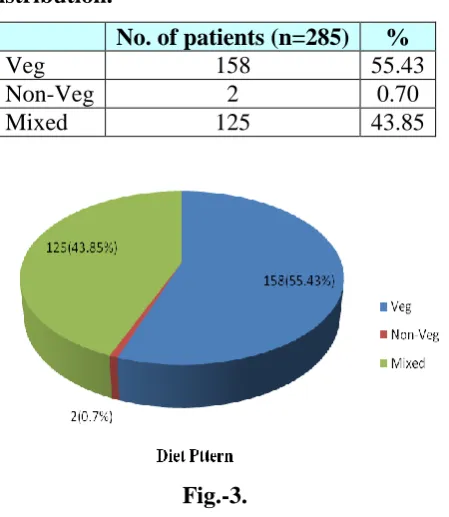
Table 3: Diet pattern distribution.
No. of patients (n=285) %
Veg 158 55.43
Non-Veg 2 0.70
[image:7.595.190.415.137.396.2]Mixed 125 43.85
Fig.-3.
Of 285 patients, majority 158(55.43%) were vegetarians, 125(43.85%) were consuming
mixed diet and 2(0.70%) were non-vegetarians. Greater prevalence in this age group may be
due to change in life style, lack of exercise and stress.
Table 4: Smoking status distribution.
Smoker No. of patients %
No 279 97.9
Yes 6 2.1
Total 285 100.0
The results show that the prevalence of DM is more in patients who are not smoking even
though smoking is a risk factor to develop DM.
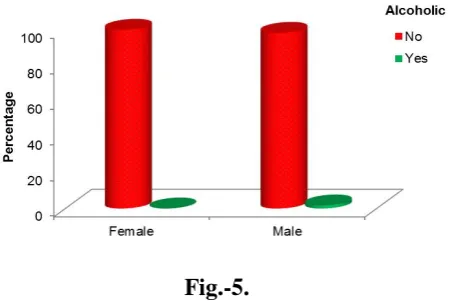
Table 5: Alcoholic status distribution.
Alcoholic Gender Total
Female Male
No 106(100%) 176(98.3%) 282(98.9%)
Yes 0(0%) 3(1.7%) 3(1.1%)
[image:8.595.189.414.258.410.2]Total 106(100%) 179(100%) 285(100%) P=0.180, Not significant, Chi-Square test.
Fig.-5.
As per the table, the study revealed that only 3(1.1%) patients were alcoholic out of total 285
patients and remaining 282(98.9%) were non-alcoholics.
Table 6: Type of DM distribution.
Type of DM
Gender
Total (n=285) Female
(n=106)
Male (n=179)
Type 1 3(2.8%) 10(5.6%) 13(4.6%) Type 2 102(96.2%) 169(94.4%) 271(95.1%) P=0.288, Not significant, Chi-Square test.
It shows that the patients suffering from Type-1 DM were 13(4.6%) and Type-2 DM patients
were 271(95.1%) indicating the highest prevalence of Type-2 DM.
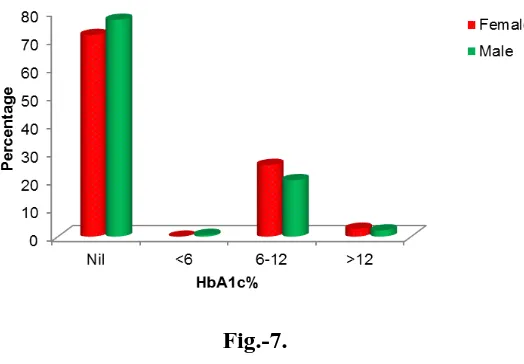
Table 7: HbA1c% distribution.
HbA1c% Gender Total
Female Male
Not Advised(NA) or Nil 76(71.7%) 138(77.1%) 214(75.1%)
<6 0(0%) 1(0.6%) 1(0.4%)
6-12 27(25.5%) 36(20.1%) 63(22.1%)
>12 3(2.8%) 4(2.2%) 7(2.5%)
[image:9.595.123.466.145.251.2]Total 106(100%) 179(100%) 285(100%) P=0.612, Not significant, Chi-Square test.
Fig.-7.
As per the HbA1c % distribution from the table, the HbA1c% was advised, if the patients had
uncontrolled blood glucose levels, other co-morbidities or diabetes associated complications
and hence the remaining 214 patients were not been advised to test their A1c percentages.
Table 8: Distribution based on GRBS Levels.
GRBS
Gender
Total
(n=285) P value
Female (n=106)
Male (n=179) Admission
<150 36(34%) 66(36.9%) 102(35.8%)
0.731 150-300 56(52.8%) 86(48%) 142(49.8%)
>300 14(13.2%) 27(15.1%) 41(14.4%) Discharge
<150 55(51.9%) 95(53.1%) 150(52.6%)
0.968 150-300 49(46.2%) 80(44.7%) 129(45.3%)
[image:9.595.170.432.293.475.2]Fig.-8a.
Fig.-8b.
According to the table no:8 & Fig:8(a,b), the GRBS distribution pattern shows the
comparative values of the patients at the time of admission and discharge. This table allows
us to analyze the extent of glucose control in the patients admitted. The study revealed that
the majority 142(49.8%) of the patients were having the GRBS level from 150-300 mg/dl
followed by the 102(35.8%) patients of GRBS level <150 mg/dl and the remaining
41(14.4%) patients had above 300 mg/dl at the time of admission.
Similarly, the GRBS levels checked at their discharge revealed that 150(52.6%) patients had
below 150 mg/dl, 129(45.3%) patients had in between 150-300 mg/dl and 6(2.1%) patients
were found to have the GRBS level greater than 300 mg/dl. This comparison shows that
majority of the patients had good glycemic control before discharge.
Table 9: Distribution according to Glycemic control.
Glycemic control Gender Total
Female Male
Uncontrolled 28(26.4%) 37(20.7%) 65(22.8%) Controlled 51(48.1%) 80(44.7%) 131(46%) Moderately controlled 24(22.6%) 51(28.5%) 75(26.3%) Controlled without medication 3(2.8%) 11(6.1%) 14(4.9%)
Total 106(100%) 179(100%) 285(100%)
Fig.-9.
As per the table, we found that out of 285 patients, majority 131(46%) of the patients were
found to have controlled blood sugar and 65(22.8%) patients were found to be uncontrolled
due to the co-morbidities. 14(4.9%) patients were found to have controlled blood glucose
levels without medication by controlling the diet during the hospital stay. Therefore
intensification of current drug treatment as well as planning multiple drug interventions with
[image:11.595.124.465.445.534.2]lifestyle modification is necessary.
Table 10: OHA therapy distribution.
Type of therapy
Gender
Total
(n=285) P value
Female (n=106)
Male (n=179)
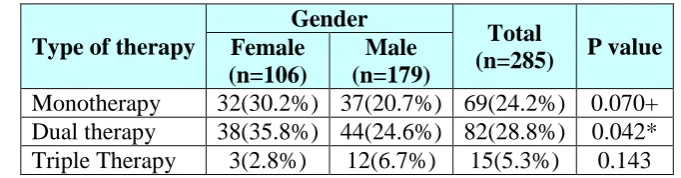
Monotherapy 32(30.2%) 37(20.7%) 69(24.2%) 0.070+ Dual therapy 38(35.8%) 44(24.6%) 82(28.8%) 0.042* Triple Therapy 3(2.8%) 12(6.7%) 15(5.3%) 0.143 Chi-Square test/Fisher Exact test.
[image:11.595.163.436.562.748.2]OHA distribution of 285 patients showed that 69(24.2%) patients were on monotherapy,
among which 32(30.2%) were females and 37(20.7%) were males. Patients with dual therapy
were found to be 82(28.8%), in which 38(35.8%) were female and 44(24.6%) were males.
Very few around 15(5.3%) of the patients received triple therapy.
Table 11: OHA Monotherapy and Dual Therapy distribution.
Mono therapy & Dual Therapy Gender Total
Female Male
No 98(92.5%) 171(95.5%) 269(94.4%)
Yes 5(4.7%) 3(1.7%) 8(2.8%)
Controlled without Medication 3(2.8%) 5(2.8%) 8(2.8%)
Total 106(100%) 179(100%) 285(100%)
[image:12.595.162.437.307.488.2]P=0.323, Not significant, Chi-Square test.
Fig.-11.
Among all, only 8(2.8%) of patients received both mono and dual therapy indicating that
majority 269(94.4%) of patients were receiving other type of therapies.
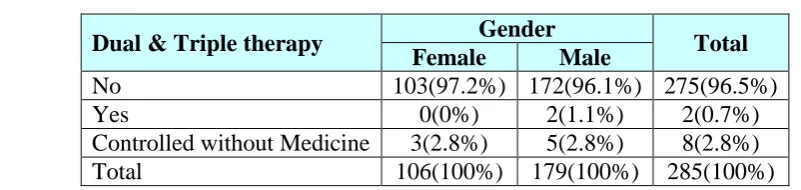
Table 12: OHA Dual & Triple therapy distribution.
Dual & Triple therapy Gender Total
Female Male
No 103(97.2%) 172(96.1%) 275(96.5%)
Yes 0(0%) 2(1.1%) 2(0.7%)
Controlled without Medicine 3(2.8%) 5(2.8%) 8(2.8%)
Total 106(100%) 179(100%) 285(100%)
[image:12.595.80.481.577.672.2]Fig.-12.
The above table showed that 2(1.1%) of patients received both dual as well as triple therapy
to control their glycemic levels.
Table 13: Distribution pattern of Combination of OHA and Insulin.
Combination of OHA & Insulin Gender Total
Female Male
No 63(59.4%) 126(70.4%) 189(66.3%)
Yes 43(40.6%) 53(29.6%) 96(33.7%)
Total 106(100%) 179(100%) 285(100%)
P=0.059+, significant, Chi-Square test.
Fig.-13.
Based on the table, the distribution of patients prescribed with both OHA and Insulin
revealed that 96(33.7%) of patients were given with both to have optimum glucose control
and the remaining 189(66.3%) patients received either of the treatment i.e., either OHA or
Insulin. The results show that the number of males (53) were high compared to the number of
that out of 285 patients, majority(271) were found to have Type-2 DM and 13 patients with
Type-1 DM. Hence on correlating both the tables we found that the Insulin was given to treat
Type-2 DM along with OHA i.e management of disease with combination therapies of
insulin and different oral anti-diabetic drugs were prescribed for proper glycemic control.
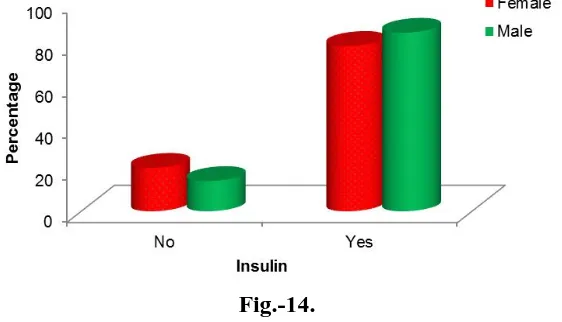
Table 14: Insulin therapy distribution.
Insulin Gender Total
Female Male
[image:14.595.159.440.305.466.2]No 22(20.8%) 26(14.5%) 48(16.8%) Yes 84(79.2%) 153(85.5%) 237(83.2%) Total 106(100%) 179(100%) 285(100%) P=0.174, Not significant, Chi-Square test.
Fig.-14.
Out of 285 patients, 237(83.2%) patients were treated with Insulin among which, majority
153(85.5%) were males and 84(79.2%) were females indicating that remaining 48(16.8%)
patients were treated with OHA. Eventhough oral hypoglycemics still dominate the
prescribing pattern, but here was a shifting trend toward the use of insulin preparations in the
management of Type 2 diabetes mellitus.
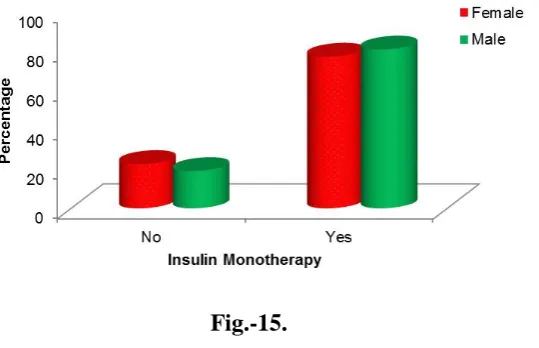
Table 15: Insulin Monotherapy distribution.
Insulin Monotherapy Gender Total
Female Male
No 24(22.6%) 34(19%) 58(20.4%)
Yes 82(77.4%) 145(81%) 227(79.6%)
Fig.-15.
The distribution pattern of Insulin monotherapy shows that 227(79.6%) patients were
receiving the Insulin monotherapy i.e one insulin formulation like Human Actrapid.
Table 16: Insulin Dual Therapy distribution.
Insulin Dual Therapy Gender Total
Female Male
No 91(85.8%) 148(82.7%) 239(83.9%)
Yes 15(14.2%) 31(17.3%) 46(16.1%)
[image:15.595.165.437.470.645.2]Total 106(100%) 179(100%) 285(100%) P=0.482, Not significant, Chi-Square test.
Fig.-16.
The above table shows that, 46(16.1%) of patients were on insulin dual therapy. It is assessed
as Insulin dual therapy when Premixed biphasic solutions from same or different insulin
Table 17: Insulin Mono and Dual Therapy distribution.
Insulin Mono and Dual Therapy Gender Total
Female Male
No 93(87.7%) 155(86.6%) 248(87%)
Yes 13(12.3%) 24(13.4%) 37(13%)
Total 106(100%) 179(100%) 285(100%)
[image:16.595.171.428.211.355.2]P=0.781, Not significant, Chi-Square test.
Fig.-17.
Insulin Mono and Dual therapy
According to the table, out of 285 patients, 37(13%) of the patients were prescribed with both
[image:16.595.98.455.449.773.2]mono and dual/premixed biphasic Insulin therapy based on the GRBS levels.
Table 18: Final Diagnosis and Co-morbidities.
Co-morbidity Total number of patients Percentage
HTN 194 68.07%
IHD 58 20.35%
Hypothyroidism 33 11.57%
CKD 32 11.22%
CAD 16 5.61%
OA 13 4.56%
AFI 12 4.2%
TVD 10 3.5%
Unstable angina 10 3.5%
LV Dysfunction 9 3.5%
Asthma 8 2.8%
Edema 8 2.8%
UTI 8 2.8%
B/L cellulitis 6 2.1%
Seizures 6 2.1%
LRTI 5 1.75%
Neuropathy 4 1.4%
Nephropathy 3 1.05%
Retinopathy 3 1.05%
Fig.-18.
The table shows that HTN with other cardiac complications like IHD, CAD, TVD are the
common comorbidities associated with DM followed by Hypothyroidism, CKD, OA etc.
Table 19: Anti-diabetic prescription pattern.
Drugs Total Number of Prescriptions
of OHA(166) Percentage
OHAs Used Monotherapy
Biguanides (metformin) 43 25.90%
Sulfonylureas (glimepiride) 11 6.62%
Sulfonylureas (gliclazide) 3 1.80%
Sulfonylureas (Glyburide) 3 1.80%
Alpha-glucosidase Inhibhitors (voglibose) 1 0.60%
Thiazolidinediones(Pioglitazone) 4 2.40%
DPP-4 Inhibhitors (Vildagliptin) 4 2.40%
Dual Therapy
Metformin+Glimepride 44 26.50%
Metformin+Vildagliptin 23 13.85%
Metformin+Sitagliptin 9 5.42%
Metformin+Piogiltazone 2 1.2%
Metformin+Glibenclamide 3 1.8%
Metformin+Glipizide 1 0.60%
Triple therapy
Glimepride+Metformin+voglibose 7 4.21%
INSULIN Total Insulin Prescriptions (237)
Human Actrapid 186 78.48%
Lantus 47 19.83%
Human Mixtard 19 8.01%
Novomix 11 4.64%
Novorapid 7 2.95%
Levemir 4 1.68%
Apidra 3 1.26%
Insugen 3 1.26%
[image:17.595.66.540.343.788.2]Fig:19a
Monotherapy of OHAs Used
Fig.-19b.
Dual therapy of OHAs used
Insulin used
Table no:19 & Fig:19(a,b,c,d) shows that, the most commonly prescribed drugs were
Biguanides (Metformin) with or without the combination of Sulfonylureas (Glimepride) and
Alpha-Glucosidase Inhibhitors (Voglibose) based on the requirements of mono/dual/triple
therapy. Insulin was prescribed in both the patients of Type-1 and Type-2 DM and the most
commonly used Insulin was Human Actrapid followed by Lantus and Human Mixtard.
Table 20: ADR distribution.
ADR Gender Total
Female Male
[image:19.595.182.419.348.483.2]No 104(98.1%) 178(99.4%) 282(98.9%) Yes 2(1.9%) 1(0.6%) 3(1.1%) Total 106(100%) 179(100%) 285(100%) P=0.288, Not significant, Chi-Square test.
Fig.-20.
The above table reveals the number of ADRs found in the study. Out of 285 patients, 3(1.1%)
of patients had hypoglycemia among which 2(1.9%) were females and 1(0.6%) were males
[image:19.595.160.437.610.680.2]indicating that the incidence of hypoglycemia is been controlled to 98.9%.
Table 21: Rational Use distribution.
Rational Use Gender Total
Female Male
No 1(0.9%) 4(2.2%) 5(1.8%)
Fig.-21.
Based on the table, Rationality was found to be 98.2% indicating that the prescriptions were
based on dose, duration, condition of the patient and associated complications where no
sub/overdose and interactions were found.
CONCLUSION
Now a days, it is necessary that one should be aware of the rapid growing ill health,
especially the diseases which are the impact of changing lifestyle from stress, obesity, lack of
exercise, anxiety etc. One such disease is Diabetes Mellitus which is a result of altered
metabolism of fat, carbohydrate, lipid and protein. DM if not controlled lead to various
cardiac, renal and endocrinal complications. Hence its management plays a key role where
Drug Utilization studies help to evaluate, monitor and implement the remedies in prescribing
practices of Anti-Diabetic agents.
Our study was conducted to assess effectiveness of the therapy and rational use in the
Diabetic patients and we found that the prevalence of Type-2 DM was high than Type-1 DM
with high percentage of men. The reason for the occurrence of DM was found to be
irrespective of diet, smoking and alcohol habits of the subjects even though they are one of
the risk factors but most of them had the family history of positive DM. HTN, IHD,
Hypothyroidism, CKD & Diabetic foot were the most common co-morbidities. The treatment
was based on the GRBS levels of inpatients which was monitored frequently by using OHAs
and Insulin therapy or by the combination of both based on the glycemic swings.
The most commonly prescribed drugs were Biguanides (Metformin) with or without the
combination of Sulfonylureas (Glimepride) and Alpha-Glucosidase Inhibhitors (Voglibose)
patients of Type-1 and Type-2 DM and the most commonly used Insulin was Human
Actrapid followed by Lantus and Human Mixtard.
By comparing the GRBS levels at the time of admission to that of the GRBS levels at their
discharge, we concluded that majority of the patients were well controlled with their sugar
levels and the therapy was assessed to be effective based on this.
Study results revealed that most of the prescriptions were rational and findings suggest the
importance of combination therapies including insulin sensitizing agents and
self-management behaviors in helping poorly controlled patients achieve good glycemic control.
ACKNOWLEDGEMENT
“Putting in time is an effort” which is a necessary part of achieving success. I deeply indebted
to GOD almighty and my parents, for enabling me to complete this dissertation in a fine
manner. I express my deepest sense of gratitude to Dr. Shridhar K A, Principal, East West
College of Pharmacy, for his sincere guidance and support. The present study has been
undertaken and completed under the expert guidance and encouragement of Mrs.
MAHADEVAMMA L, Guide and Head of the Department, East West College of Pharmacy.
I extend my thanks to Dr. Suresh K P, statistician, for his support and guidance in the
statistical analysis and preparation of the data.
I specially express my whole hearted thanks to my near and dear one, M.N.D. Ramadevi for
moral support and encouragement during the entire period of my study. My sincere
expression of gratitude to the Dr. Ananth N Rao, member secretary, Dr. Nandish.C, H.O.D &
Pharmacologist, Mrs. Sravanthi, Institutional Ethics Committee at Apollo Hospital,
Bengaluru. Last but not least, I extend my thanks to all those who have been directly or
indirectly associated with my study, Ashish Lamsal, Sami Prajuli, Kejeeya Baskota, Tambe
Atem Daniel, Bibek Dutta Bhatta, for their contribution and moral support.
REFERENCES
1. Akshay A, Pradeep, Jadhav, Yeshwant A. Deshmukh. Prescribing pattern and efficacy of
anti-diabetic drugs in maintaining optimal glycemic levels in diabetic patients. Journal of
2. Alti Aparna, Seema Pushpa Latha, Gopalgari Lakshmi Nagarjun, Galammagari Nagaraju,
C.Gopinath, P. Murali Madhav. A Study on Drug Utilization Pattern and Effectiveness of
Oral Hypoglycemic Agents in Diabetes Mellitus. Pharma Tutor, 2015; 3(7).
3. Jamuna Rani, Sambasiva Reddy. Prescribing pattern of anti-diabetic drugs in urban
population of Hyderabad. National Journal of Physiology, Pharmacy & Pharmacology,
2015; 5(1).
4. Sarah Wild, MB Bchir, Gojka Roglic, Anders Green, Richard Sicree, Hilary King. Global
Prevalence of Diabetes Estimates for the year 2000 and projections for 2030. Diabetes
Care, 2004; 2(7).
5. A Report of a WHO Consultation on Definition,Diagnosis and Classification of Diabetes
Mellitus and its Complications. Department of Non-Communicable Diseases
Surveillance,Geneva, 1999; 1-2.
6. Machanchery S, Marimuthu Karthikeyan. Prescription pattern of antidiabetic drugs in the
outpatient departments of hospitals in Malappuram District, Kerala. Journal of Basic and
Clinical Pharmacy, December 2011; 22(4).
7. L. Bjerrum J, Sùgaard J, Hallas J, Kragstrup. Polypharmacy: correlations with sex, age
and drug regimen-A prescription database study. European Journal of Clinical
Pharmacology, 1998; 54.
8. American Diabetes Association. Diagnosis and Classification Of Diabetes Mellitus.
Diaberes Care, 2010; S65.
9. Soumya Mary Alex, Sreelekshmi BS, Smitha S, Jiji KN, Arun S Menon, Uma Devi P.
Drug Utilization Pattern Of Anti-Diabetic Drugs Among Diabetic Outpatients In A
Tertiary Care Hospital. Asian Journal of Pharmaceutical and Clinical Research, 2015;
8(2).
10.Anil Kumar Pawah, Kumar Prafull Chandra. Prospective study of prescribing pattern in
patients with T2DM and hypertension. Scholars Journal of Applied Medical Sciences,