www.wjpr.net Vol 4, Issue 4, 2015. 234
DEVELOPMENT OF COLORIMETRIC METHOD FOR THE
ANALYSIS OF AMINOCAPROIC ACID USING DCQ
Shaza W. Shantier*, Elrasheed A. Gadkariem and Rashida Mohamed
Department of Pharmaceutical Chemistry, University of Khartoum, Sudan.
ABSTRACT
A simple, sensitive, accurate and cost-effective colorimetric method
was developed for the analysis of aminocaproic acid in bulk and
injectable forms. The developed method was based on the generation
of a colored complex through utilizing the known reaction of 2,
6-dichloroquinone 4-chloroimide (DCQ) with phenols, primary and
secondary amines. A colored product with λmax at 680nm was formed
after heating aminocaproic acid with DCQ in dimethylsulfoxide
(DMSO) for 10 minutes. Stoichiometry of the reaction was studied and
revealed 1:1 ratio. Beer’s law was found to be valid over the
concentration range 3-15µg/ml. Regression analysis showed good
correlation coefficient (not less than 0.998) with detection limit and
quantification limit of 1.51µg/ml and 5.00µg/ml respectively. The mean percentage recovery
was found to be 100.30 ±1.84, n=4.
KEYWORDS: Colorimetry; Aminocaproic acid; DCQ.
1. INTRODUCTION
Aminocaproic acid (Fig. 1) is a derivative and analogue of the amino acid lysine. It is
indicated for the treatment of fibrinolysis and blood loss,[1] intracranial hemorrhage,[2]
cirrhosis, hyperfibrinolysis[3] and as adjunctive therapy in hemophilia.
Many liquid chromatographic methods were reported for analysis of ACA in plasma[4] and
urine.[5]
Fig.1 Chemical structure of Aminocaproic acid.
Volume 4, Issue 4, 234-240. Research Article ISSN 2277– 7105
Article Received on 20 Jan 2015,
Revised on 15 Feb 2015, Accepted on 11 Mar 2015
*Correspondence for
Author
Shaza W. Shantier
Department of
Pharmaceutical
Chemistry, University of
www.wjpr.net Vol 4, Issue 4, 2015. 235
DCQ has been utilized as chromogenic reagent for the spectrophotometric determination of
some thiol containing drugs,[6, 7] amine containing drugs[8, 9] and phenolic drugs.[10, 11]
In the present work, DCQ (Gibbs reagent) was used as chromogen for the colorimetric
determination of aminocaproic acid in bulk and pharmaceutical formulations.
2. EXPERIMENTAL
2.1. MATERIALS AND INSTRUMENTS
All materials and reagents used were of analytical grade.
Aminocaproic acid injection (Amicar® 250mg/ml) was obtained from Hospira, USA. The
reference standard obtained from Saudi Arabia Central lab, KSA. The chromogen reagent; 2,
6-dichloroquinone-4-chlorimide (DCQ); was obtained from Fluka Analytical, Austria;
0.4%w/v of the reagent was freshly prepared in dimethylsulfoxide. Dimethylsulfoxide
(DMSO); Loba Chemie, India. Sodium acetate; British Drug House, England.
UV spectrophotometric studies were carried out on Shimadzu UV-1800ENG240V, (Koyoto,
Japan).
2.2. Buffer solutions
Sodium acetate buffer of pH 3.5 and 5.5 were prepared in distilled water.
2.3. Stock solution of standard aminocaproic acid (ACA)
0.01 g of aminocaproic acid RS was accurately weighed and dissolved in 1 ml of water. The
solution was transferred to 50ml volumetric flask and volume was then completed to mark
with dimethylsulphoxide. 3ml of the resultant solution was further diluted to 10ml using
dimethylsulphoxide (60µg/ml; solution A)
2.4. Stock solution of aminocaproic acid injection (AMICAR®)
One ml of the injection was transferred into 25 ml volumetric flask and volume completed to
mark with distilled water. 1 ml was then transferred into 50 ml volumetric flask and volume
was then completed with dimethylsulphoxide. 3ml were further diluted to 10ml using
dimethylsulphoxide (60µg/ml; solution B).
3. Procedures
3.1. Calibration curve
Serial dilutions were made from solution A. Aliquot volumes of 0.5, 1.0, 1.5, 2.0 and 2.5ml
www.wjpr.net Vol 4, Issue 4, 2015. 236
each tube to adjust the volume to 2.5ml. 2ml of 0.4%w/v freshly prepared DCQ and 1ml of
sodium acetate buffer were added to each tube. The volumes were then completed to 10ml
with DMSO before heating for 10 minutes at 50 °C. After cooling, the absorbance values of
the resultant solutions were measured at 680nm against a blank reagent prepared similarly
using 2.5ml of DMSO instead of solution A.
The calibration curve was constructed by plotting the absorbance values versus the
aminocaproic acid concentration.
3.2. Assay of ACA injection
1.5ml of solution B was treated as under the calibration curve. The content of the injection
was then calculated either from the calibration curve or the corresponding regression
equation.
4. RESULTS AND DISCUSSION
Aminocaproic acid exhibits weak UV absorption. Therefore, a suitable chromogen is needed
to react with ACA to obtain a colored product that can increase the selectivity and sensitivity
of the drug analysis.
ACA contains an amino group, which is susceptible for the reaction with DCQ to produce a
colored product. Fig. 2 shows the UV/VIS spectrum of the reaction complex which has an
[image:3.595.142.442.510.676.2]analytically useful peak at 680nm.
Figure 2. UV/VIS spectrum of the ACA-DCQ complex
Reaction stoichiometry was determined by the Molar ration method using different aliquot
www.wjpr.net Vol 4, Issue 4, 2015. 237
function of ACA/DCQ molar ratio gave two branches that intersect at a mole ratio (1:1)
[image:4.595.166.431.399.649.2]corresponding to the formula of the colored complex (Figure 3).
Figure 3. Molar ratio plot for the stoichiometry determination
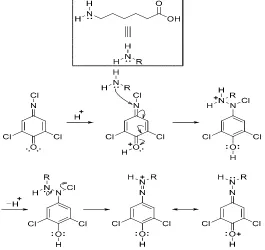
Accordingly, the reaction between ACA and DCQ was suggested to proceed as illustrated in
scheme 1.
Scheme 1. Proposed Pathway for the reaction of ACA with DCQ
3.1. Optimization of the reaction conditions
Experimental parameters that affecting the color development and stability were studied to
determine the optimum conditions. These include solvents, reagent concentration and
www.wjpr.net Vol 4, Issue 4, 2015. 238
The effect of solvents with different dielectric constants (DE) namely water (DE= 78),
ethanol (DE= 24.6) and DMSO (DE= 47) were studied (Table 1). More stable and intense
color was developed when using DMSO as a solvent.
Table 1. Effect of different solvent on the reaction mixture intensity and wavelength
Solvents A(mean) λmax R
Water 0.105 670 0.95
DMSO 0.33 680 0.998
Ethanol 0.06 670 0.00
The effect of reagent concentration was investigated by using 2ml of 0.2%, 0.4% and 1% w/v
DCQ solution. It was found that increasing the concentration of DCQ up to 0.4% would
increase the absorbance of the reaction complex, after which further increase in the
concentration of DCQ resulted in no change in the absorbance. Thus, 2ml of 0.4% w/v DCQ
was adopted as the suitable concentration for maximum absorbance.
The influence of pH on the absorption value of the reaction product was evaluated at neutral
and buffered media. The developed color in neutral media and pH 5.5 was found to be
unstable. Maximum color intensity was obtained with sodium acetate pH 3.5.
The effect of heating time on the reaction rate and color intensity was also studied. It was
found that increasing heating time gives faster color development and better r-values. Thus,
heating for 10minutes at 50 °C was established as the optimum condition for reproducible
absorbance values.
The sequence of addition of the reagents as described under calibration graph was essential
for good reproducibility. The formed color was found to remain stable for at least 1hour.
3.2. Analytical data
Beer’s law was found to be valid in the concentration range 3 – 15 µg/ml of aminocaproic
acid. Linear regression analysis of the data gave the following equation:
A= -0.0137+ 0.036C (r= 0.9989).
Where A is the absorbance in 1cm cell, C is the concentration of the drug in μg/ml and R is
the correlation coefficient.
Optical characteristics and statistical data for the regression equation of the proposed method
www.wjpr.net Vol 4, Issue 4, 2015. 239
The statistical calculation of the limit of detection and quantification was performed using the
following equation (12)
LOD= 3.3 δ/ S and LOQ = 10δ/ S
Where δ= standard deviation of the intercept of the regression line; S = the slope of the
calibration line.
Table2. Spectral data for the prosposed method (n=5)
Parameter Proposed method
λmax 680nm
Range 3-15µg/ml
Slope 0.036
Standard deviation of slope (Sb) 1.89×10⁻³
95% confidence limit of slope (tSb) 6.01×10⁻³
Intercept -0.0137
Standard deviation of slope (Sa) 0.0188 95% confidence limit of slope (tSa) 0.60
Correlation coefficient 0.9989
Limit of detection (LOD) 1.51
Limit of quantification (LOQ) 5.00
The proposed method was applied to the determination of aminocaproic acid in injections
labeled to contain 250mg/ml. The mean content percent of three independent analyses was
found to be 99.4±1.07, n=3.
The accuracy of the proposed method was checked out by added recovery testing. The results
showed good recovery (100.3 ±1.84, n=3), which indicates no interference with the injection
excipients.
In order to evaluate between days variation (reproducibility) and within day variation
(repeatability), three different conc. of ACA solution within the linearity range were assessed.
The calculated RSD values were found to be within the accepted limit(less than 2%), Table 3.
Table3. Precision of the developed method
Conc. µg/ml RSD% (n=3)
Repeatability Reproducibility
3 1.23 1.76
9 1.20 1.80
12 0.96 1.00
The accuracy of the method was evaluated through calculation of the Student-t-value at 95%
www.wjpr.net Vol 4, Issue 4, 2015. 240
t= (x-μ) √n /SD
t= (99.4-100).√3 /1.06= 1.01
Where;
t= Student-t-value
μ=known mean (considering injection content as 100%)
x=mean content of the sample
n= number of samples
SD= standard deviation of the assay results
The calculated t-value (1.01) was found to be less than the tabulated value (4.3). This
indicates the accuracy of the developed method.
4. CONCLUSION
Unlike the developed method, most of the reported methods for the assay of aminocaproic
acid require expensive or sophisticated instruments or involve procedures with rigorous
control of experimental conditions. It can be concluded that the developed method is suitable
for routine analysis of aminocaproic acid because of its simplicity, accuracy and sensitivity.
5. REFERENCES
1. PE Greilich, ME Jessen, N Satyanarayana, CW Whitten, GA Nuttall, JM Beckham, MH
Wall, and JF Butterworth, Anesth Analg., 2009; 109: 15-24.
2. X Liu-DeRyke and D Rhoney, Pharmacotherapy, 2008; 28: 485-495.
3. B Gunawan and B Runyon, Aliment Pharmacol Thera.,2008; 23: 115-120.
4. L Stanley, Biomed. Chroma., 1990; 4: 175-177.
5. D Phillips, I Tebbett and S Kalita, Chromatographia., 1990; 30: 309-310.
6. N El-Enany, F Belal and M Rizk, Int. J. Biomed. Sci., 2008; 4(2): 147-154.
7. AA AL-Majed, J.Pharm. Biomed. Anal., 1999; 21: 827-833.
8. K Sowjanya, J Thejaswini and B Gurupadayya, Der Pharma Chemica., 2011; 3(1):
112-122.
9. EA Gadkariem, K.E. Ibrahim and N.A. Kamil, Saudi Pharm. J., 2009; 17: 289-293.
10. EA GadKariem and M.A. Abounassif, Anal. Lett., 2000; 33: 2515-2531.
11. CS Sastry, KR Rao and DS Prasad, Microchimica Acta., 1997; 126: 167-172.
12. JC Miller and JN Miller. Statistics and Chemometrics for Analytical Chemistry (fifth