Version 12
JMP, A Business Unit of SAS SAS Campus Drive
Cary, NC 27513
The correct bibliographic citation for this manual is as follows: SAS Institute Inc. 2015. JMP® 12 Scripting Guide. Cary, NC: SAS Institute Inc.
JMP® 12 Scripting Guide
Copyright © 2015, SAS Institute Inc., Cary, NC, USA ISBN 978‐1‐62959‐482‐8 (Hardcopy)
ISBN 978‐1‐62959‐484‐2 (EPUB) ISBN 978‐1‐62959‐485‐9 (MOBI) ISBN 978‐1‐62959‐483‐5 (PDF)
All rights reserved. Produced in the United States of America.
For a hard-copy book: No part of this publication may be reproduced, stored in a retrieval system, or transmitted, in any form or by any means, electronic, mechanical, photocopying, or otherwise, without the prior written permission of the publisher, SAS Institute Inc.
For a web download or e-book: Your use of this publication shall be governed by the terms established by the vendor at the time you acquire this publication.
The scanning, uploading, and distribution of this book via the Internet or any other means without the permission of the publisher is illegal and punishable by law. Please purchase only authorized electronic editions and do not participate in or encourage electronic piracy of copyrighted materials. Your support of others’ rights is appreciated.
U.S. Government License Rights; Restricted Rights: The Software and its documentation is commercial computer software developed at private expense and is provided with
RESTRICTED RIGHTS to the United States Government. Use, duplication or disclosure of the Software by the United States Government is subject to the license terms of this
Agreement pursuant to, as applicable, FAR 12.212, DFAR 227.7202‐1(a), DFAR 227.7202‐3(a) and DFAR 227.7202‐4 and, to the extent required under U.S. federal law, the minimum restricted rights as set out in FAR 52.227‐19 (DEC 2007). If FAR 52.227‐19 is applicable, this provision serves as notice under clause (c) thereof and no other notice is required to be affixed to the Software or documentation. The Government’s rights in Software and documentation shall be only those set forth in this Agreement.
SAS Institute Inc., SAS Campus Drive, Cary, North Carolina 27513‐2414. March 2015
SAS® and all other SAS Institute Inc. product or service names are registered trademarks or trademarks of SAS Institute Inc. in the USA and other countries. ® indicates USA
Other brand and product names are trademarks of their respective companies. Technology License Notices
• Scintilla ‐ Copyright © 1998‐2014 by Neil Hodgson <[email protected]>. All Rights Reserved.
Permission to use, copy, modify, and distribute this software and its documentation for any purpose and without fee is hereby granted, provided that the above copyright notice appear in all copies and that both that copyright notice and this permission notice appear in supporting documentation.
NEIL HODGSON DISCLAIMS ALL WARRANTIES WITH REGARD TO THIS SOFTWARE, INCLUDING ALL IMPLIED WARRANTIES OF MERCHANTABILITY AND FITNESS, IN NO EVENT SHALL NEIL HODGSON BE LIABLE FOR ANY SPECIAL, INDIRECT OR CONSEQUENTIAL DAMAGES OR ANY DAMAGES WHATSOEVER RESULTING FROM LOSS OF USE, DATA OR PROFITS, WHETHER IN AN ACTION OF CONTRACT, NEGLIGENCE OR OTHER TORTIOUS ACTION, ARISING OUT OF OR IN CONNECTION WITH THE USE OR PERFORMANCE OF THIS SOFTWARE.
• Telerik RadControls: Copyright © 2002‐2012, Telerik. Usage of the included Telerik RadControls outside of JMP is not permitted.
• ZLIB Compression Library ‐ Copyright © 1995‐2005, Jean‐Loup Gailly and Mark Adler. • Made with Natural Earth. Free vector and raster map data @ naturalearthdata.com. • Packages ‐ Copyright © 2009‐2010, Stéphane Sudre (s.sudre.free.fr). All rights reserved.
Redistribution and use in source and binary forms, with or without modification, are permitted provided that the following conditions are met:
Redistributions of source code must retain the above copyright notice, this list of conditions and the following disclaimer.
Redistributions in binary form must reproduce the above copyright notice, this list of conditions and the following disclaimer in the documentation and/or other materials provided with the distribution.
Neither the name of the WhiteBox nor the names of its contributors may be used to endorse or promote products derived from this software without specific prior written permission.
THIS SOFTWARE IS PROVIDED BY THE COPYRIGHT HOLDERS AND CONTRIBUTORS “AS IS” AND ANY EXPRESS OR IMPLIED WARRANTIES, INCLUDING, BUT NOT LIMITED TO, THE IMPLIED WARRANTIES OF MERCHANTABILITY AND FITNESS FOR A PARTICULAR PURPOSE ARE
(INCLUDING, BUT NOT LIMITED TO, PROCUREMENT OF SUBSTITUTE GOODS OR SERVICES; LOSS OF USE, DATA, OR PROFITS; OR BUSINESS INTERRUPTION) HOWEVER CAUSED AND ON ANY THEORY OF LIABILITY, WHETHER IN CONTRACT, STRICT LIABILITY, OR TORT (INCLUDING NEGLIGENCE OR OTHERWISE) ARISING IN ANY WAY OUT OF THE USE OF THIS SOFTWARE, EVEN IF ADVISED OF THE POSSIBILITY OF SUCH DAMAGE.
• iODBC software ‐ Copyright © 1995‐2006, OpenLink Software Inc and Ke Jin (www.iodbc.org). All rights reserved.
Redistribution and use in source and binary forms, with or without modification, are permitted provided that the following conditions are met:
‒ Redistributions of source code must retain the above copyright notice, this list of conditions and the following disclaimer.
‒ Redistributions in binary form must reproduce the above copyright notice, this list of conditions and the following disclaimer in the documentation and/or other materials provided with the distribution.
‒ Neither the name of OpenLink Software Inc. nor the names of its contributors may be used to endorse or promote products derived from this software without specific prior written permission.
THIS SOFTWARE IS PROVIDED BY THE COPYRIGHT HOLDERS AND CONTRIBUTORS “AS IS” AND ANY EXPRESS OR IMPLIED WARRANTIES, INCLUDING, BUT NOT LIMITED TO, THE IMPLIED WARRANTIES OF MERCHANTABILITY AND FITNESS FOR A PARTICULAR PURPOSE ARE
DISCLAIMED. IN NO EVENT SHALL OPENLINK OR CONTRIBUTORS BE LIABLE FOR ANY DIRECT, INDIRECT, INCIDENTAL, SPECIAL, EXEMPLARY, OR CONSEQUENTIAL DAMAGES (INCLUDING, BUT NOT LIMITED TO, PROCUREMENT OF SUBSTITUTE GOODS OR SERVICES; LOSS OF USE, DATA, OR PROFITS; OR BUSINESS INTERRUPTION) HOWEVER CAUSED AND ON ANY THEORY OF LIABILITY, WHETHER IN CONTRACT, STRICT LIABILITY, OR TORT (INCLUDING NEGLIGENCE OR OTHERWISE) ARISING IN ANY WAY OUT OF THE USE OF THIS SOFTWARE, EVEN IF ADVISED OF THE POSSIBILITY OF SUCH DAMAGE.
• bzip2, the associated library “libbzip2”, and all documentation, are Copyright © 1996‐2010, Julian R Seward. All rights reserved.
Redistribution and use in source and binary forms, with or without modification, are permitted provided that the following conditions are met:
The origin of this software must not be misrepresented; you must not claim that you wrote the original software. If you use this software in a product, an acknowledgment in the product documentation would be appreciated but is not required.
Altered source versions must be plainly marked as such, and must not be misrepresented as being the original software.
The name of the author may not be used to endorse or promote products derived from this software without specific prior written permission.
THIS SOFTWARE IS PROVIDED BY THE AUTHOR “AS IS” AND ANY EXPRESS OR IMPLIED WARRANTIES, INCLUDING, BUT NOT LIMITED TO, THE IMPLIED WARRANTIES OF
MERCHANTABILITY AND FITNESS FOR A PARTICULAR PURPOSE ARE DISCLAIMED. IN NO EVENT SHALL THE AUTHOR BE LIABLE FOR ANY DIRECT, INDIRECT, INCIDENTAL, SPECIAL,
EXEMPLARY, OR CONSEQUENTIAL DAMAGES (INCLUDING, BUT NOT LIMITED TO,
PROCUREMENT OF SUBSTITUTE GOODS OR SERVICES; LOSS OF USE, DATA, OR PROFITS; OR BUSINESS INTERRUPTION) HOWEVER CAUSED AND ON ANY THEORY OF LIABILITY, WHETHER IN CONTRACT, STRICT LIABILITY, OR TORT (INCLUDING NEGLIGENCE OR OTHERWISE) ARISING IN ANY WAY OUT OF THE USE OF THIS SOFTWARE, EVEN IF ADVISED OF THE POSSIBILITY OF SUCH DAMAGE.
• R software is Copyright © 1999‐2012, R Foundation for Statistical Computing. • MATLAB software is Copyright © 1984‐2012, The MathWorks, Inc. Protected by U.S.
and international patents. See www.mathworks.com/patents. MATLAB and Simulink are registered trademarks of The MathWorks, Inc. See www.mathworks.com/
trademarks for a list of additional trademarks. Other product or brand names may be trademarks or registered trademarks of their respective holders.
• libopc is Copyright © 2011, Florian Reuter. All rights reserved.
Redistribution and use in source and binary forms, with or without modification, are permitted provided that the following conditions are met:
‒ Redistributions of source code must retain the above copyright notice, this list of conditions and the following disclaimer.
‒ Redistributions in binary form must reproduce the above copyright notice, this list of conditions and the following disclaimer in the documentation and / or other materials provided with the distribution.
THIS SOFTWARE IS PROVIDED BY THE COPYRIGHT HOLDERS AND CONTRIBUTORS “AS IS” AND ANY EXPRESS OR IMPLIED WARRANTIES, INCLUDING, BUT NOT LIMITED TO, THE IMPLIED WARRANTIES OF MERCHANTABILITY AND FITNESS FOR A PARTICULAR PURPOSE ARE DISCLAIMED.IN NO EVENT SHALL THE COPYRIGHT OWNER OR CONTRIBUTORS BE LIABLE FOR ANY DIRECT, INDIRECT, INCIDENTAL, SPECIAL, EXEMPLARY, OR
CONSEQUENTIAL DAMAGES (INCLUDING, BUT NOT LIMITED TO, PROCUREMENT OF SUBSTITUTE GOODS OR SERVICES; LOSS OF USE, DATA, OR PROFITS; OR BUSINESS INTERRUPTION) HOWEVER CAUSED AND ON ANY THEORY OF LIABILITY, WHETHER IN CONTRACT, STRICT LIABILITY, OR TORT (INCLUDING NEGLIGENCE OR OTHERWISE) ARISING IN ANY WAY OUT OF THE USE OF THIS SOFTWARE, EVEN IF ADVISED OF THE POSSIBILITY OF SUCH DAMAGE.
• libxml2 ‐ Except where otherwise noted in the source code (e.g. the files hash.c, list.c and the trio files, which are covered by a similar licence but with different Copyright notices) all the files are:
Copyright © 1998 ‐ 2003 Daniel Veillard. All Rights Reserved.
Permission is hereby granted, free of charge, to any person obtaining a copy of this software and associated documentation files (the “Software”), to deal in the Software without restriction, including without limitation the rights to use, copy, modify, merge, publish, distribute, sublicense, and/or sell copies of the Software, and to permit persons to whom the Software is furnished to do so, subject to the following conditions:
The above copyright notice and this permission notice shall be included in all copies or substantial portions of the Software.
Get the Most from JMP
®
Whether you are a first‐time or a long‐time user, there is always something to learn about JMP.
Visit JMP.com to find the following:
• live and recorded webcasts about how to get started with JMP • video demos and webcasts of new features and advanced techniques • details on registering for JMP training
• schedules for seminars being held in your area • success stories showing how others use JMP • a blog with tips, tricks, and stories from JMP staff • a forum to discuss JMP with other users
Contents
Scripting Guide
1
Learn about JMP
Documentation and Additional Resources . . . 21
Formatting Conventions . . . 23
JMP Documentation . . . 23
JMP Documentation Library . . . 24
JMP Help . . . 28
Additional Resources for Learning JMP . . . 28
Tutorials . . . 29
Sample Data Tables . . . 29
Learn about Statistical and JSL Terms . . . 29
Learn JMP Tips and Tricks . . . 30
Tooltips . . . 30
JMP User Community . . . 30
JMPer Cable . . . 30
JMP Books by Users . . . 31
The JMP Starter Window . . . 31
2
Introduction
Welcome to the JMP Scripting Language . . . 33What JSL Can Do for You . . . 35
Help with Learning JSL . . . 35
The Scripting Guide . . . 35
The Scripting Index . . . 36
Let JMP Teach You JSL . . . 37
Terminology . . . 38
10 Scripting Guide
3
Getting Started
Let JMP Write Your Scripts . . . 43
Capturing a Script for an Analysis Report . . . 45
Capturing a Script for a Data Table . . . 46
Capturing a Script to Import a File . . . 47
Gluing Scripts Together . . . 48
4
Scripting Tools
Using the Script Editor, Log Window, Debugger and Profiler . . . 53Using the Script Editor . . . 55
Run a Script . . . 55
Stop a Script . . . 56
Edit a Script . . . 56
Color Coding . . . 56
Auto Complete Functions . . . 56
Tooltips . . . 57
Split a Window . . . 58
Match Parentheses, Brackets, and Braces . . . 59
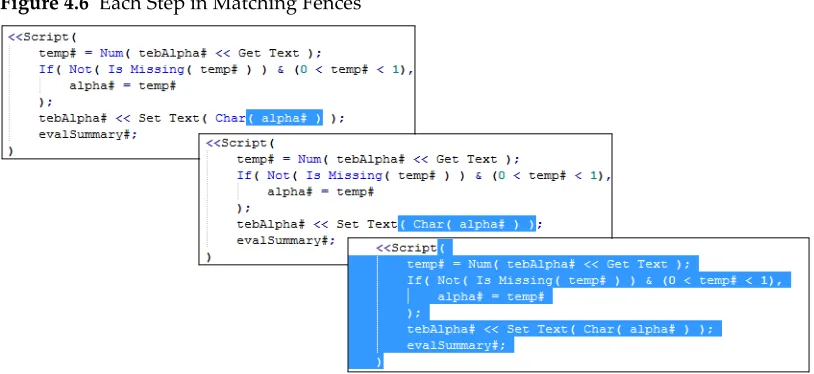
Select a Rectangular Block of Text . . . 59
Select Fragmented Text . . . 60
Drag and Drop Text . . . 60
Find and Replace . . . 61
Automatic Formatting . . . 61
Add Code Folding Markers . . . 61
Advanced Options . . . 63
Set Preferences for the Script Editor . . . 63
Working with the Log . . . 66
Show the Log in the Script Window . . . 67
Save the Log . . . 67
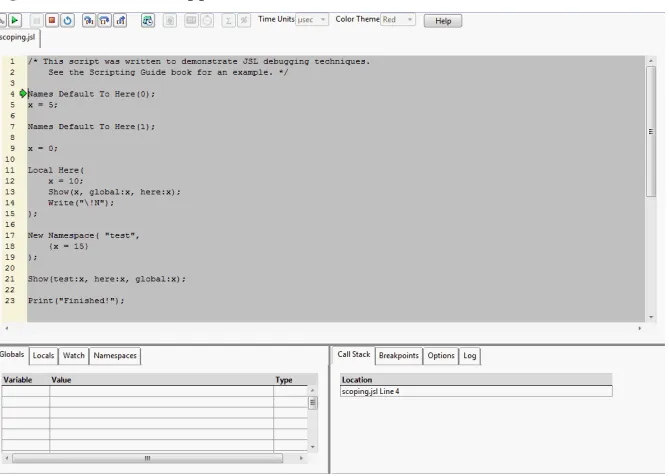
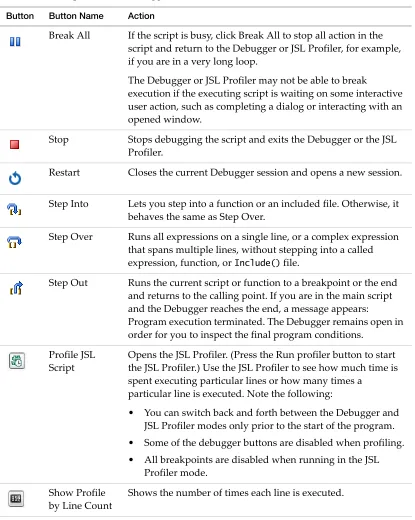
Debug or Profile Scripts . . . 68
Debugger and Profiler Window . . . 68
Work with Breakpoints . . . 72
View Variables . . . 75
Work with Watches . . . 75
Scripting Guide 11
Persistent Debugger Sessions . . . 76
Examples of Debugging and Profiling Scripts . . . 77
5
JSL Building Blocks
Learning the Basics of JSL . . . 83JSL Syntax Rules . . . 85
Value Separators . . . 85
Numbers . . . 88
Names . . . 88
Comments . . . 89
Operators . . . 90
Global and Local Variables . . . 94
Local Namespaces . . . 95
Named Namespaces . . . 95
Show Symbols, Clear Symbols, and Delete Symbols . . . 95
Lock and Unlock Symbols . . . 96
Rules for Name Resolution . . . 97
Resolving Unscoped Names . . . 97
Troubleshooting Variables and Column Names . . . 102
Troubleshooting Variables and Keywords . . . 102
Alternatives for Gluing Expressions Together . . . 104
Iterate . . . 104
For . . . 104
While . . . 106
Summation . . . 107
Product . . . 108
Break and Continue . . . 108
Conditional Functions . . . 110
If . . . 110
Match . . . 112
Choose . . . 113
Interpolate . . . 114
Step . . . 115
12 Scripting Guide
Inquiry Functions . . . 118
6
Types of Data
Working with Numbers, Strings, Dates, Currency, and More . . . 123Numbers and Strings . . . 125
Unicode Characters . . . 125
Path Variables . . . 126
Create and Customize Path Variables . . . 129
Relative Paths . . . 129
File Path Separators . . . 129
Date‐Time Functions and Formats . . . 130
Date‐Time Values . . . 130
Program with Date‐Time Functions . . . 131
Date‐Time Values in Data Tables . . . 138
Currency . . . 142
Hexadecimal and BLOB Functions . . . 143
Work with Character Functions . . . 145
Concat . . . 145
Munger . . . 146
Repeat . . . 148
Regular Expressions . . . 148
Pattern Matching . . . 158
7
Data Structures
Working with Collections of Data . . . 163Lists . . . 165
Evaluate Lists . . . 165
Assignments with Lists . . . 166
Perform Operations in Lists . . . 166
Find the Number of Items in a List . . . 166
Subscripts . . . 166
Locate Items in a List . . . 167
List Operators . . . 168
Iterate through a List . . . 172
Scripting Guide 13
Matrices . . . 173
Construct Matrices . . . 173
Subscripts . . . 174
Inquiry Functions . . . 178
Comparisons, Range Checks, and Logical Operators . . . 178
Numeric Operations . . . 179
Concatenation . . . 182
Transpose . . . 182
Matrices and Data Tables . . . 183
Matrices and Reports . . . 185
Loc Functions . . . 186
Ranking and Sorting . . . 187
Special Matrices . . . 188
Inverse Matrices and Linear Systems . . . 193
Decompositions and Normalizations . . . 196
Build Your Own Matrix Operators . . . 201
Statistical Examples . . . 201
Associative Arrays . . . 206
8
Programming Methods
Complex Scripting Techniques and Additional Functions . . . 219Lists and Expressions . . . 221
Stored expressions . . . 221
Macros . . . 231
Manipulating lists . . . 231
Manipulating expressions . . . 233
Advanced Scoping and Namespaces . . . 237
Names Default To Here . . . 238
Scoped Names . . . 240
Namespaces . . . 244
Referencing Namespaces and Scopes . . . 249
Resolving Named Variable References . . . 253
Best Practices for Advanced Scripting . . . 254
Advanced Programming Concepts . . . 255
14 Scripting Guide
Functions . . . 256
Recursion . . . 258
Includes . . . 258
Loading and Saving Text Files . . . 259
Scripting BY Groups . . . 259
Organize Files into Projects . . . 260
Encrypt and Decrypt Scripts . . . 260
Additional Numeric Operators . . . 263
Derivatives . . . 263
Algebraic Manipulations . . . 265
Maximize and Minimize . . . 266
Scheduling Actions . . . 268
Functions that Communicate with Users . . . 269
Writing to the Log . . . 269
Send information to the User . . . 270
9
Data Tables
Working with Data Table Objects . . . 275Get Started . . . 277
Basic Data Table Scripting . . . 279
Open a Data Table . . . 279
Create a New Data Table . . . 281
Import Data . . . 282
Set the Current Data Table . . . 290
Name a Data Table . . . 290
Save a Data Table . . . 291
Hide a Data Table . . . 291
Advanced Data Table Scripting . . . 296
Columns . . . 313
Rows . . . 334
Accessing Data Values . . . 360
Add Metadata to a Data Table . . . 362
Scripting Guide 15
10
Scripting Platforms
Create, Repeat, and Modify Analyses . . . 369
Overview . . . 371
Scripting Analysis Platforms . . . 372
Launching Platforms Interactively and Obtaining the Equivalent Script . . . 373
Launch a Platform . . . 373
Save Script . . . 373
Make Some Changes . . . 374
Syntax for Platform Scripting . . . 375
BY Group Reports . . . 375
Saving BY Group Scripts . . . 378
Sending Script Commands to a Live Analysis . . . 378
Conventions for Commands and Arguments . . . 379
Sending Several Messages . . . 380
Learning the Messages an Object Responds to . . . 381
How to Interpret the Listing from Show Properties . . . 381
Launching Platforms . . . 382
Specifying Columns . . . 382
Platform Action Command . . . 384
Invisible Reports . . . 384
Report Titles . . . 385
General Messages for Platform Windows . . . 385
Additional Notes . . . 389
Supercategories in Categorical . . . 389
Spline Fits . . . 390
Fit Model Effects . . . 390
Fit Model Send Command . . . 392
DOE Scripting . . . 392
Scatterplot Scripting . . . 394
Process Capability Scripting . . . 394
Control Charts . . . 395
11
Display Trees
Create and Use Windows . . . 40116 Scripting Guide
Introduction to Display Boxes . . . 403
Display Box Object References . . . 408
Sending Messages . . . 411
How to Access Built‐in Windows . . . 420
Using the Pick Windows . . . 421
Files in Directory . . . 422
Constructing Display Trees . . . 423
Basics . . . 423
Updating an Existing Display . . . 425
Interactive Display Elements . . . 428
Modal and Non‐Modal Windows . . . 433
Send Messages to Constructed Displays . . . 451
Build Your Own Displays from Scratch . . . 452
Construct Display Boxes Containing Platforms . . . 452
Construct a Custom Platform . . . 455
Sheets . . . 458
Journals . . . 460
Picture Display Type . . . 461
Modal Windows . . . 461
Constructing Modal Windows . . . 462
General‐Purpose Modal Window . . . 462
Convert Deprecated Dialog to New Window . . . 463
Comparison of Dialog and New Window . . . 468
Constructing Dialogs and Column Dialogs . . . 474
Scripting the Script Editor . . . 477
Syntax Reference . . . 478
12
Scripting Graphs
Create and Edit 2-Dimensional Plots . . . 487Adding Scripts to Graphs . . . 489
Ordering Graphics Elements Using JSL . . . 490
Adding a Legend to a Graph . . . 495
Creating New Graphs From Scratch . . . 495
Scripting Guide 17
Graphing Elements . . . 498
Plotting Functions . . . 498
Getting the Properties of a Graphics Frame . . . 503
Adding a Legend . . . 503
Drawing Lines, Arrows, Points, and Shapes . . . 504
Lines . . . 504
Arrows . . . 506
Markers . . . 507
Pies and Arcs . . . 509
Regular Shapes: Circles, Rectangles, and Ovals . . . 510
Irregular Shapes: Polygons and Contours . . . 513
Adding text . . . 515
Colors . . . 516
Transparency . . . 518
Fill patterns . . . 519
Line types . . . 519
Drawing With Pixels . . . 520
Interactive graphs . . . 521
Handle . . . 521
MouseTrap . . . 524
Drag Functions . . . 525
Troubleshooting . . . 527
Creating Background Maps . . . 527
13
Three-Dimensional Scenes
Scripting in Three Dimensions . . . 531About JSL 3‐D Scenes . . . 533
JSL 3‐D Scene Boxes . . . 533
Setting the Viewing Space . . . 536
Setting Up a Perspective Scene . . . 537
Setting up an Orthographic Scene . . . 538
Changing the View . . . 539
The Translate Command . . . 539
The Rotate Command . . . 539
18 Scripting Guide
The ArcBall . . . 542
Graphics Primitives . . . 543
Primitives Example . . . 546
Controlling the Appearance of Primitives . . . 547
Other uses of Begin and End . . . 553
Drawing Spheres, Cylinders, and Disks . . . 553
Drawing Text . . . 555
Using the Matrix Stack . . . 556
Lighting and Normals . . . 559
Creating Light Sources . . . 559
Lighting Models . . . 561
Normal Vectors . . . 562
Shading Model . . . 562
Material Properties . . . 563
Alpha Blending . . . 564
Fog . . . 564
Example . . . 564
Bézier Curves . . . 566
Using the Mouse . . . 569
Arguments . . . 571
14
Extending JMP
External Data Sources, Analytical Tools, and Automation . . . 573Real‐Time Data Capture . . . 575
Create a Datafeed Object . . . 575
Read in Real‐Time Data . . . 576
Manage a Datafeed with Messages . . . 577
Dynamic Link Libraries (DLLs) . . . 581
Using Sockets in JSL . . . 584
Database Access . . . 587
Working with SAS . . . 590
Make a SAS DATA Step . . . 590
Create SAS DATA Step Code for Formula Columns . . . 590
Scripting Guide 19
Get the Values of SAS Macro Variables . . . 591
Connect to a SAS Metadata Server . . . 592
Preferences . . . 595
Sample Scripts . . . 595
Working with MATLAB . . . 596
Installing MATLAB . . . 597
Working with R . . . 598
Installing R . . . 598
JMP to R Interfaces . . . 600
R JSL Scriptable Object Interfaces . . . 600
Conversion Between JMP Data Types and R Data Types . . . 600
Troubleshooting . . . 603
Examples . . . 604
Working with Excel . . . 605
Parsing XML . . . 606
OLE Automation . . . 608
Automating JMP through Visual Basic . . . 608
Automating JMP through Visual C++ . . . 616
15
Creating and Sharing Applications
Application Builder and Add-In Builder . . . 621Application Builder . . . 623
Example . . . 623
Application Builder Terminology . . . 625
Design an Application . . . 627
Application Builder Window . . . 627
Red Triangle Options . . . 629
Create an Application . . . 630
Edit or Run an Application . . . 642
Options for Saving Applications . . . 642
JMP Add‐Ins . . . 646
Create an Add‐In Using Add‐In Builder . . . 646
Edit an Add‐In . . . 650
Remove an Add‐In from the Add‐Ins Menu . . . 650
20 Scripting Guide
Share an Add‐In . . . 651
Register an Add‐In Using JSL . . . 652
Create an Add‐In Manually . . . 652
16
Common Tasks
Getting Started with Sample Scripts . . . 655Run a Script at Start Up . . . 657
Convert Character Dates to Numeric Dates . . . 657
Format Date/Time Values and Subset Data . . . 659
Create a Formula Column . . . 660
Extract Values from an Analysis into a Report . . . 661
Create an Interactive Program . . . 664
A
Compatibility Notes
Changes in Scripting from JMP 11 to JMP 12 . . . 669Compatibility Issues . . . 669
Deprecated JSL . . . 671
B
Glossary
Terms, Concepts, and Placeholders . . . 673Chapter
1
Learn about JMP
Documentation and Additional Resources
This chapter includes the following information: • book conventions
• JMP documentation • JMP Help
• additional resources, such as the following: ‒ other JMP documentation
[image:21.540.92.461.347.621.2]‒ tutorials ‒ indexes ‒ Web resources
Contents
Chapter 1 Learn about JMP 23
Scripting Guide Formatting Conventions
Formatting Conventions
The following conventions help you relate written material to information that you see on your screen.
• Sample data table names, column names, pathnames, filenames, file extensions, and folders appear in Helvetica font.
• Code appears in Lucida Sans Typewriter font.
• Code output appears in Lucida Sans Typewriter italic font and is indented farther than the preceding code.
• Helvetica bold formatting indicates items that you select to complete a task: ‒ buttons
‒ check boxes ‒ commands
‒ list names that are selectable ‒ menus
‒ options ‒ tab names ‒ text boxes
• The following items appear in italics:
‒ words or phrases that are important or have definitions specific to JMP ‒ book titles
‒ variables ‒ script output
• Features that are for JMP Pro only are noted with the JMP Pro icon . For an overview of JMP Pro features, visit http://www.jmp.com/software/pro/.
Note: Special information and limitations appear within a Note.
Tip: Helpful information appears within a Tip.
JMP Documentation
24 Learn about JMP Chapter 1
JMP Documentation Scripting Guide
• Open the PDF versions from the Help > Books menu or from the JMP online Help footers. • All books are also combined into one PDF file, called JMP Documentation Library, for
convenient searching. Open the JMP Documentation Library PDF file from the Help > Books menu.
• e‐books are available at online retailers. Visit http://www.jmp.com/support/downloads/ documentation.shtml for details.
• You can also purchase printed documentation on the SAS website: http://support.sas.com/documentation/onlinedoc/jmp/index.html
JMP Documentation Library
The following table describes the purpose and content of each book in the JMP library.
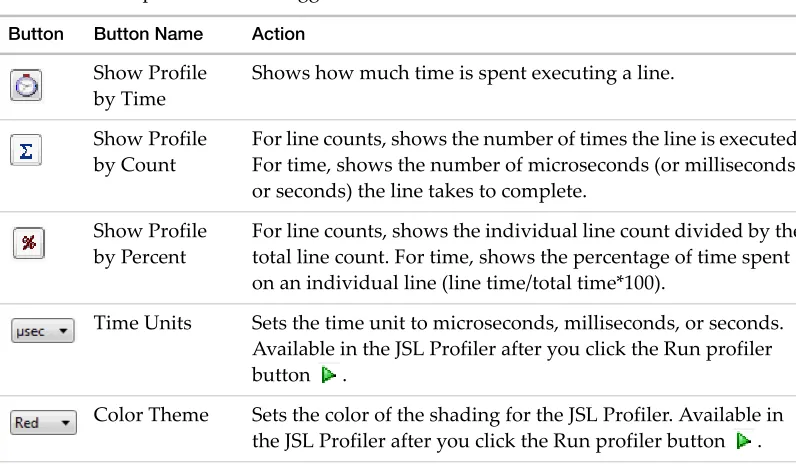
Document Title Document Purpose Document Content
Discovering JMP If you are not familiar with JMP, start here.
Introduces you to JMP and gets you started creating and analyzing data. Using JMP Learn about JMP data
tables and how to perform basic operations.
Covers general JMP concepts and features that span across all of JMP, including importing data, modifying columns properties, sorting data, and connecting to SAS.
Basic Analysis Perform basic analysis using this document.
Describes these Analyze menu platforms: • Distribution
• Fit Y by X • Matched Pairs • Tabulate
Chapter 1 Learn about JMP 25
Scripting Guide JMP Documentation
Essential Graphing Find the ideal graph for your data.
Describes these Graph menu platforms: • Graph Builder
• Overlay Plot • Scatterplot 3D • Contour Plot • Bubble Plot • Parallel Plot • Cell Plot • Treemap
• Scatterplot Matrix • Ternary Plot • Chart
The book also covers how to create background and custom maps. Profilers Learn how to use
interactive profiling tools, which enable you to view cross‐sections of any response surface.
Covers all profilers listed in the Graph menu. Analyzing noise factors is
included along with running simulations using random inputs.
Design of
Experiments Guide
Learn how to design experiments and determine appropriate sample sizes.
Covers all topics in the DOE menu and the Screening menu item in the Analyze > Modeling menu.
26 Learn about JMP Chapter 1
JMP Documentation Scripting Guide
Fitting Linear Models Learn about Fit Model platform and many of its personalities.
Describes these personalities, all available within the Analyze menu Fit Model platform:
• Standard Least Squares • Stepwise
• Generalized Regression • Mixed Model
• MANOVA • Loglinear Variance • Nominal Logistic • Ordinal Logistic
• Generalized Linear Model Specialized Models Learn about additional
modeling techniques.
Describes these Analyze > Modeling menu platforms:
• Partition • Neural
• Model Comparison • Nonlinear
• Gaussian Process • Time Series
• Response Screening
The Screening platform in the Analyze > Modeling menu is described in Design of Experiments Guide.
Multivariate Methods
Read about techniques for analyzing several variables
simultaneously.
Describes these Analyze > Multivariate Methods menu platforms:
• Multivariate • Cluster
• Principal Components • Discriminant
• Partial Least Squares
Chapter 1 Learn about JMP 27
Scripting Guide JMP Documentation
Quality and Process Methods
Read about tools for evaluating and improving processes.
Describes these Analyze > Quality and Process menu platforms:
• Control Chart Builder and individual control charts
• Measurement Systems Analysis • Variability / Attribute Gauge Charts • Process Capability
• Pareto Plot • Diagram Reliability and
Survival Methods
Learn to evaluate and improve reliability in a product or system and analyze survival data for people and products.
Describes these Analyze > Reliability and Survival menu platforms:
• Life Distribution • Fit Life by X
• Recurrence Analysis
• Degradation and Destructive Degradation
• Reliability Forecast • Reliability Growth • Reliability Block Diagram • Survival
• Fit Parametric Survival • Fit Proportional Hazards Consumer Research Learn about methods
for studying consumer preferences and using that insight to create better products and services.
Describes these Analyze > Consumer Research menu platforms:
• Categorical
• Multiple Correspondence Analysis • Factor Analysis
• Choice • Uplift • Item Analysis
28 Learn about JMP Chapter 1
Additional Resources for Learning JMP Scripting Guide
Note: The Books menu also contains two reference cards that can be printed: The Menu Card describes JMP menus, and the Quick Reference describes JMP keyboard shortcuts.
JMP Help
JMP Help is an abbreviated version of the documentation library that provides targeted information. You can open JMP Help in several ways:
• On Windows, press the F1 key to open the Help system window.
• Get help on a specific part of a data table or report window. Select the Help tool from the Tools menu and then click anywhere in a data table or report window to see the Help for that area.
• Within a JMP window, click the Help button.
• Search and view JMP Help on Windows using the Help > Help Contents, Search Help, and
Help Index options. On Mac, select Help > JMP Help.
• Search the Help at http://jmp.com/support/help/ (English only).
Additional Resources for Learning JMP
In addition to JMP documentation and JMP Help, you can also learn about JMP using the following resources:
• Tutorials (see “Tutorials” on page 29)
• Sample data (see “Sample Data Tables” on page 29)
• Indexes (see “Learn about Statistical and JSL Terms” on page 29) Scripting Guide Learn about taking
advantage of the powerful JMP Scripting Language (JSL).
Covers a variety of topics, such as writing and debugging scripts, manipulating data tables, constructing display boxes, and creating JMP applications.
JSL Syntax Reference Read about many JSL functions on functions and their arguments, and messages that you send to objects and display boxes.
Includes syntax, examples, and notes for JSL commands.
Chapter 1 Learn about JMP 29
Scripting Guide Additional Resources for Learning JMP
• Tip of the Day (see “Learn JMP Tips and Tricks” on page 30) • Web resources (see “JMP User Community” on page 30)
• JMPer Cable technical publication (see “JMPer Cable” on page 30) • Books about JMP (see “JMP Books by Users” on page 31)
• JMP Starter (see “The JMP Starter Window” on page 31)
Tutorials
You can access JMP tutorials by selecting Help > Tutorials. The first item on the Tutorials menu is Tutorials Directory. This opens a new window with all the tutorials grouped by category. If you are not familiar with JMP, then start with the Beginners Tutorial. It steps you through the JMP interface and explains the basics of using JMP.
The rest of the tutorials help you with specific aspects of JMP, such as creating a pie chart, using Graph Builder, and so on.
Sample Data Tables
All of the examples in the JMP documentation suite use sample data. Select Help > Sample Data Library to do the following actions to open the sample data directory.
To view an alphabetized list of sample data tables or view sample data within categories, select Help > Sample Data.
Sample data tables are installed in the following directory:
On Windows: C:\Program Files\SAS\JMP\<version_number>\Samples\Data
On Macintosh: \Library\Application Support\JMP\<version_number>\Samples\Data
In JMP Pro, sample data is installed in the JMPPRO (rather than JMP) directory. In JMP Shrinkwrap, sample data is installed in the JMPSW directory.
Learn about Statistical and JSL Terms
The Help menu contains the following indexes:
Statistics Index Provides definitions of statistical terms.
30 Learn about JMP Chapter 1
Additional Resources for Learning JMP Scripting Guide
Learn JMP Tips and Tricks
When you first start JMP, you see the Tip of the Day window. This window provides tips for using JMP.
To turn off the Tip of the Day, clear the Show tips at startup check box. To view it again, select
Help > Tip of the Day. Or, you can turn it off using the Preferences window. See the Using JMP book for details.
Tooltips
JMP provides descriptive tooltips when you place your cursor over items, such as the following:
• Menu or toolbar options • Labels in graphs
• Text results in the report window (move your cursor in a circle to reveal) • Files or windows in the Home Window
• Code in the Script Editor
Tip: You can hide tooltips in the JMP Preferences. Select File > Preferences > General (or JMP > Preferences > General on Macintosh) and then deselect Show menu tips.
JMP User Community
The JMP User Community provides a range of options to help you learn more about JMP and connect with other JMP users. The learning library of one‐page guides, tutorials, and demos is a good place to start. And you can continue your education by registering for a variety of JMP training courses.
Other resources include a discussion forum, sample data and script file exchange, webcasts, and social networking groups.
To access JMP resources on the website, select Help > JMP User Community.
JMPer Cable
The JMPer Cable is a yearly technical publication targeted to users of JMP. The JMPer Cable is available on the JMP website:
Chapter 1 Learn about JMP 31
Scripting Guide Additional Resources for Learning JMP
JMP Books by Users
Additional books about using JMP that are written by JMP users are available on the JMP website:
http://www.jmp.com/support/books.shtml
The JMP Starter Window
The JMP Starter window is a good place to begin if you are not familiar with JMP or data analysis. Options are categorized and described, and you launch them by clicking a button. The JMP Starter window covers many of the options found in the Analyze, Graph, Tables, and
File menus.
• To open the JMP Starter window, select View (Window on the Macintosh) > JMP Starter. • To display the JMP Starter automatically when you open JMP on Windows, select File >
32 Learn about JMP Chapter 1
Chapter
2
Introduction
Welcome to the JMP Scripting Language
The JMP Scripting Language, or JSL, lets you write scripts to recreate results in JMP. Power users often develop scripts to extend JMP’s functionality and automate a regularly scheduled analysis in production settings. If you do not want to learn JSL, JMP can write the scripts for you.
JSL is used to perform many actions: • implements column formulas • launches platforms
Contents
Chapter 2 Introduction 35
Scripting Guide What JSL Can Do for You
What JSL Can Do for You
JMP can automatically save scripts to reproduce any data table or analysis in its current state. You can pause any time in your analysis to save a script to a script window (or script editor), in a data table, or in an analysis report. You can then modify the script as needed for future projects. When you are finished with your work, you can then save a script to reproduce your final results.
Here are some examples where JSL scripts can be helpful:
• Suppose you need to describe an analysis process in detail, from beginning to end. An example is to create an audit trail for a governing agency, or for peers reviewing your journal article.
• Suppose you have a set of analysis steps that should be followed routinely by your lab technicians.
• Suppose you fit the same model to new data every day, and the steps are always the same. You can use JMP interactively as usual, save scripts to reproduce your work, and in the future run those scripts to reproduce your results.
There are a few things that JSL is not designed to do:
• JMP cannot record scripts while you are working. Though script‐recording is a useful feature in some other scripting languages, it is less important for software like JMP, where the results are what matter. You cannot use script‐recording to observe how a sequence of interactive steps is performed.
• JSL is not an alternative command‐line interface for using the program.
Help with Learning JSL
There are several places within JMP to get help with writing or understanding a JSL script.
The Scripting Guide
The Scripting Guide book begins with basic information (such as terminology and syntax) for JMP users who are not familiar with the scripting language. The book progresses to more advanced information.
36 Introduction Chapter 2
Help with Learning JSL Scripting Guide
The Scripting Index
The Scripting Index on the Help menu provides a brief description and the syntax for JSL functions, objects, and display boxes. Each entry includes an example that you can run and modify to test your own code. And an embedded log window lets you see messages as examples are run.
The Scripting Index window includes the following buttons: Click the Search button to begin the search.
Click the Clear button to clear the search text box to begin a new search. Click the Settings button to set search types and parameters. Several types of searches are available from the Settings button:
Partial Match returns all entries that contain at least a part of the “string” for example, a search for “leas” will return messages such as “Release Zoom” and “Partial Least Squares”. This option is the default search type.
Chapters 5 through 8 Introduces the building blocks of the language; working with basic data types, such as numbers and strings; writings lists, matrices, and associate arrays; namespaces; and the fundamentals of programming in JSL.
Chapters 9 through 13 Covers using JSL with objects in JMP, such as data tables, platforms, windows, and graphics.
Chapter 14 Describes how to write scripts that work with external programs, such as SAS, R, and Excel.
Chapter 15 Introduces creating JMP applications in Application Builder, a drag‐and‐drop environment for visually designing windows with buttons, lists, graphs, and other objects. The chapter also describes how to use Add‐In Builder to compile scripts into one easily shared file.
Chapter 16 Contains a collection of recipes, or script examples, that you can copy and modify for your own use.
Chapter 2 Introduction 37
Scripting Guide Help with Learning JSL
Exact Phrase returns entries that contain the exact string, for example, a search for “text” will return all elements that contain the “text” string.
All Terms returns entries that contain either or both strings, for example, a search for “t test” will return all elements that contain either or both of the search strings, “Pat Test”, “Shortest Edit Script” and “Paired t test”.
Any Term returns entries that contain either of the search strings, for example, a search for “text string” returns “Context Box”, “Drag Text”, and “Is String”.
Regular Expression allows you to use the wildcard (*) and period (.) in the search box, for example, searching for “get *name” returns messages such as “Get Name Info” and “Get Namespace”. Searching for “get.*name” returns items such as “Get Color Theme Names”, “Get Name Info”, and “Get Effect Names”.
Several search parameters are also available from the Settings button:
All Fields specifies that JMP search all fields in the index for the search string. Titles Only specifies that JMP search only index titles for the search string.
Examples Only specifies that JMP search only index examples for the search string. Without Examples specifies that JMP exclude examples from the search.
Click an item’s Topic Help button to read more about the item in JMP’s online Help system.
Let JMP Teach You JSL
The best JSL writer is JMP. You can work in JMP interactively and then save the results as a script to reuse later. With simple modifications, your script can serve as a template for speeding up routine tasks.
Because JSL is a very flexible language, you can reach your goals in many different ways. Here is an example. Typically, the script that JMP saves for you specifies every detail of your analysis, even if most of the details happen automatically by default. Does that mean that the scripts that you write have to be just as complete and detailed? Not at all. You usually need to specify only those details that you would select in the graphical user interface (GUI). For example, if you open Big Class.jmp from the sample data folder and want to launch Distribution for height, weight, and sex, the following script is all that is necessary:
Distribution( Y( :height, :weight, :sex ) );
Suppose you run the Distribution platform in the GUI and then select Script > Save Script to Script Window from the red triangle menu for the report. The following script appears:
Distribution(
38 Introduction Chapter 2
Terminology Scripting Guide
);
Both scripts give the same result.
Feel free to experiment with JSL. If you think something ought to be possible, it probably is. Give it a try, and see what happens.
Terminology
Before you begin creating scripts, you should become familiar with basic JSL terms used throughout this book.
Operators and Functions
An operator is one‐ or two‐character symbol (such as + or =) for common arithmetic actions. A function is a command that might contain additional information for the function to use. Certain JSL functions work the same as operators but provide access to more complex actions. For example, the following two lines are equivalent:
2 + 3; Add( 2, 3 );
The first line uses the + operator. The second line uses the Add() function equivalent. Although all JSL operators have function equivalents, not all functions have operator equivalents. For example, Sqrt(a) can be represented only by the Sqrt() function.
Note: In previous versions of JMP and its documentation, the terms operators and functions were used interchangeably. Now each term has a specific meaning.
Objects and Messages
An object is a dynamic entity in JMP, such as a data table, a data column, a platform results window, a graph, and so on. Most objects can receive messages that instruct the object to perform some action on itself.
A message is a JSL expression that is directed to an object. That object knows how to evaluate the message. In the following example, dt is the data table object. << indicates that a message follows. In the following example, the message tells JMP to create a summary table with the specified variables.
dt << Summary( Group( :age ), Mean( :height ) )
Chapter 2 Introduction 39
Scripting Guide Terminology
references. Here are some of the more common names used in this book to represent references to certain objects:
These variables are not pre‐assigned references. Each one must be assigned prior to its use. In the following example, the global variable named A is assigned the value “Hello, World”. When the Show( A ) command is processed, the result is the value of A.
A = "Hello, World"; Show( A );
A = "Hello, World";
Arguments and Parameters
An argument is additional information that you can provide to a function or message. For example, in Root(25), 25 is an argument to the Root() function. Root() acts on the argument that you provide and returns the result: 5.
Programming and scripting books commonly talk about parameters as well. A parameter is a description of the argument that a function accepts. For example, the general specification for
Root() might be Root( number ), where number is the parameter.
Parameter and argument express two perspectives of the same concept: information that a function needs.
For simplicity in this book, we use the word argument in both cases.
A named argument is an optional argument that you select from a predetermined set and explicitly define. For example, title("My Line Graph") in the Graph Box() function is a named argument because the title is explicitly defined as such.
Graph Box( title("My Line Graph"), Frame Size( 300, 500 ),
Marker( Marker State( 3 ), [11 44 77], [75 25 50] ); Pen Color( "Blue" );
Line( [10 30 70], [88 22 44] ));
Abbreviation Object
dt data table
col column in a data table
colname the name of a column in a data table
obj an object
40 Introduction Chapter 2
Terminology Scripting Guide
Note that the Frame Size() arguments 300 and 500 are not named. The position of these arguments implies meaning; the first argument is always the width, the second argument is always the height.
Optional Arguments
Functions and messages require certain arguments, and other arguments are optional. You can include them, but you do not have to. In specifications, optional arguments are enclosed in angle brackets. For example:
Root( x, <n> )
The x argument is required. The n argument is optional.
Optional arguments often have a default value. For example, for Root(), the default value of n is 2:
Expressions
An expression is a section of JSL code that accomplishes a task. JSL expressions hold data, manipulate data, and send commands to objects. For example, the following expression opens the Big Class.jmp sample data table and creates a Bivariate graph:
Open( "$SAMPLE_DATA/Big Class.JMP" ); Bivariate( Y( :weight ), X( :height ) );
Or and the Vertical Bar Symbol
A single vertical bar (|) represents a logical OR. For brevity, | represents the word or when referring to alternative values.
For example, a pathname can be either absolute or relative. When you see an argument such as absolute|relative, this means that you enter either one of the following two options:
• absolute indicates an absolute pathname.
• relative indicates a relative pathname.
More than two options can also be strung together with a vertical bar in this way.
Code Output Explanation
Chapter 2 Introduction 41
Scripting Guide Basic JSL Syntax
Script Formatting
Whitespace characters (such as spaces, tabs, and newlines) and capitalization are ignored in JSL. This means that the following two expressions are equivalent:
// Expression 1
sum=0; for(i=1,i<=10,i++,sum+=i;show(i,sum))
// Expression 2 Sum = 0;
For( i = 1, i <= 10, i++, Sum += i;
Show( i, Sum ); );
You can format your script in any way that you like. However, the script editor can also format your script for you. This book uses the script editor’s default formatting for capitalization, spaces, returns, tabs, and so on. See “Using the Script Editor” on page 55 in the “Scripting Tools” chapter for details about using the script editor.
Note: The only white space exception is two‐character operators (such as <= or ++). The operators cannot be separated by a space.
Basic JSL Syntax
A JSL script is a series of expressions. Each expression is a section of JSL code that accomplishes a task. JSL expressions hold data, manipulate data, and send commands to objects.
Many expressions are nested message names, with message contents enclosed in parentheses: Message Name ( argument 1, argument 2, ... )
The meaning of JSL names depends on the context. The same name might mean one thing in a data table context and something entirely different in a function context. See “Rules for Name Resolution” on page 97 in the “JSL Building Blocks” chapter for more information.
Almost anything that follows certain punctuation rules, such as matching parentheses, is a valid JSL expression. For example:
New Window( "A Window", << modal,
Text box( "Hello, World" ), Text Box( "---" ),
42 Introduction Chapter 2
Basic JSL Syntax Scripting Guide
Notice the following:
• Names can have embedded spaces. See “Names” on page 88 in the “JSL Building Blocks” chapter for more information.
• Message contents are enclosed in parentheses, which must be balanced. See “Parentheses” on page 85 in the “JSL Building Blocks” chapter.
• Items are separated by commas. See “Commas” on page 85 in the “JSL Building Blocks” chapter.
Chapter
3
Getting Started
Let JMP Write Your Scripts
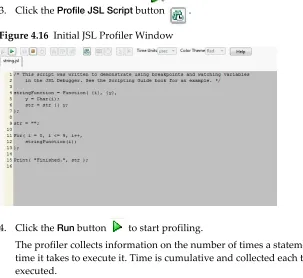
You often have to produce the same reports for the same data on a regular basis. This chapter shows you how to let JMP write scripts for common tasks like importing text data, opening Excel files, and producing reports. A final tutorial shows you how to put it all together into a single script to open an Excel file and produce three reports automatically.
Contents
Chapter 3 Getting Started 45
Scripting Guide Capturing a Script for an Analysis Report
Capturing a Script for an Analysis Report
The basic steps for capturing a script to reproduce an analysis are as follows: 1. Launch a platform, such as Distribution.
2. Make any changes or additions that you need. For example, add tests and other graphs. 3. Capture the script to recreate your results.
You can save the script in the data table, so that if you send the data table to others, they can run your script and duplicate your reports.
Example
Follow these steps to produce a distribution report, capture the script to reproduce it, and save it to the data table.
Note: The data tables that you use in examples are located in JMP’s Samples/Data folder. 1. Select Help > Sample Data Library and open the Companies.jmp.
2. Select Analyze > Distribution to open the Distribution launch window. 3. Select Profits ($M) in the Select Columns box and click the Y, Columns button. 4. Click OK.
The Distribution report window appears.
5. From the red triangle menu next to Distributions, select Stack to make your report horizontal.
6. From the red triangle menu next to Profits ($M), deselect Outlier Box Plot to turn the option off.
7. From the red triangle menu next to Profits ($M), select Test Mean. The Test Mean window appears.
8. Type 500 in the Specify Hypothesized Mean box. 9. Click OK.
46 Getting Started Chapter 3
Capturing a Script for a Data Table Scripting Guide
Figure 3.1 Customized Distribution Report
10. From the red triangle menu next to Distributions, select Script > Save Script to Data Table. Your data table now has a script named Distribution saved to it. From the red triangle menu for the script, select Edit to see the script.
Figure 3.2 Distribution Script Saved to the Data Table
11. To run the script and reproduce your final report exactly, select Run Script from the red triangle menu for the script.
Capturing a Script for a Data Table
The basic steps for capturing a script to reproduce a data table are as follows: 1. Open the data table.
Chapter 3 Getting Started 47
Scripting Guide Capturing a Script to Import a File
3. Capture the script to recreate your data table. Example
Use the data table from the previous example, where you saved a script to it. 1. In the data table, select the red triangle next to the data table’s name. 2. Select Copy Table Script.
Figure 3.3 Copy the Table Script
3. Open a script window by selecting File > New > Script. 4. Select Edit > Paste.
You now have a script that duplicates your data table. You can save this script and run it at any time to recreate your data table, with all its scripts attached.
Capturing a Script to Import a File
To capture a script that imports a file, you open the file in JMP. JMP automatically records the steps that occurred when you opened the file.
Import a Text File 1. Select File > Open.
The Open Data File window appears.
2. Select Text Files from the list next to File name. 3. In the Open as section, select Data, using best guess.
48 Getting Started Chapter 3
Gluing Scripts Together Scripting Guide
4. Browse to select the file, and then select Open.
The file is opened as a data table. The data table includes a script named Source. This JSL script imports your text file with the text import rules that you used.
5. From the red triangle menu for Source, select Edit.
You can copy this script, paste it into a new script window, and save it. Then you can run this script later to reimport the text file.
Tip: The import script is an Open() expression that specifies the text file and the import options to correctly import the file into JMP. The first part of this expression is the pathname to the specific file that you imported. If you save this script and want to run it a different place, you might need to edit the pathname so that it points to the text file. Pathnames are discussed in greater detail in “Path Variables” on page 126 in the “Types of Data” chapter.
Gluing Scripts Together
Suppose new data is saved out to an Excel file once a week, and you need to produce the same reports every week. You could open the file and perform the same steps every week. However, creating a script that imports the new Excel file into JMP and runs all analyses automatically is more efficient. The following example shows you how to set up your script and run it each week.
Import the Microsoft Excel File
1. Open a new script window (File > New > Script).
2. In your script window, enter the Open() expression to open the Solubil.xls sample import data file. The file is located in JMP’s Samples/Import Data folder.
Open( "$SAMPLE_IMPORT_DATA/Solubil.xls" );
Be sure to put the semicolon at the end of this expression, because you will add more expressions. The semicolon glues expressions together.
3. Run your script to import the Excel file by selecting Edit > Run Script. The Excel file opens as a data table.
Chapter 3 Getting Started 49
Scripting Guide Gluing Scripts Together
Run Your Reports and Capture Their Scripts
You have three reports to produce: a distribution report, a 3D scatterplot, and a multivariate report. Perform each one using the GUI, and add its script to the script window.
1. With your new data table open, select Analyze > Distribution. 2. Select all the columns except Labels and click Y, Columns. 3. Click OK.
4. Hold down CTRL and select Histogram Options > Show Counts from the red triangle menu for eth.
Bar counts are added to all six histograms.
5. In the Distribution window, select Script > Copy Script from the red triangle menu next to Distributions.
6. Place your cursor in the script window a line or two after your Open() expression and select Edit > Paste.
7. Type a semicolon after the last close parenthesis. 8. Select Graph > Scatterplot 3D.
9. Select all the columns except Labels and click Y, Columns. 10. Click OK.
11. Copy and paste the script for Scatterplot 3D into the script window just like you did for your Distribution report. Be sure to add the semicolon at the end.
12. Select Analyze > Multivariate Methods > Multivariate. 13. Select all the columns except Labels and click Y, Columns. 14. Click OK.
50 Getting Started Chapter 3
Gluing Scripts Together Scripting Guide
Figure 3.4 The Completed Script
Save the Script
You now have a script that reproduces all of the steps that you performed manually. Save the script, and close your data table and all its report windows.
1. In the script window that contains your script, select File > Save or File > Save As. 2. Specify a filename (for example, Weekly Report).
3. Click Save.
Run the Script
As long as your weekly updated Excel file is saved in the same place and contains the same columns, you can run your script and automatically produce all your reports.
1. Open the script that you saved. 2. Select Edit > Run Script.
Your Excel file is opened in JMP, and all three of your reports appear.
You can send this script to others. As long as they have access to the same Excel file in the same location, they can also run the script in JMP and see your reports.
Advanced Note: Auto‐Submit
If you want a particular script to always be executed instead of opened into the script window, put the following command on the first line of the script:
//!
Chapter 3 Getting Started 51
Scripting Guide Gluing Scripts Together
You can override this command when opening the file. 1. Select File > Open.
2. Hold the CTRL key while you select the JSL file and click Open. The script opens into a script window instead of being executed.
The command is also ignored when you right‐click the file in the Home Window and select
52 Getting Started Chapter 3
Chapter
4
Scripting Tools
Using the Script Editor, Log Window, Debugger and Profiler
[image:53.540.96.497.257.616.2]Contents
Chapter 4 Scripting Tools 55
Scripting Guide Using the Script Editor
Using the Script Editor
[image:55.540.89.422.195.436.2]The script editor provides a friendly environment for writing and reading JSL scripts. Figure 4.2 shows basic features such as syntax coloring, inline commenting, and automatic formatting. Other common programming options are described later in this section.
Script editor features are also available in the log window and anywhere else that you can edit or write a script (for example, in t