www.wjpr.net Vol 7, Issue 9, 2018. 1020
RP-HPLC METHOD DEVELOPMENT AND VALIDATION OF
LURASIDONE HCl IN BULK AND PHARMACEUTICAL DOSAGE
FORM
A. Sravani Kasyap* and K. Vijayasri
Department of Pharmaceutical Analysis and Quality Assurance, Malla Reddy College of
Pharmacy, Maisammaguda, Secunderabad –14, Telangana, India.
ABSTRACT
RP-HPLC was developed and validated for the estimation of
Lurasidone HCl as per ICH guidelines.. A simple, fast, accurate and
precise RP-HPLC method was developed by using methanol: water in
the ratio of 70:30 using 0.01% Ortho Phosphoric acid in method 1 and
Acetonitrile:Water in the ratio 50:50 using 0.01% Ortho phosphoric
acid in method 2. The method was developed in Eclipse C18 column
(100 mm × 4.6 mm, 3.5 μm particle size). The method was found to be
linear in the range of 2.5- 15µg/ml with a correlation coefficient value
of 0.999. The accuracy studies of RP-HPLC method was performed at
three different levels, i.e., 50%, 100%, and 150% and recovery was
found to be in the range of 99.2 to 102.4% respectively. The limit of
detection (LOD) and limit of quantification (LOQ) were found for
RP-HPLC method. The % RSD is <2% which indicates the accuracy
and precision of the method. The above method was a rapid tool for routine analysis of
Lurasidone in the bulk and in the pharmaceutical dosage form.
KEYWORDS: RP-HPLC, Methnol: water, Acetonitrile: water, lurasidone, validation, ortho
phosphoric acid.
INTRODUCTION
“As the mankind made his way through remote times and places, he was always followed by
diseases and sickness from ill health, thus originated drugs and medicines to cure it and began
evaluation of practice of pharmacy and pharmaceutical analysis.[1]
Volume 7, Issue 9, 1020-1047. Research Article ISSN 2277– 7105
Article Received on 12 March 2018,
Revised on 02 April 2018, Accepted on 23 April 2018,
DOI: 10.20959/wjpr20189-12067
*Corresponding Author
A. Sravani Kasyap
Department of
Pharmaceutical Analysis
and Quality Assurance,
Malla Reddy College of
Pharmacy, Maisammaguda,
Secunderabad –14,
www.wjpr.net Vol 7, Issue 9, 2018. 1021 The methods of estimation of drugs are divided into physical, chemical, physico-chemical
and biological. Physico-chemical and physical methods are used commonly. Physical
methods of analysis involve the study of the physical properties of a substance, as
determination of solubility, transparency or degree of turbidity, colour density, specific
gravity (for liquids), moisture content, melting point (for solids), freezing and boiling points
(for liquids). Physico-chemical methods are used to study the physical phenomenon that
occurs as a result of chemical reactions. Among the physico-chemical methods, the most
important are optical (refractometry, polarimetry, emission, fluorescence methods of analysis,
photometry including photocolorimetry and spectrophotometry covering UV-Visible and IR
regions andnephlometry or turbidimetry) and chromatographic (column, paper, thin-layer, gas
liquidHPLC) methods. Modern pharmaceutical analysis must need the following
requirements. The combination of mass spectroscopy with gas chromatography (GCMS) and
liquid chromatography (LCMS) are one of the most powerful tools available.[2] The analysis should take a minimum time.
The accuracy of the analysis should meet the demands of Pharmacopoeia. The analysis should be economical.
The selected method should be precise and selective.
These requirements are met by the physico-chemical methods of analysis, a merit of which is
their universal nature that can be employed for analyzing organic compounds with a diverse
structure.[3]
High Performance Liquid Chromatography (HPLC)
High Performance Liquid Chromatography is a special branch of column chromatography
used to separate compounds that are dissolved in solution. It is a type of liquid
chromatography that employs a liquid mobile phase and a very finely divided stationary
phase. The technique of high performance liquid chromatography is so called because of its
improved performance when compared to column chromatograph.[4]
It evolved over nearly a century from the early work of Tswett in the late 1900s to the highly
sophisticated reliable and fast liquid chromatography (LC) techniques in common use today.
Early LC used gravity fed open tubular columns with particles 100s of microns in size and
the human eye was used to detect so separations often took hours or days to develop. This led
www.wjpr.net Vol 7, Issue 9, 2018. 1022 diffusion. This problem was largely overcome by the advent of HPLC. HPLC is characterized
by the use of high pressure to push a mobile phase solution through a column of stationary
phase allowing separation of complex mixtures with high resolution. In this system pressure
is applied to the column, forcing the mobile phase through at much higher rate.
The HPLC is the method of choice in the field of analytical chemistry, since this method is
specific, robust, linear, precise and accurate and the limit of detection is low and also it offers
the following advantages.
Greater sensitivity (various detectors can be employed) Improved resolution (wide variety of stationary phases)
Reusable columns (expensive columns but can be used for many analysis) Ideal for the substances of low viscosity
Easy sample recovery, handling and maintenance.
Instrumentation leads itself to automation and quantification (less time and less labour) Precise and reproducible
Integrator itself does calculations.[5]
Principle of separation
Adsorption chromatography employs high-surface area particles that adsorb the solute
molecules. Usually a polar solid such as a silica gel, alumina or porous glass beads and a
non-polar mobile phase such as heptane, octane or chloroform are used in adsorption
chromatography. The differences in affinity of solutes for the surface of the stationary phase
account for the separation achieved.
In partition chromatography the solid support is coated with a liquid stationary phase. The
relative distribution of solutes between the two liquid phases determines the separation. The
stationary phase can either be polar or non-polar. If the stationary phase is polar and the
mobile phase is non-polar, it is called normal phase partition chromatography. If the opposite
case holds, it is called reversed-phase partition chromatography. In normal phase mode, the
polar molecule partition preferentially into the stationary phase and are retained longer than
non-polar compounds. In reverse phase partition chromatography, the opposite behavior is
observed (CDER Reviewer Guidence Nov 1994).
Instrumentation
www.wjpr.net Vol 7, Issue 9, 2018. 1023 Solvent reservoir and treatment system
Mobile phase Pumps
Sample injectors Column
Column oven Detector[6]
Analytical Method Development
Methods are developed for new products when no official methods are available. Alternate
methods for existing (Non-Pharmacopoeial) products are developed to reduce the cost and
time for better precision and ruggedness. Trial runs are conducted, method is optimized and
validated. When alternate method proposed is intended to replace the existing procedure
comparative laboratory data including merit / demerits are made available.
HPLC Method development
A good method development strategy should require only as many experimental runs as are
necessary to achieve the desired final result. Finally method development should be lineare,
accurate and as simple as possible. During initial method development, a set of initial
conditions (detector, column, mobile phase) is selected to obtain the first chromatograms of
the sample. In most cases, columns are based on reversed-phase separations on a C18 with
UV-Visible detection (Analytical method development by Synider).
The important factors, which are to be taken into account to obtain reliable quantitative
analysis, are.
1. Standard and sample preparation.
2. Selection of the column.
3. Choice of the operating system to obtain the adequate resolution of the mixture.
4. Suitable integration of the peak height measurement.
5. Calculation of the proposed drug.
6. Validation for the developed method as per ICH Guidelines.[7]
Before beginning method development, it is need to review what is known about the sample
www.wjpr.net Vol 7, Issue 9, 2018. 1024 Selection of chromatographic mode
Reversed-phase chromatography (RPC) is the most common mode for small organic
molecules. Note that Ionizable compounds (acids and bases) are often separated by RPC with
buffered mobile phases (to keep the analytes in a non-ionized state) or with ion-pairing
reagents. In reverse phase mode, the mobile phase is comparatively more polar than the
stationary phase. For the separation of polar or moderately polar compounds, the most
preferred mode is reverse phase. The nature of the analyte is the primary factor in the
selection of the mode of separation.
Selection of Column Temperature: Always carry out chromatographic separations at
ambient temperature. The increase in column temperature generally will result in reduction of
asymmetry and peak retention. The column temperature between 30°c – 80°c is shall be
adopted if necessary.[8] If a column temperature above 80°c is required, packing material which can with stand that temperature was preferable.
Mobile phase composition
A mobile phase which gives separation of analyte peak and which is rugged for variation of
both aqueous and organic phase by at least ± 0.2% of the selected mobile phase composition
was used.[9]
Validation Parameters
Though many types of HPLC techniques are available, the most commonly used method, the
reversed-phase HPLC with PDA detection, is selected to illustrate the parameters for
validation. The criteria for the validation of this technique can be extrapolated to other
detection methods and chromatographic techniques. For acceptance, release or stability
testing, accuracy should be optimized since the need to show deviation from the actual or true
value is of the greatest concern.
All the variables of the method should be considered, including sampling procedure, sample
preparation, chromatographic separation, and detection and data evaluation.[10] For chromatographic methods used in analytical applications there is more consistency in
validation practice with key analytical parameters including.
(1) Linearity (2) Accuracy (3) Precision (4) Specificity (5) Limit of Detection (6) Limit of
www.wjpr.net Vol 7, Issue 9, 2018. 1025 If DL is determined based on visual evaluation or based on signal to noise ratio, the
presentation of the relevant chromatograms is considered acceptable for justification.[11]
Determination of the signal-to-noise ratio is performed by comparing measured signals from
samples with known low concentrations of analyte with those of blank samples and by
establishing the minimum concentration at which the analyte can be reliably quantified.[12]
MATERIALS AND METHODS
Instrumentation
Table: 1 Reagent and Chemicals.
S. No. Name of Instrument Model Make
1 Precision balance CA123 Contech
2 pH Meter 3 Star Global
3 HPLC with UV detector Model 1220 Agilent
4 Column Eclipse C18(100mm x 4.6mm),3.5µm Agilent
5 Sonicator UCB 70 Life care
Table: 2
S. no. Chemicals/Reagents Make/Grade
1 Methanol SD Fine Chemicals, (HPLC-Grade)
2 Acetonitrile SD Fine Chemicals, (HPLC-Grade)
3 Water SD Fine Chemicals (HPLC – Grade)
4 Ortho phosphoric acid SD Fine Chemicals (GR-Grade)
RP-HPLC METHOD
Instrumentation
Reverse phase - High performance liquid chromatography (Agilent) was equipped with VW
detector. The software used is EZ Chrome and the column employed is Eclipse C18 (100 mm
× 4.6 mm, 3.5 μm particle size).
Selection of mobile phase
Method -1
Trial- 1 In the first trial Lurasidone was added to mobile phase of ratio Methanol: water
(65:35) and the flow rate was maintained at 1ml/min at 230nm. Tailing of the peak was
www.wjpr.net Vol 7, Issue 9, 2018. 1026 Trial- 2
In the second trial Lurasidone was added to Methanol: water (75:25) as mobile phase. The
flow rate was maintained at 1ml/min at 230nm. Peaks were observed in this trial but were not
clearly eluted.
Trial- 3
In the third trial an optimum ratio of the mobile phase (Methanol: Water) was taken i,e 70:30
with 0.01% OPA keeping the other parameters constant. Sharp peaks and good separation of
the peaks were observed.
Method -2
Trial- 1
In the first trial Lurasidone was added to Acetonitrile: water (60:40) as the mobile phase. The
flow rate was maintained at 1ml/min at 230nm. Peak was observed in this trial but fronting
was observed
Trial- 2
In the second trial Lurasidone was added to Acetonitrile: water (75:25) as the mobile phase.
The flow rate was maintained at 1ml/min at 230nm. Peak was observed in this trial but
fronting was observed and the peak was blunt.
Trial- 3
In the third trial an optimum ratio of the mobile phase (Acetonitrile: Water) was taken i, e
50:50 with 0.01%OPA keeping the other parameters constant. Sharp peaks and good
separation of the peaks were observed.
Chromatographic conditions
Reverse phase HPLC method was developed for the estimation of Lurasidone by using
methanol: Water (70:30) with 0.01% OPA as mobile phase in method 1 and Acetonitrile:
water (50:50) with 0.01% OPA in method 2. The specific chromatographic conditions
employed for the estimation of Lurasidone are as follows.
Column : Eclipse C18 (100 mm × 4.6 mm, 3.5μm particle size)
Mobile phase : Methanol: water (70:30) with 0.01% ortho phosphoric acid (method1)
Acetonitrile: water (50:50) with 0.01% ortho phosphoric acid (method2)
www.wjpr.net Vol 7, Issue 9, 2018. 1027 Wavelength : 230nm
Injection volume : 20 l
Run time : 5 min
Preparation of stock solutions of Lurasidone
Method 1
Standard Lurasidone drug of 100mg was accurately weighed and transferred into separate
100ml volumetric flasks. About 40ml methanol: water with 0.01%OPA (70:30) is added into
the flask and subjected to sonication for 20min and then the volume in the flask are made up
to the mark with methanol: water (70:30) with 0.01% OPA to give a concentration of
1000μg/ml. From Lurasidone stock solution 1ml was pipette out and transferred into a 10ml
volumetric flask to get a concentration of 100μg/ml. Now appropriate dilutions were made to
get concentrations of 10μg/ml of Lurasidone and injected.
Method 2
Standard Lurasidone drug of 100mg was accurately weighed and transferred into separate
100ml volumetric flasks. About 40ml Acetonitrile: water with 0.01% OPA (50:50) is added
into the flask and subjected to sonication for 20min and then the volume in the flask are
made up to the mark with Acetonitrile: water (50:50) with 0.01% OPA to give a
concentration of 1000μg/ml. From Lurasidone stock solution 1ml was pipette out and transferred into a 10ml volumetric flask to get a concentration of 100μg/ml. Now appropriate dilutions were made to get concentrations of 10μg/ml of Lurasidone and injected.
Selection of analytical concentration ranges
From the standard stock solution of Lurasidone (100µg/ml), appropriate aliquots of
0.25ml,0.5ml,0.75,1ml,1.25ml,1.5ml (taken from 100µg/ml Lurasidone stock solutions of
method 1 and method 2) were pipetted out and transferred separately into different 10ml
volumetric flasks and the dilutions were made with respective mobile phases to obtain
working standard solutions with Lurasidone concentrations ranging from 2.5 to 15µg/ml
.Now 20µg/ml of each concentration is injected and the area of the drug with their respective
solvents were noted.
Calibration curve for Lurasidone (Method 1 & Method 2)
Appropriate aliquots from standard Lurasidone stock solutions were transferred into different
www.wjpr.net Vol 7, Issue 9, 2018. 1028 lurasidone concentrations of 2.5, 5, 7.5, 10, 12.5, 15 µg/ml .The ratio of area of Lurasidone
was measured and a graph of ratio of area against concentration were plotted and the
regression equation and correlation coefficient were determined.
Preparation of sample solution
For method 1
Twenty tablets of Lurasidone formulation were weighed and powdered. The powder
equivalent to 10mg was calculated and transferred into a 10ml volumetric flask and 4ml of
methanol: water (70:30) with 0.01% OPA is added and sonicated for 30min. The volume was
shaken and made up to the mark with methanol: water (70:30) with 0.01% OPA to obtain a
solution of 1000µg/ml. From this 1ml was taken into 10ml volumetric flask and make up to
the mark with the mobile phase (100µg/ml). The solution was filtered through Whatmann
filter paper (No. 41) and used for the estimation.
For method 2
Twenty tablets of Lurasidone formulation were weighed and powdered. The powder
equivalent to 10mg was calculated and transferred into a 10ml volumetric flask and 4ml of
Acetonitrile: water (50:50) with 0.01%OPA is added and sonicated for 30min. The volume
was shaken and made up to the mark with Acetonitrile: water (50:50) with0.01% OPA to
obtain a solution of 1000µg/ml. From this 1ml was taken into 10ml volumetric flask and
make upto the mark with the mobile phase (100µg/ml). The solution was filtered through
Whatmann filter paper (No. 41) and used for the estimation.
RESULTS AND DISCUSSION
The objective of the proposed work was to develop new analytical methods for the
determination of lurasidone and to validate the methods according to the ICH guidelines and
applying the same for its estimation in marketed formulations.
The developed RP-HPLC method was found to be rapid, simple, precise, accurate and
www.wjpr.net Vol 7, Issue 9, 2018. 1029 Results and discussion of the developed HPLC method
Selection of mobile phase
Method- 1
Trial- 1
In the first trial the mobile phase was changed to Methanol: water (65:35) and the other
parameters were maintained constant. Fronting of the peak was observed.
Trial-1 Fig. 1: Methanol: Water (65:35) as mobile phase.
Trial- 2
In the second trial, methanol: water (75:25) ratio was used as mobile phase, the flow was
maintained at1ml/min at 230nm In this case peak with tailing was observed.
Trial-2 Fig. 2: Methanol: Water (75:25) as mobile phase.
Trial- 3
In the third trial an optimum ratio of the mobile phase was taken Methanol: Water (70:30)
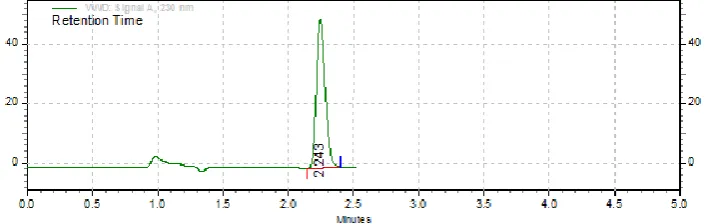
www.wjpr.net Vol 7, Issue 9, 2018. 1030 Trial-3 Fig. 3: Methanol: Water (70:30) with 0.01%OPA as mobile phase.
Method- 2
Trial- 1
In the first trial Lurasidone was added to Acetonitrile: water (60:40) as the mobile phase. The
flow rate was maintained at 1ml/min at 230nm. Peak was observed in this trial but fronting
was observed.
Trial-: Fig. 4: Acetonitrile: water (60:40) as mobile phase.
Trial- 2
In the second trial Lurasidone was added to Acetonitrile: water (75:35) as the mobile phase.
The flow rate was maintained at 1ml/min at 230nm. Peak was observed in this trial but
fronting was observed and the peak was blunt.
www.wjpr.net Vol 7, Issue 9, 2018. 1031 Trial- 3
In the third trial an optimum ratio of the mobile phase (Acetonitrile: Water) was taken i,e
50:50 keeping the other parameters constant. Sharp peaks and good separation of the peaks
were observed.
Trial-2: Fig. 6: Acetonitrile: water (50:50) with 0.01% OPA as mobile phase.
Optimisation of mobile phase and flow rate
Initially various mobile phase compositions were tried, to separate title ingredients. Mobile
phase composition and flow rate selection was based on peak parameters (height, tailing,
theoritical plates, capacity or symmetry factor) and run time. The system with methanol :
water (70:30) with 0.01% ortho phosphoric acid with 1ml/min flowrate was found to be quite
robust for method 1 and with acetonitrile : water (50:50) with 0.01% ortho phosphoric acid
with 1ml/min flow wast found robust for method 2. The optimum wavelength for detection
was 230nm at which better detector response for lurasidone was obtained. The retention time
was found to be 1.48min for method 1 and 2.24 for method 2 and the total runtime for this
[image:12.595.121.475.171.283.2]method was 5 min and indicates that the developed method is quite fast and economical.
www.wjpr.net Vol 7, Issue 9, 2018. 1032
Fig. 8: Standard chromatogram of Lurasidone at 10µg/ml for method.
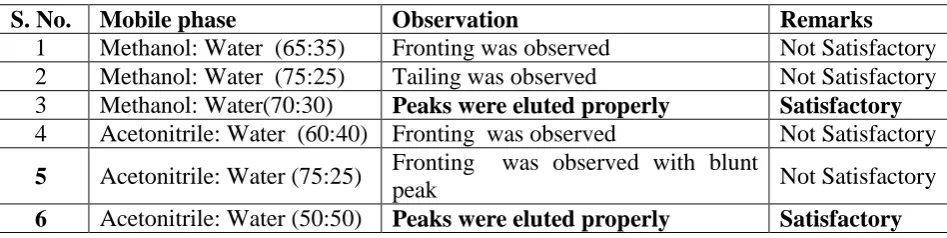
[image:13.595.59.533.290.409.2]Trails for Method-1 and Method-2
Table 3: Trails for Method-1 and Method-2.
S. No. Mobile phase Observation Remarks
1 Methanol: Water (65:35) Fronting was observed Not Satisfactory
2 Methanol: Water (75:25) Tailing was observed Not Satisfactory
3 Methanol: Water(70:30) Peaks were eluted properly Satisfactory
4 Acetonitrile: Water (60:40) Fronting was observed Not Satisfactory
5 Acetonitrile: Water (75:25) Fronting was observed with blunt
peak Not Satisfactory
6 Acetonitrile: Water (50:50) Peaks were eluted properly Satisfactory
System Suitability Testing (SST)
System suitability tests are an integral part of chromatographic method. They were used to
verify that the reproducibility of the chromatographic system. It is defined as tests to measure
that the method can generate result of acceptable accuracy and precision.
System suitability parameters
Table 4: System suitability parameters.
Retention time Theoretical plates (N) Tailing factor HETP Method 1 1.483 2631 1 0.027
Method 2 2.24 2200 1.5 0.018
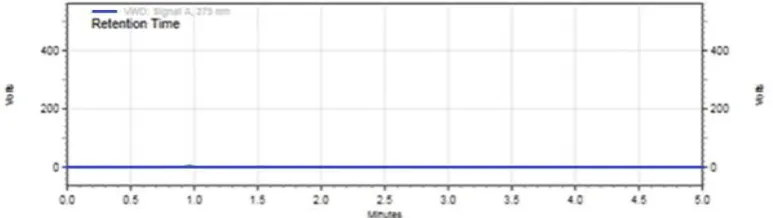
Specificity
The analyte was assessed in the presence of the components and it was found that there was
[image:13.595.58.539.290.409.2]www.wjpr.net Vol 7, Issue 9, 2018. 1033 Method-1
Fig. 9: Chromatogram of Specifity for method 1.
[image:14.595.105.492.270.379.2]Method-2
Fig. 10: Chromatogram of Specifity for method 2.
Linearity
Method 1 and Method 2
To check the linearity various concentrations were prepared. Each of these drug solutions
(20μL) was injected into the chromatographic system for three times. The peak area and
retention time were recorded and the mean values of peak areas were plotted against
concentrations.
Linearity studies of Lurasidone
Table 5: Linearity studies of Lurasidone.
Concentration (µg/ml) Peak area for method 1
Peak area for method 2
0 0000 0000
2.5 4118466 4036501
5 8263456 7487635
7.5 12689701 11110264
10 16452733 15190029
12.5 21034414 19060459
[image:14.595.132.431.606.735.2]www.wjpr.net Vol 7, Issue 9, 2018. 1034 For method-1
Graph 1: Calibration curve of lurasidone.
For method 2
Graph 2: Calibration curve of lurasidone.
[image:15.595.151.448.92.264.2]For method -1
www.wjpr.net Vol 7, Issue 9, 2018. 1035 Fig. 12: Chromatogram of Lurasidone of 5µg/ml.
Fig. 13: Chromatogram of Lurasidone of 10µg/ml.
Fig. 14: Chromatogram of Lurasidone of 15µg/ml.
For method 2
[image:16.595.128.467.444.562.2] [image:16.595.126.463.638.739.2]www.wjpr.net Vol 7, Issue 9, 2018. 1036
[image:17.595.131.465.244.360.2]Fig. 16: Chromatogram of Lurasidone of 5µg/ml.
Fig. 17: Chromatogram of Lurasidone of 10µg/ml.
Fig. 18: Chromatogram of Lurasidone of 15µg/ml.
Precision
Repeatability of the method was determined by analyzing five samples of same
concentrations of drugi. e. 2.5µg/ml for method 1 and 5 µg/ml for method 2 Chromatographs
were recorded and area of each chromatograph was measured and the values are represented
in the Acceptance criteriaA method is said to be precise if the % RSD is < 2%, the results
show % RSD for repeatability studies was 1.06 and 0.685 respectively which indicates the
[image:17.595.129.465.412.558.2]www.wjpr.net Vol 7, Issue 9, 2018. 1037 Repeatability studies of Lurasidone (method 1)
Table 6: Repeatability studies of lurasidone (method 1).
Concentration (µg/ml) Peak area (230nm) MeanPeak area ± S.D (n=6) % RSD
2.5 4013456
4087376 ± 43417.83 1.062242
2.5 4098614
2.5 4118466
2.5 4118450
2.5 4118478
2.5 4056789
Repeatability studies of lurasidone (method 2)
Table 7: Repeatability studies of lurasidone (method 2).
Concentration (µg/ml) Peak area (230nm) Mean Peak area ±S.D (n=6) % RSD
5 7487635
7450501±51083.63 0.685
5 7431564
5 7396521
5 7496325
5 7501364
5 7389596
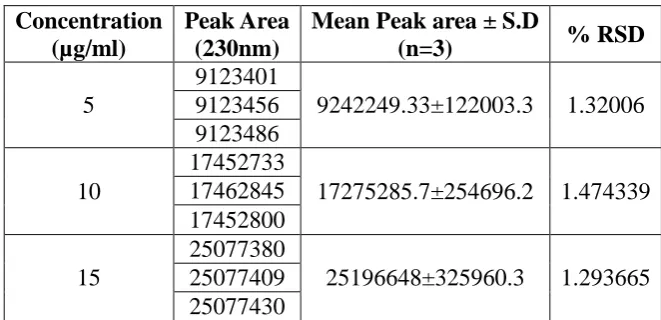
Intraday precision
The intra-day precision of the assay method was evaluated by carrying out 9 independent
assays of a test sample at three concentrations against a qualified reference standard. The %
RSD of three obtained assay values at three different concentration levels was calculated.
[image:18.595.131.462.519.679.2]Intraday precision studies of lurasidone Method 1
Table 8: Intraday precision studies of lurasidone Method 1.
Concentration (µg/ml)
Peak Area (230nm)
Mean Peak area ± S.D
(n=3) % RSD
5
9123401
9242249.33±122003.3 1.32006 9123456
9123486
10
17452733
17275285.7±254696.2 1.474339 17462845
17452800
15
25077380
25196648±325960.3 1.293665 25077409
www.wjpr.net Vol 7, Issue 9, 2018. 1038 Table 9: Intraday precision studies of lurasidone Method 2.
Concentration (µg/ml)
Peak Area (230nm)
MeanPeak area ± S.D
(n=3) % RSD
5
7487635
7438573±45959.64 0.617856
7431564 7396521
10
16066146
16328012±248956.3 1.524719 16561653
16356236
15
22223727
22645173±371350 1.639864
22924367 22787425
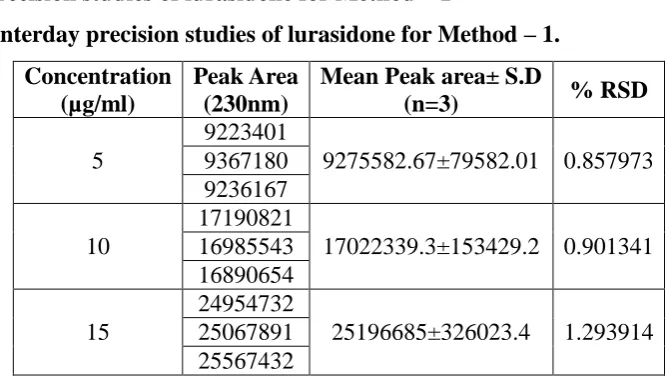
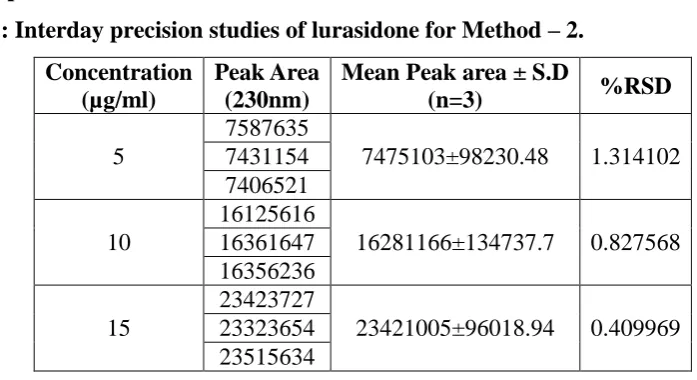
Interday precision
The inter-day precision study was performed at three different concentration levels and each
value is the average of three determinations (n=3). Record the chromatograms and measure
the peak response. The results were reported as %RSD and the results are presented in the for
Method 1 &for Method 2.
Acceptance criteria A method is said to be precise if the % RSD is < 2 %, the results show
% RSD for the intraday and interday were within the limits which and hence the method is
said to be precise.
Interday precision studies of lurasidone for Method – 1
Table 10: Interday precision studies of lurasidone for Method – 1.
Concentration (µg/ml)
Peak Area (230nm)
Mean Peak area± S.D
(n=3) % RSD
5
9223401
9275582.67±79582.01 0.857973 9367180
9236167
10
17190821
17022339.3±153429.2 0.901341 16985543
16890654
15
24954732
25196685±326023.4 1.293914 25067891
[image:19.595.128.462.468.662.2]www.wjpr.net Vol 7, Issue 9, 2018. 1039 Interday precision studies of lurasidone for Method – 2.
Table 11: Interday precision studies of lurasidone for Method – 2.
Concentration (µg/ml)
Peak Area (230nm)
Mean Peak area ± S.D
(n=3) %RSD
5
7587635
7475103±98230.48 1.314102
7431154 7406521
10
16125616
16281166±134737.7 0.827568 16361647
16356236
15
23423727
23421005±96018.94 0.409969 23323654
23515634
Robustness
Robustness of an analytical procedure is a measure of its capacity to remain unaffected by
small, but deliberate variations in method parameters and provides an indication of its
reliability during normal usage. robustnesswas performed by changing the parameters such as
flow rate and wavelength to 0.8ml/min,1.2 ml/min and 228nm,232nm respectively. and the
values are represented in the for method 1 and method 2.
Acceptance criteria -A method is said to be robust if the % RSD is < 2 %, the results show
% RSD for the intraday and interday were within the limits and hence the method is said to
be robust.
Robustness studies of lurasidone for Method 1
Table 12: Robustness studies of Lurasidone for Method 1.
Parameter RT Mean Peakarea ± S.D
(n=3) % RSD
Flow rate 0.8ml/min 1.84 16022171.3±108024.25 0.674 Flow rate 1.2ml/min 1.233 10207386.3±76537.50 0.750 Wave length 228nm 1.473 11843799±139935.87 1.182 Wave length 232nm 1.473 11345780.3±106003.98 0.934
Robustness studies of lurasidone for Method 2.
Table 13: Robustness studies of Lurasidone for Method 2.
Parameter RT Mean Peakarea±S.D
(n=3) % RSD
www.wjpr.net Vol 7, Issue 9, 2018. 1040 Ruggedness
Ruggedness studies were performed by preparing three replicates of the drugandanalyzing
bydifferent analyst. Values are represented in the for both the methods.
Acceptance criteria
A method is said to be rugged if the %RSD values is <2%. The results indicate that the
%RSD values for different analysts was found to be <2% which indicates that they meet the
acceptance criteria and hence the method is said to be rugged.
For method-1
Ruggedness studies of lurasidone by Different analyst- 5µg/ml
Table 14: Ruggedness studies of Lurasidone by Different analyst- 5µg/ml.
Parameters Retention time Mean Peak area± S.D
(n=3) % RSD
Analyst-1 1.473 9275582.67±79582.01 0.857
Analyst-2 1.470 9563254.33±74630.81 0.780
For Method-2
Ruggedness studies of Lurasidone by Different analyst- 5µg/ml
Table 15: Ruggedness studies of Lurasidone by Different analyst- 5µg/ml.
Parameters Retention time Mean Peak area± S.D
(n=3) % RSD
Analyst-1 2.243 7388292±58721.62 0.794793
Analyst-2 2.243 7288350±143566 1.969801
Assay
Assay studies were carried out by weighing twenty tablets of lurasidone tablets and are
powdered. The powder equivalent to 10mg was taken and the solution equivalent to
1000µg/ml was prepared and was used for further dilutions. The results of the assay are
shown.
Acceptance criteria
A method should have the % purity in the range of 98-102%. The results show that the %
www.wjpr.net Vol 7, Issue 9, 2018. 1041 Method -1:1 Assay studies of lurasidone
Table 16: Assay studies of Lurasidone.
Formulation Label claim Amount Found
Mean peak± S.D
(n = 3) %RSD % Purity
Latuda (lurasidone-20mg) 5mg 5.01 9563254.33±
74630.81 0.780 100.05%
Fig 18: Chromatogram of assay studies of Lurasidone (5mcg/ml).
[image:22.595.67.534.409.604.2]Assay studies of lurasidone for Method -2
Table 17: Assay studies of lurasidone for Method -2.
Formulation Label claim Amount found
Mean peak± S.D
(n = 3) %RSD %Purity
Latuda (lurasidone-20mg) 5mg 5.03 7431154±98230.48 1.314102 100.07%
Fig. 19: Chromatogram of assay studies of lurasidone (5mcg/ml).
Accuracy
Accuracy of the proposed method was determined using recovery studies by standard
addition method. The recovery studies were carried out by adding known amounts (50, 100
and 150%) i.e. 2.5,5 and 7.5µg/ml to the standard concentration of 5 µg/ml. The solutions
were prepared in triplicates and the % recovery was calculated and the values are represented
www.wjpr.net Vol 7, Issue 9, 2018. 1042 Acceptance criteria
A method is said to be accurate if the % recovery studies are in the range of 98-102. The
results for accuracy indicate that the % recovery values are in the range of 99.2-100.2%
which indicate that the method is accurate as it meets the necessary criteria.
[image:23.595.68.532.187.385.2]Method-1: Accuracy studies of lurasidone by HPLC
Table 18: Method-1: Accuracy studies of Lurasidone by HPLC.
Spiked level (%) Formulation Conc. (µg/ml) Pure Drug Conc. (µg/ml) Amount found % Recovery % Mean recovery ±SD % RSD 50
5 2.5 7.51 100.1
100.8±0.624 0.619
5 2.5 7.62 101.3
5 2.5 7.58 101.0
100
5 5 10.10 101.0
100.8±0.264 0.262
5 5 10.09 100.5
5 5 10.18 100.9
150
5 7.5 12.14 99.2
100.8±1.6 1.587
5 7.5 12.28 102.4
5 7.5 12.60 100.8
Chromatograms of Accuracy Studies of Lurasidone
Accuracy 50%-To the constant 5 µg/ml, 2.5 µg/ml concentrations was added and injected
and the peak area was observedat a flowrate maintained at 1ml/min at 230nm.
Fig. 20: Chromatogram of accuracy 50 %.
Accuracy 100%- To the constant 5 µg/ml, 5 µg/ml concentrations was added and injected
[image:23.595.120.474.480.650.2]www.wjpr.net Vol 7, Issue 9, 2018. 1043 Fig. 21: chromatogram of accuracy 100 %.
Accuracy 150%-To the constant 5 µg/ml, 7.5 µg/ml concentrations was added and injected
[image:24.595.118.471.334.486.2]and the peak area was observedat a flowrate maintained at 1ml/min at 230nm.
Fig. 22: Chromatogram of accuracy 150 %.
Method-2: Accuracy studies of lurasidone by HPLC
Table 19: Accuracy studies of lurasidone by HPLC.
Spiked level (%)
Formulation Conc. (µg/ml)
Pure Drug Conc. (µg/ml)
Amount found
% Recovery
% Mean recovery
±SD
% RSD
50
5 2.5 7.62 101.6
100.6±1.04 0.994
5 2.5 7.47 99.6
5 2.5 7.55 100.67
100
5 5 10.09 100.9
101.5±0.56 0.560
5 5 10.17 101.7
5 5 10.2 102
150
5 7.5 12.65 101.2
100.2±0.96 0.957
5 7.5 12.53 100.24
www.wjpr.net Vol 7, Issue 9, 2018. 1044 Chromatograms of Accuracy Studies of Lurasidone
Accuracy 50%-To the constant 5 µg/ml, 2.5 µg/ml concentrations was added and injected
[image:25.595.123.476.157.350.2]and the peak area was observedat a flowrate maintained at 0.8ml/min at 230nm.
Fig. 23: Chromatogram of accuracy 50 %.
Accuracy 100%- To the constant 5 µg/ml, 5 µg/ml concentrations was added and injected
and the peak area was observedat a flowrate maintained at 0.8ml/min at 230nm.
Fig. 24: Chromatogram of accuracy 100 %.
Accuracy 150%-To the constant 5 µg/ml, 7.5 µg/ml concentrations was added and injected
[image:25.595.122.474.462.641.2]www.wjpr.net Vol 7, Issue 9, 2018. 1045 Fig. 25: Chromatogram of accuracy 150 %.
Limit of Detection and Limit of Quantification
Limit of detection (LOD) and the limit of quantification (LOQ) were based on the residual
standard deviation of the response and the slope of the constructed calibration curve (n=3), as
described in International Conference on Harmonization guidelines Q2 (R1).
LOD = 3.3 × σ/S LOQ = 10 × σ/S
Where,
σ = the standard deviation of the response and
S = slope of the calibration curve
Limit of detection and limit of quantification were calculated using the above formulas and
the results are shown in the
Method-1, Limit of detection and limit of quantification
Table 20: Limit of detection and limit of quantificationMethod-1.
Parameter Lurasidone at 230nm
Limit of detection 0.305767
Limit of quantification 0.92656
Method-2, Limit of detection and limit of quantification
Table 21: Method-2, Limit of detection and limit of quantification.
Parameter Lurasidone at 230nm
Limit of detection 0.523742
www.wjpr.net Vol 7, Issue 9, 2018. 1046 Summary of Validated parameters of HPLC
Table 22: Summary of Validated parameters of HPLC.
Parameter Lurasidone at 230nm
Method 1
Lurasidone at 230nm Method 2
Linearity range (µg/ml) 2.5-15µg/ml 2.5-15µg/ml
Regression equation(y=mx+c) y = 1675048x -43410 y = 1491735x +113213
Slope 1675048x 1491735x
Intercept 43410 113213
Correlation coefficient (r2) 0.999 0.999
Accuracy 99.2-102.4% 99.2-101.7%
Precision (%RSD) 0.85-1.47 0.41-1.63
LOD 0.305767 0.523742
LOQ 0.926565 1.587097
CONCLIUSION
For routine analysis purpose, it is always necessary to establish methods capable of analyzing
huge number of samples in a short period of time with due accuracy and precision.
Lurasidone is a recently approved drug and very few analytical methods appeared in the
literature for the deterination of Lurasidone which include RP-HPLC, method. In view of the
above fact, some simple analytical method like RP-HPLC were developed which were
sensitive, accurate, precise and economical.
In the present investigation, RP-HPLC methods for the qualitative and quantitative estimation
of Lurasidone in bulk drug and pharmaceutical dosage forms have been developed.
"The results of the validation parameters for RP-HPLC by internal standard method are as
follows."
Linearity - 5-100µg/ml Correlation coefficient - 0.999 Precision Repeatability - 1.39 Interday precision - 0.88 Intraday precision - 0.92
www.wjpr.net Vol 7, Issue 9, 2018. 1047 Assay - 99.8
LOD & LOQ - 1.42 & 4.30
The above results indicate that the values of the validation parameters were found to be
within the acceptance criteria and hence the developed methods were proved to be precise,
accurate and robust.
ACKNOWLEDGEMENT
At first, I consider it is a great privilege to express my heartfelt gratitude and sincere thanks
to my esteemed guide Dr. K. Vijaya sri, HOD, Department of Pharmaceutical Analysis,
Malla Reddy College of Pharmacy, Hyderabad for her valuable suggestion encouragement
motivation guidance and co-operation during my thesis work.
REFERENCES
1. Ravi Shankar s, Pharmaceutical Analysis. 3rd ed. Rx publishing House, 2001; 1-1: 2-2. 2. Kirkbright GF. Development and publication of new spectrophotometric method of
analysis. Talanta, 1966; 13: 1-14.
3. Ramana Rao G, Murthy SSN, Khadgapathy P. High performance liquid chromatography
and its role in pharmaceutical analysis. Eastern Pharmacist, 1986; 29(346): 53.
4. Kaur H. Spectroscopy. 3rd Meerut: Pragathi Prakashancation Publishers, 2007; 1-5, 237-314.
5. Pattengill MD, Sands DE, Statistycal significance of linear least-square parameters.
JChem Educ, 1979; 56: 244.
6. Marvin CM. HPLC A Practical Users Guide. 2nd. New Jersey: John Wiley and sons, Inc, 2007; 1.
7. Green JM. A Guide to Anlytical Method Validation. J Amer Chem, 1996; 68: 305A-9A.
8. Validation of analytical procedures text and methodology Q2 (R1).
9. ICH Harmonised Tripartite Guideline: Validation of analytical procedures: Methodology.
Geneva: IFPMA, 1996.
10.ICH: Validation of analytical procedure: Methodology Q2B, 1996.
11.Schirmer RE modern methods of pharmaceutical analysis. 2nd ed. Boca Raton: CRC Press, 1991.