ANALYTICAL EVALUTION AND DETERMINATION OF
RASA
ON
TEPHROSIA
SPECIES - A SCIENTIFIC STUDY
Urvi Ashani1*, Harisha C. R.1 and V. J. Shukla2
1
M. Pharm (Ayu) Scholar & Head, Pharmacognosy, IPGT & RA, Gujarat Ayurved
University, Jamnagar, Gujarat, India.
2
Head, Pharmaceutical chemistry, IPGT & RA, Gujarat Ayurved University, Jamnagar,
Gujarat, India.
ABSTRACT
The plant genus Tephrosia (Fabaceae) is widely distributed in most
tropical and sub-tropical countries. It is commonly prescribed in liver
or spleen diseases. Till date the comparative Rasanirdharana and
analytical work had not been reported. In the present study
comparative study of Tephrosia purpurea Pers., Tephrosia candida
DC. & Tephrosia jamnagarensis Sant. has been under taken.
Analytical of all the three sps. Showed Loss on drying, Total Ash,
Acid insoluble ash were 7.083%, 7.624% & 7.623%; 6.079%, 6.061%,
6.72%; 0.450%, 0.150%, 0.815% respectively. Qualitative scrutiny
demonstrated the presence of flavonoids and tannins. High
Performance Thin Layer Chromatography (HPTLC) were carried out
after organizing appropriate solvent system. Data of Rasanirdharana
shows the highest frequency in the characteristics of Katu rasa, Kashaya rasa and Tikta rasa
in Tephrosia purpurea, Madhur rasa, Amla rasa, and Lavana rasa in Tephrosia candida and
Madhur rasa, Amla rasa, Lavana rasa in Tephrosia jamnagarensis as experienced by the
responders.
KEYWORDS: HPTLC, Phytochemical, Rasanirdharan, Tephrosia.
INTRODUCTION
The vital responsibility played by herbal medicine in serving the therapeutic requirements of
major fraction of human populace worldwide is identified since ancient times. But the quality
control and standardization facets of these herbal drugs stay as a herculean task even in the
Volume 6, Issue 2, 707-715. Research Article ISSN 2277– 7105
*Corresponding Author
Dr. Urvi Ashani
M. Pharm (Ayu) Scholar &
Head, Pharmacognosy,
IPGT & RA, Gujarat
Ayurved University,
Jamnagar, Gujarat, India Article Received on 24 Nov. 2016,
Revised on 14 Dec. 2016, Accepted on 04 Jan. 2017
21st century. Accurate identification and guarantee of purity through pharmacognosy and
pharmaceutical chemistry measures is inescapable ladder needed for the quality assurance
and standardization of any of the herbal medicine whether it is single drug of formulation.
Tephrosia species (Fabaceae) are well known medicinal plants. All the three plants
commonly found in India and other tropical countries. Tephrosia purpurea Pers., Tephrosia
candida DC. and Tephrosia jamnagarensis are herbs naturally available as weed of road side
and agricultural fields. They are Laxative, Diuretic, Tonic, etc.[1]
Isolated scientific information is available regarding the phytochemical profile of this drug.
Moreover, to standardize as per monographs, physic-chemical parameters are to be studied to
get gist of the physical and chemical nature of the plant. Till date the comparative analytical
and Rasanirdharan work had not been reported. Hence in the present research article an
effort has been made to overcome this lacuna by studying phytochemical profile and the taste
determination of whole plant powder.
In Ayurveda, Rasapanchak determines the actions of the drug. Among these Rasapanchak,
Rasa (Taste) is one of the criteria for determining the possible action of plant drug through
the basis of taste perception by tongue (sensory organ). Hence it is vital to perform
Rasanirdharan (Determination of Taste) of the test drug to understand the possible mode of
action of the drug.
MATERIALS AND METHODS
Collection of Samples
Whole plant of all the three species of Tephrosia are collected by the scholar from out skirts’
of Jamnagar during the month of October-November 2015. Then the plant was authentified in
the pharmacognosy lab. IPGT & RA, Jamnagar, herbarium submitted in the department
(Specimen No.PHM 6161 T. jamnagarensis / 6162 T. purpurea / 6163 T.candida / 2015).
Whole plant were first washed with tap water then few quantity were stored in solution of
AAF (70% Ethyl alcohol: Glacial acetic acid: Formalin) in the ratio of (90:5:5) to utilize
them for microscopic studies whenever needed. The remaining parts were dried under the
shade and then were subjected for 60# powdering.
Preparation of powder
The whole plant was shade dried and powdered by mechanical mixer grinder then sieved
Preparation of plant extract
5 g powder of each sample (root and leaf powder) was macerated with 100 ml water in a
closed flask for twenty four hours, shaking frequently during six hours and allowed to stand
for eighteen hours. After twenty four hours samples were filtered and water extract was
collected. Methanolic and extract was also prepared following same procedure. All two
extracts were used for preliminary phytochemical screening.[3]
Analytical evaluation
The colour, odour and taste of whole plant powder were recorded separately through visual
and sensory perceptions.[4] Physicochemical parameters.[5] preliminary phytochemical
investigations.[6] quantitative estimation of Tannin.[7] and HPTLC.[8] were conducted on
sample. All determinations were performed in triplicate and the results are presented as mean
value.
Rasanirdharan
The participants who volunteered for the study were explained about the study and their role
in the study. Every volunteer was then asked to cleanse their mouth with water, prior to the
onset of the experiment. Five minutes after cleansing the mouth, they were given powder of
the test drug and asked to record their inputs in the questionnaire.[9]
RESULTS
Physicochemical parameters and qualitative analysis:
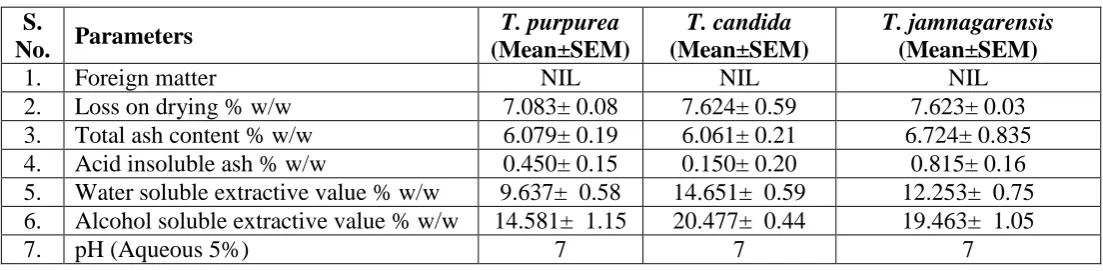
Whole plant powder of all the three sps. were subjected to physicochemical parameters like
loss on drying, total ash, acid insoluble ash, alcohol soluble extractive value, pH value, etc.
[image:3.595.22.574.600.735.2]Results are depicted in table 2.
TABLE – 2: Results of physicochemical parameters of all three species:
S.
No. Parameters
T. purpurea (Mean±SEM)
T. candida (Mean±SEM)
T. jamnagarensis (Mean±SEM)
1. Foreign matter NIL NIL NIL
2. Loss on drying % w/w 7.083± 0.08 7.624± 0.59 7.623± 0.03 3. Total ash content % w/w 6.079± 0.19 6.061± 0.21 6.724± 0.835 4. Acid insoluble ash % w/w 0.450± 0.15 0.150± 0.20 0.815± 0.16 5. Water soluble extractive value % w/w 9.637± 0.58 14.651± 0.59 12.253± 0.75 6. Alcohol soluble extractive value % w/w 14.581± 1.15 20.477± 0.44 19.463± 1.05
PCA analysis
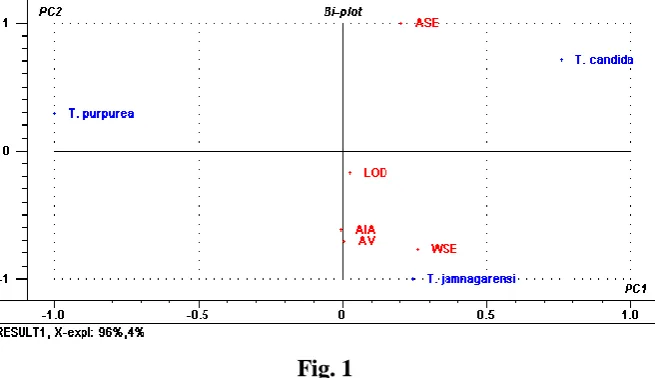
Principle Component Analysis (PCA) is a dimensionality-reduction technique that is often
used to transform a high-dimensional dataset into a smaller-dimensional subspace prior to
running a machine learning algorithm on the data. When applying it on the values of
[image:4.595.135.463.189.378.2]physico-chemical parameters, result in Bi-plot shown in Fig. 1.
Fig. 1
Preliminary qualitative tests
Whole plant powder of all three sps. were qualitatively tested for the presence of different
phytoconstituents. Carbohydrate, Cardiac glycoside, Flavonoid and Tannin are present in
both the extracts. The other observed results in methanolic extracts are shown in the table 3.
TABLE – 3: Results of preliminary qualitative tests of all three species
‘+’ Present, ‘-’ Absent
Quantitative Analysis
The sample powders of all three sps. were subjected to quantitative estimation for total
Sr. No. Phyto-constituents Tests T. purpurea T. candida T. jamnagarensis
1 Carbohydrates Molish’s - - - 2 Reducing Sugar Fehling’s + + +
3 Proteins Biuret - - -
4 Tannins Fecl3 + + +
5 Steroids Salkowski - - +
TABLE – 4: Results of quantitative analysis of all three species
Phyto-constituents Observation
Total Tannin Content T. purpurea T. Candida T. jamnagarensis
2.93 % w/w 2.51 %w/w 2.09 %w/w
High-performance thin layer chromatography
HPTLC study of methanolic extract of all the three sps. were carried out by using solvent
system of Toluene : Chloroform : Acetone (4:2.5:3.5) v/v was used. Results are shown in
table 5, plates are shown in Fig. 2 & 3, simple and 3D peak display at 254 nm and 366 nm in
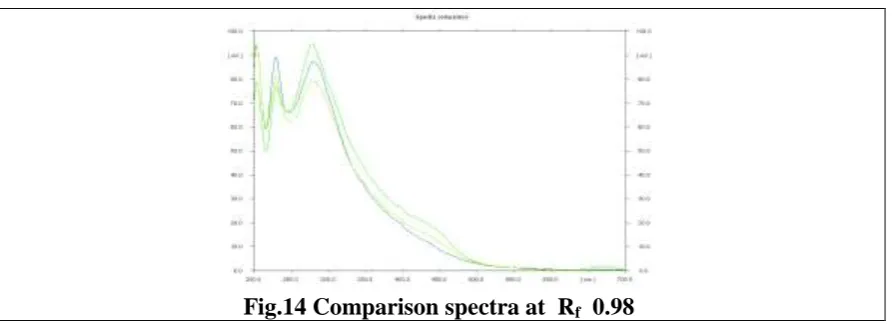
Fig.4 to Fig.11 and Comparative spectra of all three sps. at Rf 0.84,0.94,0.98 shown in Fig.12
[image:5.595.72.530.298.751.2]to Fig.14.
Table – 5: HPTLC Studies of alcohol extracts of all three species
Name of Samples At 254 nm At 366 nm
T. purpurea 0.05, 0.34, 0.96, 0.98 0.05, 0.83, 0.94 T. candida 0.06, 0.26, 0.83, 0.97 0.06, 0.83, 0.94 T.jamnagarensis 0.06, 0.19, 0.99 0.06, 0.19, 0.85, 0.95
Fig.2 254 nm Fig.3 366 nm
Fig.6 Fig.7
Fig.8
Simple peak display of all sps. at 254 nm
Fig.9
Simple peak display of all sps. at 366 nm
Fig.10
3D peak display of all sps. at 254 nm
Fig.11
3D peak display of all sps. at 366 nm
Rasanirdharana
Whole plant powder of all the three sps. were used in the experimental study to ascertain their
Rasa. The study was conducted on 30 volunteers aged between 25 – 35 years, who were
familiar with Shadrasa (six tastes) and were able to express it. The results were interpreted
based on the Rasa perceived. Data shows the highest frequency in the characteristics of Katu
rasa (38.29%), Kashaya rasa (29.78%) and Tikta rasa (12.76%) in Tephrosia purpurea,
Madhur rasa (27.69%), Amla rasa (20%), and Lavana rasa (16.92%), in Tephrosia candida
and Madhur rasa (26.08%), Amla rasa (20.28%), Lavana rasa (15.94%) in Tephrosia
jamnagarensis as experienced by the responders and all results are depicted in table 1.
TABLE – 1: Results of Rasa perception of whole plant powder of all three species
S. No. Characters RASA (Taste)
T.p. T.c. T.j. 1. Madhura (Sweet) 6.38 % 27.69 % 26.08 % 2. Amla (Sour) 8.51 % 20 % 20.28 % 3. Lavana (Salty) 4.26 % 16.92 % 15.94 % 4. Katu (Spicy) 12.76 % 1.53 % 4.34 % 5. Tikta (Bitter) 38.29 % 20 % 24.63 % 6. Kashaya (Astringent) 29.78 % 13.84 % 8.69 %
“T.p.= Tephrosia purpurea, T.c.= Tephrosia candida, T.j.= Tephrosia jamnagarensis”
DISCUSSION
Whole plant powder of all three sps. exhibits various results viz., moisture content (L.O.D.)
found more in T. candida (7.624 ± 0.59) in comparison to the other two species. Ash value
has been found less in T. purpurea (6.079 ± 0.19 % w/w) than T. candida (6.061 ± 0.21 %
w/w) and T. jamnagarensis (6.724 ± 0.835% w/w) sample whereas acid insoluble ash is less
in Candida (0.150 ± 0.20 % w/w) in comparison to T. purpurea (0.450 ± 0.15 % w/w) and T.
[image:7.595.78.525.68.232.2]jamnagarensis (0.815 ± 0.16 % w/w) samples. Low ash value signified low level of inorganic
matter and low acid insoluble ash denotes low level of sand and silica content in sample.
Neutral pH i.e. 7 has been found in all the three species. Water soluble extractive value in all
samples i.e. T. purpurea, T. candida and T. jamnagarensis samples has been found more in
compare to alcohol soluble extractive value which indicates the probability of the presence of
high water soluble constituents than the alcohol soluble in all samples.
Physical manifestation of chemical moeties from the PCA analysis it is observed, chemical
moieties which observed in T. jamnagarensis predominantly in third plot, the replicas
moieties represented in the second plot. Whereas the first plot T. purpurea representing very
least amount of characters as compare to second & third i.e. T. jamnagarensis showed a
dominant character in our research study (Fig. 1).
Qualitative tests showed the presence of reducing sugar, tannin, glycoside and flavonoid in
all three samples i.e. T. purpurea, T. candida and T. jamnagarensis. Whereas steroid is
present only in T. jamnagarensis sample. So in T. purpurea and T. candida it was absent or
may be present in very negligible amount (Table 3).
Qualitative analysis output showed an overall profile of chemical moieties present in plant
extract. Natural products with reservoirs of structural and chemical entities will have definite
therapeutic relevance. Quantitative estimation of sample powder showed presence of tannin.
The presence of flavonoid and tannin content may be responsible for the taste results which
are obtained from Rasanirdharan study i.e. Kashaya, Madhura and Tikta rasa dominancy
amongst all three species.
HPTLC profile showed 4 spots in T. purpurea and T. candida, while T. jamnagarensis
showed 3 spots at 254nm, whereas at 366 nm T. purpurea and T. candida showed 3 spots,
while T. jamnagarensis showed 4 spots.
Comparative spectra of all three samples revealed the presence of common Rf. values are
0.84, 0.94 & 0.98. The result obtained, study showed the chemical profile of drug.
Whole plant powders of all the three sps. exhibits Tikta (Bitter), Madhura (Sweet), and
Kashaya (Astringent) as Pradhan rasa (predominant taste) and as Anurasa too. Detail results
CONCLUSION
The values obtained from analytical study including physicochemical parameters, qualitative
analysis and quantitative analysis can be used for standardization of identity and purity
amongst all three sps. The standard results may help for the further research works.
REFERENCES
1. Yoganarshiman SN. Medicinal Plants of India. Vol. I, Karnataka: Inter Publishing Pvt.
Ltd.; 1995, pp. 464.
2. Khandelwal KR. Practical Pharmacognosy. 19th ed. Pune: Nirali Prakashan; 2008, pp. 51.
3. Anonymous. The Ayurvedic Pharmacopoeia of India. 1st ed. Part- II, Vol-II, New Delhi:
Government of India, Ministry of Health and Family Welfare, Department of AYUSH;
2008; pp. 159-161.
4. Wallis TE. Text book of Pharmacognosy. 5th ed. New Delhi: CBS Publishers &
Distributors; 2002; pp: 123-132, 210-215.
5. Anonymous. Ayurvedic Pharmacopoeia of India, DISM & H. 1st ed. Vol.-1, part-1,
reprinted 2001; pp: 143.
6. Kokate CK, Purohit AP, Gokhale SB, Pharmacognosy. 2nded. Pune: Nirali Prakashan;
2008; pp.6.13,6.17,6.42.
7. Ibidem (6): Text book of Pharmacognosy. 2002; pp: 123-215,571-578.
8. Ibidem (8): Pharmacognosy. 2008; pp: 6. 24-25.
9. Dhyani SC, Rasapanchaka (Ayurvedic Principles of Drug Action). 3rd ed. Varanasi: