DEVELOPMENT AND VALIDATION OF RP-HPLC METHOD FOR
QUANTITATIVE ANALYSIS OF PANOBINOSTAT IN PURE AND
PHARMACEUTICAL DOSAGE FORM
P. Jitendra Kumar*1, MD. Hifzur Rohman1, M. Nagendra Babu1, M. Karthik1,
P. Suvarna Babu1 and D. Rama Brahma Reddy1
Nalanda Institute of Pharmaceutical Sciences, Siddharth Nagar, Kantepudi (V), Sattenapalli
(M), Guntur District – 522438, Andhra Pradesh.
ABSTRACT
A simple, Precised, Accurate method was developed for the estimation
of Panobinostat by RP-HPLC technique. Chromatographic conditions
used are stationary phase Zodiac C18 150mm x 4.6 mm, 5, Mobile
phase 0.01% KH2PO4:Acetonitrile in the ratio of 60:40 and flow rate
was maintained at 1.0 ml/min, detection wave length was 230 nm,
column temperature was set to 30oC and diluent was mobile phase
Conditions were finalized as optimized method. System suitability
parameters were studied by injecting the standard six times and results
were well under the acceptance criteria. Linearity study was carried out
between 25% to 150% levels, R2 value was found to be as 0.999.
Precision was found to be 0.6 for repeatability and 0.2 for intermediate
precision. LOD and LOQ are 0.050µg/ml and 0.151µg/ml respectively.
By using above method assay of marketed formulation was carried out 99.98% was present.
Degradation studies of Panobinostat were done, in all conditions purity threshold was more
than purity angle and within the acceptable range.
KEYWORDS: HPLC, Panobinostat, Method development. ICH Guidelines.
1. INTRODUCTION
Panobinostat is an oral deacetylace (DAC) inhibitor approved by the FDA for the treatment
of multiple myeloma.[1] The approval was accelerated based on progression-free survival,
therefore confirmatory trials by the sponsor to demonstrate clinical efficacy in mult iple
Volume 8, Issue 3, 988-995. Research Article ISSN 2277– 7105
Article Received on 02 Jan. 2019,
Revised on 22 Jan. 2019, Accepted on 13 Feb. 2019
DOI: 10.20959/wjpr20193-14314
*Corresponding Author
P. Jitendra Kumar
Nalanda Institute of
Pharmaceutical Sciences,
Siddharth Nagar, Kantepudi
(V), Sattenapalli (M),
Guntur District – 522438,
Novartis under the brand name Farydak. Panobinostat acts as a non-selective histone
deacetylase inhibitor (pan-HDAC inhibitor) and it is the most potent DAC inhibiting agent
available on the market. In the present study, a new RP-HPLC method was developed which
shown high reproducibility and sensitivity. The developed method was validated as per ICH
guidelines.[5-11]
2. MATERIALS AND METHODS
2.1 Standards and Chemical Used
Panobinostat was gift sample for Noverties company, Hydrabad. All the chemicals
Acetonitrile HPLC Grade, HPLC grade Water.
2.2 Instrumentation
HPLC instrument used was of WATERS HPLC 2965 SYSTEM with Auto Injector and PDA
Detector. Software used is Empower. UV-VIS spectrophotometer PG Instruments T60 with
special bandwidth of 2mm and 10mm and matched quartz was be used for measuring
absorbance for Panobinostat solutions.
2.3Preparation of Mobile phase: Into a 1000ml cleaned volumetric flask, HPLC grade,
acetonitrile 400ml and Potassium dihyogen phosphate 600ml (0.01%w/v) which are filtered
through 0.25mm membrane filters by vacuum filtration were slowly added, mixed well and
sonicated upto 20min. Cool the above solution. This solution is again sonicated to 10min.
Cool the solution to room temperature and use for chromatography method.
2.4 Preparation of Standard stock solutions: Accurately weighed 5mg of Panobinostat
transferred 25ml of volumetric flask, and 3/4 Th of diluents was added and sonicated for 10
minutes. Flasks were made up with diluents and labeled as Standard stock solution (200µg/ml
of Panobinostat).
Preparation of Standard working solutions (100% solution): 1ml of Panobinostat from
each stock solution was pipetted out and taken into a 10ml volumetric flask and made up with
diluent. (20µg/ml of Panobinostat).
2.5 Preparation of Sample stock solutions: 5 capsules were weighed and the average
weight of each tablet was calculated, then the weight equivalent to 1 capsule was transferred
the volume was made up with diluent and filtered by HPLC filters. (200µg/ml of
Panobinostat).
Preparation of Sample working solutions (100% solution): 1ml of filtered sample stock
solution was transferred to 10ml volumetric flask and made up with diluent. (20µg/ml of
Panobinostat).
2.6 RP-HPLC Method Development
Based onnature and solubility characteristics of Panobinostat, reverse phase mode of HPLC
was selected for chromatography. Among different RP-HPLC stationary phases tried, C18
column was found to be optimum.
In order to get sharp peak with base line separation from interfering peaks carried out a
number of experiments by varying the composition of solvents and mobile phase flow rate.
To have an ideal separation of the drug under isocratic conditions, mixtures of solvents like
methanol, water and acetonitrile with or without different buffers in different combinations
were tested as mobile phase. A mixture of 0.01% KH2PO4 : Aceto nitrile (60:40) (v/v) was
proved to be the most suitable of all the combinations, since the chromatographic peak
obtained was better defined and resolved and almost free from tailing. The chromatographic
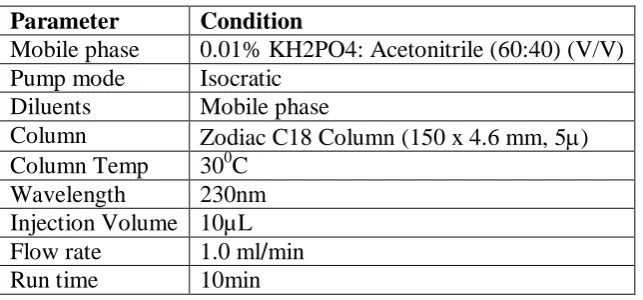
[image:3.595.139.461.497.647.2]conditions for the estimation of Panobinostat were discussed in table.
Table 1: Optimized chromatographic conditions for estimation of Panobinostat.
Parameter Condition
Mobile phase 0.01% KH2PO4: Acetonitrile (60:40) (V/V)
Pump mode Isocratic
Diluents Mobile phase
Column Zodiac C18 Column (150 x 4.6 mm, 5)
Column Temp 300C
Wavelength 230nm
Injection Volume 10µL
Flow rate 1.0 ml/min
Run time 10min
3. RESULT AND DISCUSSIONS
3.1 Analysis of Formulation
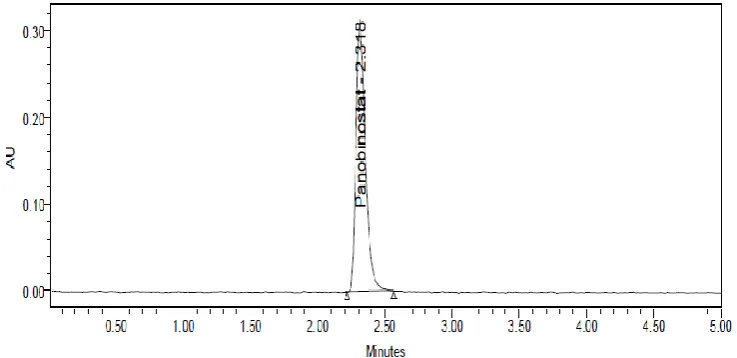
The sample solution was injected and a chromatogram was recorded. The injections were
repeated six times and the peak areas were recorded. The amount of drug present in the
µg/ml was taken on X –axis and average peak area on Y –axis). A representative
[image:4.595.114.483.135.314.2]chromatogram has been given in Fig. 1.
Fig. 1: Chromatogram of Panobinostat.
3.2 Validation of the Proposed Method
As an integral part of analytical method development is validation. The proposed method
was validated as per ICH guidelines.
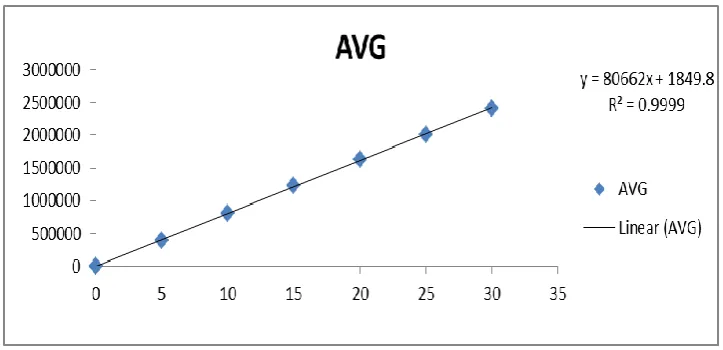
3.2.1 Linearity
To demonstrate the linearity of assay method, inject 5 standard solutions with concentrations
of about 5 ppm to 30ppm of Panobinostat. Plot a graph to concentration versus peak area.
Slope obtained was y = 80662x + 1849 and Correlation Co-efficient was found to be 0.999
and Linearity plot was shown in table.
Table 2: Linearity Results of Panobinostat.
Linearity Level (%) Concentration (ppm) Peak Area
0 0 0
25 5 394835
50 10 809969
75 15 1224311
100 20 1627235
125 25 2013229
Fig. 2: Linearity Plot.
3.2.3 Precision
Repeatability: Six working sample solutions of 20ppm are injected and the % Amount found
was calculated and %RSD was found to be 0.2.
Intermediate precision: Five working sample solutions of 20ppm are injected on the next
day of the preparation of samples and the % Amount found was calculated and %RSD was
found to be 0.3.
32.3. Ruggedness
The ruggedness of the method was determined by carrying out the experiment on different
instruments like Shimadzu HPLC 2965 SYSTEM, Aglient HPLC By different operators
using different columns of similar type like Hypersil C18 Hichron C18. It was observed that
there were no marked changes in the chromatograms, which demon started that the RP-HPLC
method developed, is ruggedness.
3.2.4Limit of Detection and Limit of Quantification
A Calibration curve was prepared using concentrations in the range of 5-30 µg/ml (expected
detection limit range). The standard deviation of Y-intercepts of regression line was
determined and kept in following equation for the determination of Detection limit and
Quantitation limit. The results were reported in table 3.
Limit of detection = σ × 3.3
S
Limit of quantification = σ × 10
Where,
σ = the standard deviation of the response.
S = the slope of the calibration curve.
Table 3: Limit of Detection and Limit of Quantification for Panobinostat.
Parameter Values
Limit of Quantification 0.151µg/ml Limit of Detection 0.050 µg/ml
3.2.5 Accuracy: The accuracy of the method was determined by standard addition method. A
known amount of standard drug was added to the fixed amount of pre-analyzed sample
solution Three Concentrations of 50%, 100%, 150% are Injected in a triplicate manner and
%Recovery was calculated as 100.15%. And chromatograms were shown in fig 3 Recovery
ranging from 99.12 to 101.04% were obtained by the proposed method.
Table 3: Accuracy data.
% Level Amount Spiked
(μg/mL)
Amount recovered
(μg/mL) % Recovery Mean % Recovery
50% 10 10.104 101.04
100.15%
10 10.023 100.23
10 10.040 100.40
100%
20 20.181 100.90
20 20.057 100.28
20 20.005 100.02
150%
30 30.039 100.13
30 29.771 99.24
30 29.737 99.12
3.2.6 Robustness: Small Deliberate change in the method is made like Flow minus, flow
plus, Mobile phase minus, Mobile phase plus, Temperature minus, Temperature Plus. %RSD
of the above conditions are calculated.
Table 4: Robustness Data.
Parameter % RSD
Flow Minus 1.6
Flow Plus 0.6
Mobile phase Minus 0.9
Mobile phase Plus 1.0
Temperature minus 0.8
3.2.8 System Suitability
A Standard solution of Panobinostat working standard was prepared as per procedure and
was injected five times into the HPLC system. The system suitability parameters were
evaluated from standard Chromatograms obtained by calculating the % RSD of retention
time, tailing factor, theoretical plates and peak areas from five replicate injections are within
range and Results were shown in table 5.
4. CONCLUSION
A convenient, rapid, accurate, precise RP-HPLC method has been developed for estimation
of Panobinostat. The proposed method followed the ICH guidelines. The proposed method
can be used for the routine analysis of Panobinostat in bulk preparations of the drug and in
pharmaceutical dosage forms without interference of excipients.
5. REFERENCES
1. B. k. Sharma, Instrumental methods of chemical analysis, Introduction to analytical
chemistry, 23rd Edition Goel publication, Meerut, 2007.
2. Lindholm.J, Development and Validation of HPLC Method for Analytical and
Preparative purpose. Acta Universitatis Upsaliensis, 2004; 13-14.
3. Rashmin, An introduction to analytical Method Development for Pharmaceutical
formulations. Indoglobal Journal of Pharmaceutical Sciences, 2012; 2(2): 191-196.
4. Malvia R, Bansal V, Pal O.P and Sharma P.K. A Review of High Performance Liquid
Chromatography. Journal of Global Pharma technology, 2010.
5. Douglas A Skoog, F. James Holler, Timothy A. Niemen, Principles of Instrumental
Analysis, 725-760.
7. David G. Watson. Pharmaceutical Analysis, A text book for Pharmacy students and
Pharmaceutical Chemists. Harcourt Publishers Limited; 2nd Ed., 221-232.
8. Remingtonn’s The Sciences and Practise of Pharmacy, 20th Edition, 2000.
9. Connors Ka. A Textbook of Pharmaceutical Analysis, Wiley intersciences Inc; Delhi, 3rd
Ed, 1994; 373-421.
10.Gurdeep R. Chatwal, Sham K. Anand, Instrumental Methods of Chemical Analysis, 2007;
2.566-2.638.
11.Nasal A., Siluk D., and Kaliszan R. Chromatographic Retention Parameters in Medicinal