warwick.ac.uk/lib-publications
A Thesis Submitted for the Degree of PhD at the University of Warwick
Permanent WRAP URL:
http://wrap.warwick.ac.uk/90832
Copyright and reuse:
This thesis is made available online and is protected by original copyright.
Please scroll down to view the document itself.
Please refer to the repository record for this item for information to help you to cite it.
Our policy information is available from the repository home page.
Exploring the Contribution of Individual
Differences and Planning Policy Parameters
to Demand Planning Performance
by
Alexander Alexandrovitch Kharlamov
A thesis submitted in partial fulfilment of the requirements
for the degree of
Doctor of Philosophy in Engineering
University of Warwick, WMG
TABLE OF CONTENTS
TABLE OF CONTENTS ... i
LIST OF FIGURES ... v
LIST OF TABLES ... vii
ACKNOWLEDGEMENTS ... ix
DECLARATION ... x
ABSTRACT ... xi
ABBREVIATIONS ... xii
1 Introduction ... 1
1.1 Research rationale ... 1
1.1.1 Imperfect decision makers ... 2
1.1.2 Working around human limitations ... 5
1.2 Demand planning ... 7
1.2.1 The importance of demand planning ... 7
1.2.2 Dealing with demand uncertainty ... 8
1.2.3 The problem with demand planning ... 9
1.3 The research gap and the subsequent research question ... 11
1.4 Thesis structure ... 14
1.5 Chapter summary ... 15
2 Demand planning: process, performance and support ... 17
2.1 Introduction ... 17
2.2 Demand planning process ... 17
2.2.1 Balancing supply and demand ... 17
2.2.2 Demand planning process ... 18
2.2.3 Planning horizon ... 20
2.2.4 The nature of available information ... 21
2.2.5 Statistical and judgemental forecasting process ... 23
2.2.6 Demand planning process summary ... 25
2.3 Demand planning performance ... 26
2.3.2 Demand planning process failures: system nervousness and naïve
interventionism ... 28
2.3.3 System nervousness ... 29
2.3.4 Naïve interventionism ... 31
2.3.5 Demand planning performance and individual differences ... 33
2.4 Humans and systems: supporting demand planning decisions... 34
2.4.1 Resisting the ‘machines’ ... 34
2.4.2 System guidance and restrictiveness ... 35
2.4.3 Supporting demand planning decisions ... 41
2.5 Chapter summary ... 41
3 Underpinning theory and hypothesis ... 43
3.1 Introduction ... 43
3.2 Rationality and decision making ... 44
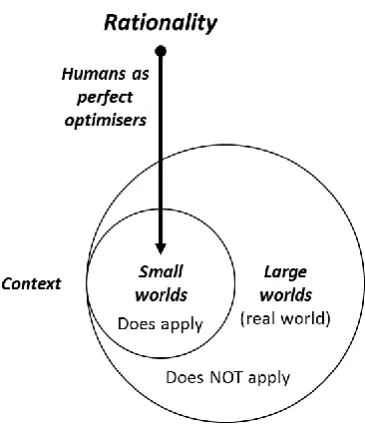
3.2.1 The unrealistic view of humans as perfect optimisers ... 46
3.2.2 The need for small and large worlds ... 47
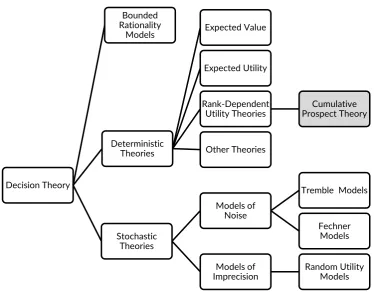
3.2.3 Model of human behaviour: deterministic versus stochastic theories and Cumulative Prospect Theory ... 50
3.2.4 Cumulative Prospect Theory ... 56
3.3 Myopic Loss Aversion ... 59
3.3.1 MLA analytical framework and hypotheses ... 62
3.4 Human and system: individual differences ... 65
3.4.1 Overview of individual differences ... 66
3.4.2 Individual exposure to demand planning processes: experience versus theoretical knowledge ... 69
3.4.3 Naïve interventionism hypothesis ... 72
3.4.4 Personality inventory: Big Five ... 73
3.4.5 Specific personality construct measures ... 73
3.4.6 Other individual differences ... 74
3.4.7 Individual differences hypothesis overview ... 75
3.5 Complete conceptual framework, testable hypotheses and predictions ... 76
3.6 Chapter summary ... 78
4.1 Introduction ... 81
4.2 Ontological and epistemological perspective ... 82
4.3 Decision making experiments: methodological considerations ... 83
4.3.1 Why experiment... 84
4.3.2 Experimental task ... 84
4.3.3 External validity ... 85
4.3.4 Compensation ... 86
4.3.5 Sample size requirements ... 87
4.3.6 Ethical considerations ... 87
4.4 Experimental task: newsvendor problem ... 89
4.4.1 Why newsvendor problem ... 89
4.4.2 Newsvendor problem origin ... 90
4.4.3 Decision making research using newsvendor ... 90
4.4.4 Newsvendor formulation ... 94
4.5 Measuring individual differences ... 96
4.6 Experimental design ... 98
4.6.1 Experimental design overview ... 98
4.6.2 Incentives ... 99
4.6.3 Target sample size ... 100
4.6.4 Experimental treatments ... 100
4.6.5 Measuring performance and individual differences ... 102
4.6.6 Information sheets ... 104
4.6.7 Informed consent and anonymity ... 105
4.6.8 Experimental procedure ... 106
4.6.9 Eligibility criteria ... 107
4.6.10 Other ethical considerations: Risks and Benefits ... 107
4.6.11 Experimental flow ... 108
4.7 Chapter summary ... 109
5 Results and analysis ... 111
5.1 Introduction ... 111
5.2 Overview of the framework and experimental treatments ... 111
5.3 Resulting experimental sample ... 112
5.5 Performance between treatments ... 117
5.6 Individual differences as predictors of performance in hybrid treatment ... 120
5.7 Chapter summary ... 132
6 Conclusions ... 135
6.1 Introduction ... 135
6.2 Summary of the research ... 135
6.3 Findings ... 137
6.4 Contribution ... 140
6.4.1 Contribution to theory ... 140
6.4.2 Contribution to practice ... 144
6.5 Limitations ... 146
6.6 Further research ... 151
6.7 Final reflection ... 153
REFERENCES ... 155
APPENDICES ... 169
Appendix A Mini-IPIP scale ... 170
Appendix B EPO scale ... 171
Appendix C BIS scale ... 172
Appendix D GDMS scale ... 173
Appendix E Participant targeting groups ... 174
Appendix F Experiment code (JavaScript) ... 175
Appendix G Graphical user interface ... 180
Appendix H Electronic information sheet (professionals) ... 181
Appendix I Consent form (professionals) ... 183
Appendix J Invitations for participation ... 184
Appendix K Sample individual report ... 185
Appendix L Summary statistics of individual differences by group and by treatment (normalised values) ... 188
Appendix M Stability analysis of personality scales ... 190
LIST OF FIGURES
Figure 1 Bounded Rationality (based on Simon, 1955, 1956, 1990) ... 3
Figure 2 Summary of the main contributions of this thesis ... 13
Figure 3 Human and System base framework to consider decision-making 15 Figure 4 Positioning of demand planning (Stadtler et al. 2015, p.180) ... 19
Figure 5 Demand planning process (Stadtler et al., 2015, p.153) ... 20
Figure 6 The stages of the forecasting process in the demand planning process (adapted from Stadtler et al., 2015, p.153) ... 24
Figure 7 Main factors causing demand-planning failures ... 28
Figure 8 Decision support guidance and restrictiveness (based on Silver 1991) ... 36
Figure 9 Demand planning process base framework ... 42
Figure 10 Concept of Small and Large worlds (based on Savage 1961) ... 48
Figure 11 Classical view of rationality reduced to small worlds ... 48
Figure 12 Decision Theory as a building block for Research Methodology . 51 Figure 13 Accuracy-effort trade-off ... 53
Figure 14 Accuracy-effort trade-off and Less-is-more effect ... 54
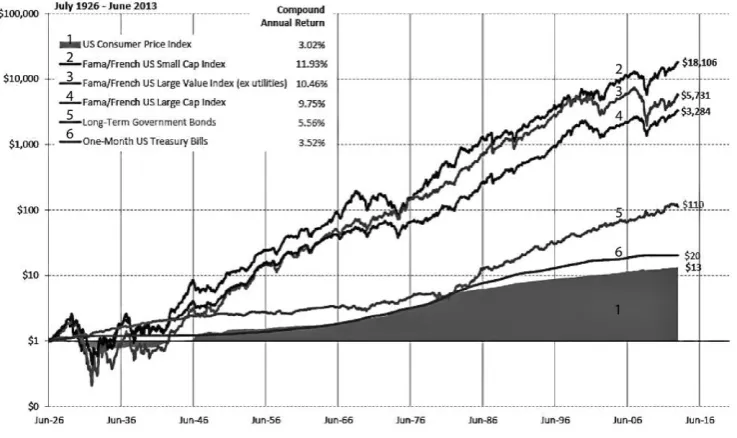
Figure 15 Value function of prospect theory (Kahneman & Tversky 1979) 58 Figure 16 An Illustration of Equity Premium Puzzle (source: Ibbotson Consulting) ... 60
Figure 17 Analytical framework for demand planning decisions... 63
Figure 18 Exposure-Performance Matrix ... 72
Figure 19 Conceptual framework focused on individual differences ... 76
Figure 20 Complete Conceptual Framework ... 77
Figure 21 Representation of the experimental treatments ... 102
Figure 22 Experiment design ... 108
Figure 23 Conceptual Framework, Experimental treatments and hypothesis ... 112
Figure 24 Study Overview: Sample and Incentives ... 113
Figure 25 Conceptual framework, hypothesis and results (grey = confirmed) ... 138
LIST OF TABLES
Table 1 Thesis structure ... 15
Table 2 Chapter 2 Structure ... 17
Table 3 Types and source of available information (based on Fields et al. (2006)) ... 22
Table 4 Typology of deliberate decision guidance (adapted from Silver, 1991) ... 37
Table 5 Means of system restrictions (based on Fildes & Beard, 1992; Fildes et al. 2006; Goodwin et al. 2011) ... 40
Table 6 Chapter 3 structure ... 43
Table 7 Chapter 5 structure ... 81
Table 8 Individual Differences Questions ... 97
Table 9 Population and its sub-groups ... 99
Table 10 Summary of experimental treatments... 101
Table 11 Chapter 6 structure ... 111
Table 12 Naïve Students: Comparison of Incentivised and Non-Incentivised Experiment ... 116
Table 13 Comparison of Performance in Planning Task by Treatment and Sample ... 118
Table 14 Regression equations estimated by an OLS for Hybrid treatment (dependent variable – payoff in Newsvendor Game) – A: Naïve students ... 123
Table 15 Regression equations estimated by an OLS for Hybrid treatment (dependent variable – payoff in Newsvendor Game) – B: Sophisticated Students ... 124
Table 16 Regression equations estimated by an OLS for Hybrid treatment (dependent variable – payoff in Newsvendor Game) – C: Professional Planners ... 125
Table 17 Results of the Multinomial Logit Regressions for Hybrid Treatment (dependent variable – sample; base category – Theory planners/sophisticated students) – A: Naïve Students (Naïve planners) vs Sophisticated Students (Theory planners) ... 127
Table 19 Clustered OLS regression for sophisticated students and sophisticated non-students ... 131 Table 20 Gender results by sample (profit and N subjects in brackets) ... 132
ACKNOWLEDGEMENTS
Thank you single life, caffeine, Google, Wikipedia and my supervisors, Jan and Ganna for making this possible.
DECLARATION
ABSTRACT
Demand planning (DP) is important for business performance. DP depends both on managers and on supporting systems. Managers are known to increase uncertainty by systematically overriding the systems and making unnecessary judgemental adjustments. This is a behavioural problem. Systems are assumed to be represented by different policies and individual differences by measurable traits and characteristics. The contribution of individual differences and policy parameters to DP performance is not clear.
A framework is proposed based on the cumulative prospect theory (CPT) and myopic loss aversion (MLA). Methodology of decision making experiment based on the newsvendor is used. Individual differences are collected using previously validated psychometric scales and demographic questions. The sample (N=339) includes three main groups: professional planners (N=84), naïve students (N=166), logistics and supply chain management (L&SCM) students (N=56).
The MLA hypothesis is supported. Longer planning horizons (less frequent decisions) outperforms short planning horizons. Regarding individual differences, only experience/knowledge and naïve interventionism are significant predictors of DP performance. L&SCM students with theoretical knowledge but without practical experience perform the best. No significant difference in performance is found between professional planners and naïve students. Naïve interventionism (plan instability) contributes negatively to DP performance. Personality (Big Five), impulsiveness, propensity to plan, decision-making style or demographics (e.g. age, sex, and years of experience or managerial level) are not significant for DP performance.
ABBREVIATIONS
ACT Adaptive Control of Thought theory AI Artificial Intelligence
APS Advanced Planning Systems BIS Barratt Impulsiveness Scale BOR Behavioural Operations Research CPT Cumulative Prospect Theory DM Decision Making
DP Demand Planning DS Decision Support
DSS Decision Support Systems EPM Exposure-Performance Matrix EPO Elaboration on Potential Outcomes ERP Enterprise Resource Planning ETO Engineer-to-Order
EUT Expected Utility Theory EV Expected Value theory GBP Great Britain Pound
GDMS Global Decision Making Style GUI Graphical User Interface HTML Hyper Text Mark-up Language IS Information Systems
IT Information Technology JS Java Script
MBA Masters of Business and Administration mIPIP Mini International Personality Item Pool MIS Management Information Systems MLA Myopic Loss Aversion
MPC Manufacturing Planning and Control MRP Materials Requirement Planning MRP II Manufacturing Resource Planning MSc Masters of Science
MTF Make-to-Forecast (manufacture-to-forecast) MTO Make-to-Order (manufacture-to-order) MTS Make-to-Stock (manufacture-to-stock) MWW Mann-Whitney-Wilcoxon
N (n) Number
NI Naïve Interventionism
O&SCM Operations and Supply Chain Management OLS Ordinary Least Squares
OM Operations Management OR Operations Research
PCA Principal Component Analysis RDU Rank-Dependent Utility
SC Supply Chain (SCs for Supply Chains) SCIP Supply Chains In Practice (research group) SCM Supply Chain Management
1
Introduction
1.1
Research rationale
"A bad system will beat a good person every time"
William Edwards Deming1
On 13th of October 2012, two pilots on the Sriwijaya Air flight SJ-21 ignored
the cockpit navigation system that they assumed to be faulty. They made a ‘visual approach’ landing an Indonesian passenger plane carrying 96 people relying on their own navigational skills – only to discover they were at the wrong airport. The incident report2 was only released 4 years later, on the
12th of October 2016. This was not the first time this mistake had happened
and preventive measures were in place. Pilots flying in the region must carry an information plate with a map and a chart with instructions containing a warning that the airport of Tabing can be mistaken for Minangkabau. They were operating in a repetitive and mostly controlled system with state of the art navigation technology enabling visibility and comprehensive failure prevention systems. Regardless, the SJ-21 pilots decided they knew better and landed at the wrong airport. Such level of control, technological sophistication, and skill requirements are unthinkable in most business activities, yet, mistakes caused by human judgement still happen.
Deming (1986) suggested that people’s best efforts can be destructive when carried out without knowledge, understanding of variation or when the system is broken. Unnecessary actions, regardless of good intentions, are damaging. Businesses are complex systems of exchange with supply of and demand for goods, services, or both (Simon 1979; Deming 1986). Businesses are supervised by humans which are complex systems themselves (Jung
1 The quote by W. Edwards Deming originally appeared on a Deming Four
Day seminar in Phoenix (Arizona) in February 1993
2 The report with reference KNKT.12.10.21.04 can be downloaded at:
1951; Deming 1986; Buss & Hawley 2010). Hence, when businesses fail, it could be because of faulty systems within but it could also be because of humans who design and operate these systems (Deming 1986). Deming (1986) warns that management can create the best systems, understand variation and possess knowledge but still fail if there is no understanding of psychology (people).
The attention to the importance of understanding both the system and the human simultaneously to ensure business success has been growing (e.g., Blattberg et al. 1990; Fildes et al. 2006; Kremer et al. 2011; Moritz et al. 2013). This research considers both the human and the system in a particular type of decision-making task – demand planning (DP) decisions – seeking to contribute to the debate on the human versus systems.
1.1.1
Imperfect decision makers
As the human decision making ability is not perfect, humans sometimes require additional support in order to make good decisions (e.g., Kahneman & Tversky 1972; Tversky & Kahneman 1991). People make decisions constrained by both their cognitive resources and the task environment, a concept known as bounded rationality (Simon 1955; Simon 1956; Simon 1990). As a result of these limitations, people might systematically fail to cope with uncertainty, e.g., while making predictions or judging probabilities (e.g., Tversky & Kahneman 1974; Einhorn & Hogarth 1981; Benartzi & Thaler 1995). Uncertainty is common to most decision-making and is what makes it often very challenging. Failures of judgement or reasoning have been repeatedly demonstrated in different studies (e.g., Tversky & Kahneman 1974; Kleinmuntz 1990; Ouwersloot et al. 1998; Bazerman 2005; Lin et al. 2014). As a result, it is commonly accepted that human judgement alone is often insufficient and sometimes is prone to errors.
p.1499) as ‘…mistakes are fun! Errors in judgement make humorous anecdotes,
but good performance does not.’ As a result, there is a generalised prejudice
against the human ability to make decisions. After reviewing the literature on decision making, Lopes (1991, p.65) also observed the over-citation of publications reporting on human errors and noted that the literature provided
‘widely published claims that human judgement abilities are poor’. However, the
alternative view takes into account what type of tasks are demanded from human judgement. Therefore, it is incorrect to assume that human judgement is generally poor. Humans are simply expected to perform well in inappropriate circumstances. Human judgement excels in many other circumstances (see Dreyfus 1992).
Studying errors provides insight into how human judgement (in particular) and how cognitive systems (in general) work (Funder 1987). Many of these errors can be explained using rather simple behavioural biases. The notion of bias comes from the deterministic approach to choice, the Deterministic Theory (DT). DT is where the preference is predicted using a normative model and
systematic deviations to the prediction constitute the bias. Biases are usually
stable and often resistant to training (e.g., Bolton & Katok 2004). The degree to which an individual is prone to suffer from biases potentially depends on individual differences (e.g., Stanovich & West 2000; Shiloh et al. 2002; Oreg & Bayazit 2009).
Figure 1 Bounded Rationality (based on Simon, 1955, 1956, 1990)
(heuristics) to make decisions. These decision rules / frameworks are strategies to deal with human limitations and the complexity of the real world. Such a view of decision-making is largely explanatory in nature and does not enable reliable predictions of human behaviour. Bounded rationality is built on two main elements (depicted on Figure 1), the task environment and actors’ cognitive ability (or cognitive resources).
Considering the task environment, the world is far too complex to be seized or perfectly understood by the human mind. Most real-world problems may trigger behaviour which cannot be explained by a standard ‘rational’ decision-theoretic model, where utility-maximizing agents are assumed to select optimal responses (Simon 1955; Simon 1979). Behaviour is shaped by its environment (e.g., Simon 1969; Gigerenzer 2001; Todd & Gigerenzer 2007; Wilke & Todd 2010; Gigerenzer & Gaissmaier 2011). Todd et al. (2012) suggest that environmental structures include:
1. Uncertainty: how well a criterion can be predicted 2. Redundancy: the correlation between cues3
3. Sample size: number of observations (relative to number of cues) 4. Variability in weights: the distribution of the cue weights (e.g., skewed
or uniform)
Taking each of these points in turn. First, usually uncertainty determines the decision making approach. For example, the simpler the decision making approach is, the more robust it is. An example is the elementary hiatus
heuristic, ‘a one-reason’ heuristic used to determine active and inactive
customers. It is known to outperform more complex models with more information mostly because the decision making environment is highly uncertain (Hogarth & Karelaia 2007; Wübben & Wangenheim 2008). This can potentially explain why simple management frameworks are so widely used. Second, redundancy also tends to benefit the accuracy of inference strategies. For example, simple managerial heuristics tend to perform as well as strategies that integrate all available information in moderate to high
information redundancy while the opposite situation benefits the integration of more information (Dieckmann & Rieskamp 2007). Third, as is suggested by the Law of Large Numbers (von Mises 1957), sample size generally tends to have a positive correlation with the accuracy of predictive models (Sedlmeier & Gigerenzer 2000). Consequently, it is beneficial to use more robust (simpler) models for smaller samples (Hogarth & Karelaia 2007). Finally, variability in weights introduces the idea of uniformity and skewness, where simple heuristics fit decisions in environments of moderate to high variability better than more complex models (Hogarth & Karelaia 2007).
Considering the decision-maker’s cognitive ability, the actor can use logic, statistics (Tversky & Kahneman 1983), or heuristics (Gigerenzer & Gaissmaier 2011) to make decisions in complex environments. Gigerenzer and Gaissmaier (2011, p.454) define heuristics as “…a strategy that ignores part of
the information, with the goal of making decisions more quickly, frugally, and/or accurately than more complex methods.” Heuristics are developed naturally or
artificially to simplify the cognitive strain and to enable not perfect, but often ‘good enough’ (satisficing) decisions (Shah & Oppenheimer 2008). Simon (1990) considers the limited computational capabilities of an agent as being recognition, memory and reaction. Models of cognition can get extremely complex and detailed, hence, for the sake of simplicity, it will be assumed that human behaviour is limited on the three basic levels (Simon 1969; 1987; 1990).:
(i) The number of items they can memorise is relatively small, i.e., humans have limited short-term working memory;
(ii) Recognition is powerful and quick but not instantaneous and is dependent on previous knowledge recall;
(iii) Reaction is not instantaneous.
1.1.2
Working around human limitations
relatively quick access to vast amounts of working memory. The ability to rely on external tools in order to process intensive repetitive tasks dramatically changed the ‘accuracy-effort trade-off curve’. The accuracy-effort trade-off is a power distribution type curve relationship between the quality of the decision (accuracy) and cost (effort), i.e., the greater the effort, the greater the accuracy (Payne et al. 1993; Kruglanski & Gigerenzer 2011).
Artificial systems have the potential to automate a number of tasks. Uptake is limited by both technological limitations as well as user preference. The idea of relying solely on the artificial system ‘…for making important decisions
that do not depend heavily on human inputs seems unlikely as well as unattractive’ (Edwards & Fasolo 2001, p. 588). People (in general) and experts
(in particular) have a long history of resistance to ‘machines’ taking over decisions and judgements (Meehl 1954).
Technology and more specifically Decision Support Systems (DSS), should not focus on unilateral control of the decision-making process but rather enhance the human decision making processes. This can take four forms (Larrick et al. 2004, p. 330):
i) Basic normative algorithms that are known to be unnatural and hard to implement or remember for humans can be assigned to DSS.
ii) Analytical decision tools and decision algorithms that are otherwise intimidating and hard to understand can be incorporated in a user-friendly DSS.
iii) The thankless task of consistency checks, such as criteria weights or probabilities, can be made less intrusive, faster and effortless if performed by a DSS.
iv) DSS can perform sensitivity analysis.
directive is ‘…how our mind’s design, relying on decision mechanisms tuned to
specific environments, should be taken into account in our technology’s design, creating environments that can enable better decisions’ (Todd 2007, p.1317).
1.2
Demand planning
1.2.1
The importance of demand planning
Planning is one of the most important processes in business and operations management (OM) (Lee 2004). It relies heavily on decision-making and decision support. The performance of planning activities in a demand-supply network is highly dependent on the DP outputs (Chen et al. 2007). This makes DP central to the concept of supply chain (SC) (Christopher 2011, p.13) because DP is essential for balancing supply and demand. It allows the company to reduce its purchasing, production and logistics costs as well minimizing inventory necessary to buffer for uncertainty.
To understand the importance of DP it is important to consider its implications on the supply and demand mismatch (Stadtler et al. 2015). One of the most common means of addressing uncertainty is by holding inventory that buffers variation. Inventory costs are commonly estimated to be 20% on average across different industries globally, however, this is often an underestimation.4 These costs come in many forms. For example, inventory
costs cash and the interest on that cash, insurance and taxes on inventory, labour to handle the inventory, warehouse rent costs to store the inventory, are just some of the examples. On the extreme end, failure to anticipate demand can result in complete inability to satisfy the customer and to do business (Stadtler et al. 2015). This could result in a disruption and usually has implications on the whole SC: ‘Disruptions occur here from a mismatch between
a company’s projections and actual demand as well as from poor supply chain coordination. Consequence of which are costly shortages, obsolescence, and inefficient capacity utilisation. An important issue in this context, affecting forecast quality and therefore demand-side disruptions, is the bullwhip effect,
which is characterised by an amplification of demand volatility in the upstream direction of the supply chain’ (Wagner & Bode 2006, p.304).
In practice, it is extremely difficult to accurately calculate the total cost of the supply and demand mismatch as such calculations need to often involve subjective values such as (potential or real) opportunity cost or reputation. For example, in 2013, poor inventory management cost Walmart $3 billion. The situation was contradictory because its inventory was growing faster than its sales but the merchandise was not on the shelves for customers to buy. This seriously damaged the Walmart’s reputation.5
DP is the starting point for SC planning and its quality will affect all subsequent planning activities (Chen et al. 2007). Central to DP is forecasting (Stadtler et al. 2015). Forecasts are critical for OM and integrated part of functions of scheduling, resource planning, and marketing (Fildes et al. 2006). Generally, the forecast within a plan combines managerial judgement with statistical forecasts within a support system. This means that forecasts incorporate decisions under uncertainty involving humans and systems.
1.2.2
Dealing with demand uncertainty
One of the main challenges of DP is dealing with the demand uncertainty (Lee et al. 1997; Geary et al. 2006). Demand uncertainty makes the demand signal one of the most unreliable sources of information in the SC (Geary et al. 2006). In general, the further upstream in a supply-demand chain, the greater the demand uncertainty as it is propagated and magnified (Lee et al. 1997; Geary et al. 2006). This makes the DP performance one of the greatest challenges in management and its improvement is a priority for business success.
Demand uncertainty has different sources, uncertainty can be natural but often much is caused both by the planning systems as well as by managers themselves (Lee et al. 1997). There is no clarity about what the different contributions to uncertainty are and how they can be addressed, especially
regarding managers. For example, Wu and Katok (2006) show that training can improve individual knowledge and understanding of the system, which consequently reduces behavioural issues causing uncertainty. However, Sterman and Dogan (2015) conclude that irrational behaviour still persists even with training and perfect visibility across the chain – managers could not resist the urge to introduce uncertainty under conditions of certainty. This highlights an important problem with DP that must be better understood.
1.2.3
The problem with demand planning
The DP task, especially forecasting under uncertainty, is hard. Contrary to the belief that greater effort leads to better results, sometimes unnecessary effort can have negative consequences and lead to worse results (e.g., see Katsikopoulos 2010). Childerhouse et al. (2003, p.135) highlight that ‘…much
uncertainty is induced by “players” [managers] within the system as opposed to being introduced by the marketplace.’ In practice, managers show relatively
little adherence to the original plan (Harrison, 1997). After the plan is developed, managers often intervene and make changes due to mistrust, second-guessing, over-reactions, and fear of losing sales (Niranjan et al., 2009). Unnecessary interventions with the plan often have negative effects on the whole SC (Niranjan et al., 2009). Examples of unnecessary interventions include hoarding and phantom ordering, which are often triggered by emotional impulses (Sterman & Dogan 2015).
in extra costs, e.g., inventory, markdowns, stock-outs or obsolescence (e.g., Niranjan et al., 2009).
Managerial interventions are especially problematic for forecasting in DP. There is strong evidence that combining managerial judgement with statistical forecasts in support systems negatively affects accuracy (Fildes et al. 2006) and, consequently, has an adverse effect on DP performance. Part of the issue comes from people’s preference towards their own intuition (‘gut’) as opposed to the artificial rationale in the form of formulas, statistical or mechanical procedures (Meehl 1954; Kleinmuntz 1990; Dane et al. 2012), etc. While intuition and judgement can be extremely powerful in some situations (e.g., see Syntetos et al. 2016), it can also lead to judgement errors and biases (e.g., Tversky & Kahneman 1974). Business management is no exception to this problem (Lawrence et al. 1986; Lim & O ’connor 1995; Bazerman 2005; Fildes & Goodwin 2007).
adjustments to the statistical forecast, which are still not ‘good enough’ when compared to better alternative statistical models (Goodwin et al. 2007).
1.3
The research gap and the subsequent research
question
To date, literature on decision making in planning tasks primarily focused either on systems, management or on individual behaviour separately. On the one hand, decision making literature (behavioural economics and psychology) offers many different explanations to some sub-optimal performance in the real world (e.g., Tversky & Kahneman 1974; Schwenk 1988; Bazerman 2005). This sub-optimal performance is observed in the form of systematic deviations (biases) from normative expectations and theoretical optima. Moreover, trait theory from psychology literature suggests that individual differences play a significant role in explaining group heterogeneity and differences in decision making performance (Weber & Milliman 1997; John et al. 2008; Fleeson & Jayawickreme 2015). On the other hand, decision support literature has looked into improving the way systems support human decision-makers (Leighton 1981; Silver 1991; Burstein & Holsapple 2008; Goodwin et al. 2011). Finally, OM and operations research (OR) literature describes a wide variety of the challenges in business, many of which are caused by both management systems as well as individuals, highlighting behavioural issues in the context of operations and supply chain management (O&SCM) (e.g., Lee et al. 1997; Geary et al. 2006; Bendoly 2006; Carter et al. 2007; Niranjan et al. 2009; Kaufmann et al. 2010).
similar to the ones made in DP (Franken & Muris 2005; Lapide 2007; Moritz et al. 2009). Similarly, how decision-makers interact with DSS to make DP decisions received significant attention (O’Connor et al. 1993; Fildes & Hastings 1994; Webby & O’Connor 1996; Parackal et al. 2007).
Following the call for theory in O&SCM (Carter 2011) and current absence of solid explanations behind some clearly observed behavioural issues in the literature (Bolton & Katok 2008; Gans & Croson 2008; Croson, Schultz, et al. 2013), it is necessary to borrow theory from other relevant fields to seek an explanation. Without theoretical understanding of the behavioural mechanisms governing the ill behaviour of managers, it is hard to progress in understanding and solving the problem of sub-optimal decisions in DP.
Although problems related to human behaviour have been highlighted in previous OM and OR research, theoretical foundations explaining the observed behaviour require further development. The focus of the research on DP to date has been on the average behaviour of a large number of individuals (representative agent behaviour) which is different from concentrating on individual heterogeneity in DP tasks (individual differences). While there is certainly great value in observing the average of a large sample, in order to derive the basic behavioural principles in various environments, typically, DP decisions are made by individuals rather than groups of people and individual heterogeneity among planners in their propensity to generate successful plans is important. Therefore, it is important to explore individual differences in the context of OM (Croson & Donohue 2002; Gans & Croson 2008; Croson, Schultz, et al. 2013) as so far contributions relating to this aspect of DP decision making are limited (Zmud 1979; Strohhecker & Größler 2013; Moritz et al. 2013). It is still unclear why individuals behave in a certain way when making DP decisions and, hence, necessary to understand the relative contribution of individual factors and systems parameters to DP which lies at the core of this thesis.
The main research question is as follows: What is the contribution of individual
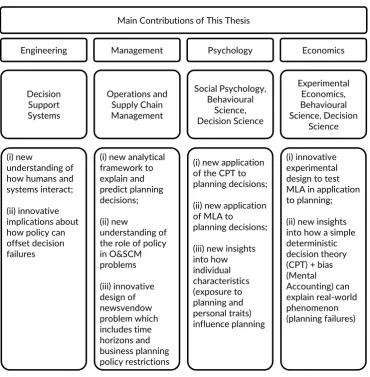
The aim of this research is to develop and test a theoretical framework drawing on theory from behavioural economics and psychology to identify planning policy parameters and individual traits that can be used to predict DP performance. The main contributions of this thesis can be split across four fields: Engineering, Management, Psychology, and Economics (Figure 2).
Figure 2 Summary of the main contributions of this thesis
For DSS, it is provided a new understanding of how humans and systems interact together with innovative implications of how policy can reduce decision failures.
For O&SCM it is suggested a new analytical framework explaining and predicting DP decisions. Moreover, it is provided new understanding of the important role of policy in O&SCM. Finally, the contribution to O&SCM is an
Main Contributions of This Thesis
Engineering Decision Support Systems (i) new understanding of how humans and systems interact; (ii) innovative implications about how policy can offset decision failures Management Operations and Supply Chain Management
(i) new analytical framework to explain and predict planning decisions; (ii) new understanding of the role of policy in O&SCM problems (iii) innovative design of newsvendow problem which includes time horizons and business planning policy restrictions Psychology Social Psychology, Behavioural Science, Decision Science
innovative design of the newsvendor problem that includes time horizons and DP policy restrictions.
For social psychology, behavioural science and decision science it is provided a new application of the Cumulative Prospect Theory (CPT) and Myopic Loss Aversion (MLA) to DP decisions. Additionally, a new insight is provided on how individual characteristics (e.g., exposure to DP and personality traits) influence DP performance.
Finally, the contribution to experimental economics, behavioural science and decision science is an innovative experimental design to test MLA in application to DP. A new insight is provided into how a simple deterministic theory (CPT) with the mental accounting bias (as part of the MLA) can explain real-world phenomena (sub-optimal DP decisions).
1.4
Thesis structure
Table 1 Thesis structure
Chapter Overview
Ch. 1 Introduction Provides the research rationale, introducing the relevance of DP and the associated problem of mangers’ behaviour followed by the research question. Thesis structure is outlined.
Ch. 2 Demand planning: process, performance and support
DP is explored in literature. The task is described along with its context and the types of decisions. The problem of DP
performance in form of instability, chaos, nervousness reviewed followed by the relationship between decision-makers and decision supporting systems.
Ch. 3 Underpinning
theory and hypothesis Because the problem of DP is greatly dependent on the individual behaviour, the literature review expands into
behavioural economics and psychology to explain the previously identified phenomena of sub-optimal DP performance. Along with the theoretical development relevant hypothesis are derived. The chapter closes with a conceptual framework. Ch. 4 Research design The ontological and epistemological positioning is explained
followed by the description of behavioural/ decision making experiment used to test the framework and respective hypothesis.
Ch. 5 Results and
analysis The experimental results are analysed using econometric methodology to test the hypothesis. Ch. 6 Conclusions The last chapter summarizes the research, includes the review of
the findings, contribution to both practice and theory, limitations, and suggest further research.
1.5
Chapter summary
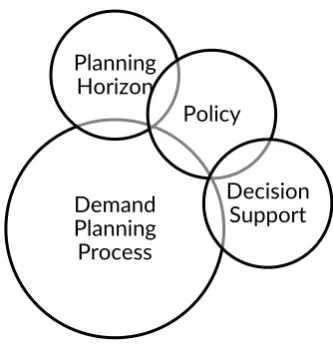
People’s best efforts can be destructive and unnecessary actions, regardless of good intentions, are damaging. Mistakes occur because humans are imperfect makers, and it is essential to consider both the decision-maker and the environment (system) in which decisions are made. The quality of decisions depends on both (Figure 3).
Figure 3 Human and System base framework to consider decision-making
DP is essential for business management. One of the main challenges in DP is making decisions under uncertainty and risk. Managers have a track record of making sub-optimal decisions in such context. Nonetheless, managers still trust their own judgement over decision support and statistical methods.
2
Demand planning: process, performance and
support
2.1
Introduction
[image:31.595.112.484.398.632.2]The structure of chapter 2 is outlined in Table 2. Section 2.2 positions DP in the broader context and presents the main concepts around DP that are required for understanding the potential implications of DP decisions. Section 2.3 describes DP performance where the concepts of system nervousness (from the system perspective) and naïve interventionism (from the human perspective) are introduced. Due to the challenge of DP, DSS are used. However, this comes with resistance and managers often choose to do differently. Decision support can either restrict decision-making or guide it. Its application in DP is discussed. These issues are discussed in section 2.4. The chapter closes with a summary of the key points.
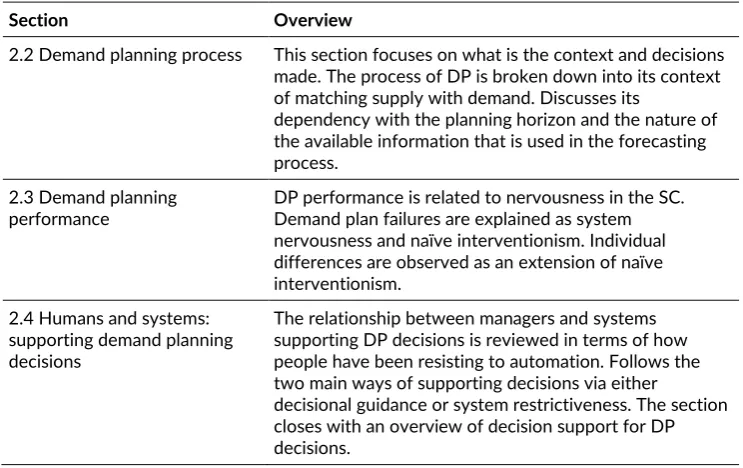
Table 2 Chapter 2 Structure
Section Overview
2.2 Demand planning process This section focuses on what is the context and decisions made. The process of DP is broken down into its context of matching supply with demand. Discusses its
dependency with the planning horizon and the nature of the available information that is used in the forecasting process.
2.3 Demand planning performance
DP performance is related to nervousness in the SC. Demand plan failures are explained as system nervousness and naïve interventionism. Individual differences are observed as an extension of naïve interventionism.
2.4 Humans and systems: supporting demand planning decisions
The relationship between managers and systems supporting DP decisions is reviewed in terms of how people have been resisting to automation. Follows the two main ways of supporting decisions via either
decisional guidance or system restrictiveness. The section closes with an overview of decision support for DP decisions.
2.2
Demand planning process
2.2.1
Balancing supply and demand
systems form networks which can be broadly referred to as SC. Christopher (2011, p.13) defines SC as a ‘...network of organizations that are involved,
through upstream and downstream linkages, in the different processes and activities that produce value in the form of products and services in the hands of the ultimate consumer’. The concept of SC is here used instrumentally as an
umbrella term for the broad effects of DP decisions.
DP, even when local or contained within an organisation, has implications beyond firms’ boundaries (Stadtler 2005). It is critical to think about DP considering the broader SC since the effects of bad DP will affect the rest of the chain. Failure to plan affects the SC upstream, e.g., in the form of the
bullwhip effect (Lee et al. 1997), and downstream, e.g., with disruptions
(Craighead et al. 2007). Bullwhip effect (also known as Forrester effect) is the amplification of demand caused by information distortion as the demand signal passes through the chain (Lee et al. 1997). DP helps to addresses one of the greatest challenges for any business which is minimising supply and demand mismatch (e.g., Vitasek et al. 2003; Christopher 2011).
Uncertain demand presents a particular challenge as it requires the ability to predict or react as quickly as possible (Christopher 2011). Underestimating demand is an issue as demand can then exceed supply, leading to out of stocks and poor customer service. Whilst overestimating demand does not affect customer service, as supply exceeds demand it can lead to the growth of costly inventory buffers.
2.2.2
Demand planning process
Figure 4 Positioning of demand planning (Stadtler et al. 2015, p.180)
Figure 5 Demand planning process (Stadtler et al., 2015, p.153)
Demand can be greatly influenced by business decisions. Demand is greatly affected by price promotions, new product launches, regional promotions and product bundling. These kind of decisions can be also referred to as demand shaping decisions (Lapide 2013) carried out primarily by marketing and sales managers. Although SC managers are not directly responsible for these decisions, it is critical to ensure that the supply meets the expected future demand as well as to advocate that demand shaping must consider the ability to supply (Lapide 2013).
The process of DP, whilst theoretically comprehensive, can fail in practice. First, the nature of available information that comes from many different sources is imperfect and information streams need to be optimised. Second, the transition between statistical and judgemental forecasting stages requires structuring and it is necessary to understand how it depends on planner’s cognitive ability and training. Third, it is important to understand the effect of the forecast horizon and its relationship with uncertainty. The process of DP considers the future. The future can be split as near or far future. Therefore, one of the main considerations to have in DP is the planning horizon.
2.2.3
Planning horizon
cases, intermittent forecasts can be significantly improved when managers provide input on irregularities (Syntetos et al. 2009; Syntetos et al. 2016).
Another important consideration about planning horizon concerns managers. Planning is arguably not a natural act, at least not for everybody. Hey and Knoll (2007, p.8) study experimentally the human propensity to plan in dynamic risky situations and conclude that ‘just over half of the subject plan
fully, while the rest do not plan ahead at all.’ Bone et al. (2009, p.12) conducted
a further experimental study and find that over half of the experimental subjects ‘do not appear to be planning ahead; moreover, their ability to plan
ahead does not improve with experience’. This means that those subjects think
only about immediate implications of their decisions and this behaviour is resistant to experience.
There is no general consensus on how far ahead in time short term and long term forecasting looks, as it is highly dependent on the context (Taylor & Thomas 1982; Armstrong 2001; Goodwin 2002). It is however generally accepted in SC literature that short term forecast considers the ‘next period
or periods’ and long term is ‘beyond the short term’ (Armstrong 2001).
Short-term forecasting is usually achieved with relatively simple procedures. Long term forecasting typically needs more than simple historical data analysis and goes beyond the extrapolation of the trend and seasonality. A common way to work around the issue of lower accuracy for long-term is by planning at a product family level rather than individual stock keeping units.
Finally, time horizon plays a major role in plan instability (Blackburn et al., 1986) and consequently affects business performance. For the purposes of this analysis, the focus is on the short-term time horizon as the majority of important DP problems occur within the short time frame.
2.2.4
The nature of available information
forecasts), earlier forecasts from previous periods, other forecasts and information on past forecast errors.
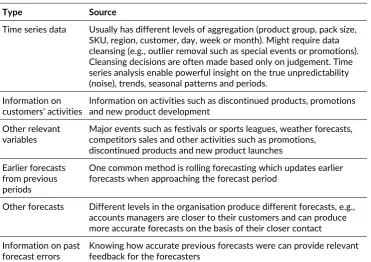
Table 3 Types and source of available information (based on Fields et al. (2006))
Type Source
Time series data Usually has different levels of aggregation (product group, pack size, SKU, region, customer, day, week or month). Might require data cleansing (e.g., outlier removal such as special events or promotions). Cleansing decisions are often made based only on judgement. Time series analysis enable powerful insight on the true unpredictability (noise), trends, seasonal patterns and periods.
Information on
customers’ activities Information on activities such as discontinued products, promotions and new product development Other relevant
variables Major events such as festivals or sports leagues, weather forecasts, competitors sales and other activities such as promotions, discontinued products and new product launches
Earlier forecasts from previous periods
One common method is rolling forecasting which updates earlier forecasts when approaching the forecast period
Other forecasts Different levels in the organisation produce different forecasts, e.g., accounts managers are closer to their customers and can produce more accurate forecasts on the basis of their closer contact Information on past
Additional sources of data can be greatly relevant in improving forecasting accuracy, in particular judgemental adjustments as irregular components can be considered. This includes information on activities such as discontinued products, price promotions, new product launches, regional promotions, product bundling, and other business decisions that can affect the demand. Additional relevant information can come from events such as major festivals (e.g., Beer Festival) or sports leagues (e.g., Premier League), weather forecasts (e.g., floods, rain seasons, and heat waves), competitors’ sales and other activities such as promotions, discontinued products and new product launches.
Earlier forecasts are also relevant information for DP as one common method of formulating new plans is rolling forecasting which updates earlier forecasts when approaching the forecast period so it considers historic forecasts. The same organisation usually produces many different forecasts with different levels of aggregation or focus, e.g., accounts managers are typically close to their customers and can produce accurate forecasts because of their close contact. Finally, previous forecast accuracy is relevant as knowing that a given product has been accurately forecasted before or systematically off target, will have implications on the approach and forecasting methods used.
2.2.5
Statistical and judgemental forecasting process
The forecasting stages of the DP process involve human beings at every stage. Employees and managers who perform the DP in general and the demand forecasting process in particular usually have experience in developing forecasts but have limited theoretical knowledge of forecasting errors and often lack formal training in statistics or statistical methods (Fildes & Hastings 1994). Forecast adjustments based on judgement often happen in managerial meetings under time pressure as well as lack of visual means and flexibility to provide a quick analysis (Fildes et al. 2006).
In practice, the demand forecasting process is often divided into two steps: (1) statistical forecast and (2) judgemental adjustment (Figure 6). Demand forecasting usually starts with the creation of a statistical forecast, often conducted automatically (when planners use a template model habitually applied in their organisation) or manually (when planners choose their own ‘custom’ model). After this, the planners make judgemental adjustments to the statistical forecast taking into account special factors (factors relevant to their organisation) as well as other available information (e.g., relevant externalities). The outcome of this two-step procedure is a set of final forecasts often developed for many different products. This set, in turn, is used to plan SC operations (Fildes & Beard 1992; Fildes et al. 2006). This procedure is often repeated weekly and, sometimes, daily making the demand forecasting process too large to be handled manually and requiring a great degree of automation. This means that planners have very short time frames to apply judgemental adjustments.
Figure 6 The stages of the forecasting process in the demand planning process (adapted from Stadtler et al., 2015, p.153)
Considering the process and components of the time-series, demand forecasts are set to capture two types of components (e.g., patterns, relationships, events), which, in turn, could be regular and irregular. Regular components are detected and explained by statistical models during statistical forecasting step and irregular (but foreseeable) components by planners in judgemental adjustment step. In principle, evidence (e.g., Goodwin & Fildes 1999; Goodwin et al. 2007; Fildes et al. 2009) suggests that statistical models (automated systems) outperform human judgement in identifying and modelling the regular components. In contrast, automated systems based purely on statistical models often fail to forecast irregular components (Lawrence et al. 1986; Goodwin & Wright 1993; Syntetos et al. 2009).
Preparation of demand planning structures and
historic data
Statistical forecasting
Judgmental forecasting (adjustment)
The combination of statistical forecasting and judgemental adjustment steps can often lead to greater accuracy than each step taken separately (e.g., Lawrence et al. 1986; Blattberg et al. 1990). The final forecast accuracy can be greatly improved especially when the manager adds extra irregular information that is not included (or is naturally ignored) in the statistical model (Mathews & Diamantopoulos 1990; Donihue 1993; Goodwin & Fildes 1999; Fildes & Stekler 2002). However, this is not always true as managers have a tendency to override the statistical forecast of the regular component (Goodwin & Wright 1993; Harvey 1995; Lim & O ’connor 1995; Goodwin & Fildes 1999; Sanders & Ritzman 2001; Sanders & Manrodt 2003). While judgemental adjustment is often necessary and beneficial to the demand forecasting process, it may also harm the forecast creating such problems as excess inventory (Sterman & Dogan 2015), amplification of demand (Lee et al. 1997), to name a few.
2.2.6
Demand planning process summary
DP enables customer service levels to be maintained at a lower cost, as less inventory needs to be held to buffer against the mismatch between demand and supply. DP is the starting point for the subsequent planning processes (e.g., precedes master planning). The DP process includes statistical forecasting followed by judgemental adjustments to consider both the regular and irregular patterns. Judgement can be very powerful to incorporate additional information in the forecasting process (e.g., Lawrence et al. 1986; Mathews & Diamantopoulos 1990; O’Connor et al. 1993). Such information is usually known future irregular events. Irregular events are usually ignored by statistical models. Examples of this are demand shaping business decisions, information about the competition. This is both good (e.g., in case of intermittent demand) and bad when the separation between regular and irregular components is not clear and managers adjust what is highly regular introducing irregularity artificially.
(Hey & Knoll 2007; Bone et al. 2009). Second, often managers working with DP lack formal training in statistics or statistical methods for forecasting (Fildes & Hastings 1994). And finally, managers have a general tendency to override the statistical forecast introducing unnecessary adjustments to the statistical forecast (Goodwin & Wright 1993; Harvey 1995; Lim & O ’connor 1995; Goodwin & Fildes 1999; Sanders & Ritzman 2001). This can significantly compromise DP performance.
2.3
Demand planning performance
The performance of DP is not the same as forecasting performance. The quality of a forecast is usually measured using accuracy estimates such as mean absolute deviation (MAD) or mean absolute percentage error (MAPE) while the performance of DP can be assessed in terms of profit, revenue or costs (Stadtler et al. 2015). Many issues can affect DP performance. The following sections focus specifically on DP performance from the system and manager’s perspective.
2.3.1
System nervousness in the supply chain
SC complexity and uncertainty forces cause ‘chaos’ in a SC (Christopher & Lee 2001). Whilst part of complexity and uncertainty is natural, part is artificially induced by people. The base assumption is that the majority of people across the SC want to make good decisions. However, Deming (1986) argued that people’s best efforts can be destructive when carried out without knowledge, understanding variation or when the system is broken. This is very likely to happen in conditions of complexity and uncertainty typical to most modern businesses and their SC’s. Chaos in SCs makes it impossible to make the right decisions hence it’s also impossible to design optimal solutions (Christopher & Lee 2001).
managers are not the only source of chaos. Several causes of chaos come from the system. Lee et al. (1997) suggest that information delays and distortion, order batching, shortage gaming, sales promotions, fluctuations of price and rationing contribute to chaos and instability in the SC.
An example of such chaos is the bullwhip effect (Lee et al. 1997) where variation greatly increases from downstream to upstream SCs. This effect of amplification of small variations has been earlier described by Forrester (1958) and named the Forrester Effect. Lee et al., (1997) suggests that the bullwhip effect is a consequence of the players’ rational behaviour within the SC and that companies wanting to control the bullwhip effect must focus on modifying the infrastructure and policy rather than the decision-makers’ behaviour. According to Lee et al., (1997), demand signal processing is one of the main contributors to the bullwhip effect as managers’ perceptions and mistrust lead to readjustment of the perceived demand forecast.
Deming (1986) refers to such chaos as ‘system nervousness’ which affects the SC performance: ‘This increased nervousness will of course lead to higher
costs and inefficiencies through over-ordering and “squirreling” inventory’
(Christopher & Lee 2001, p.2). DP can either dampen or amplify variation, affecting chaos. Hence, the performance of a SC is dependent on the DP performance.
Hence, part of the uncertainty comes from the system, however, some authors defend that ‘…much uncertainty is induced by “players” [managers]
within the system as opposed to being introduced by the marketplace.’
(Childerhouse et al. 2003a, p.135)
2.3.2
Demand planning process failures: system nervousness
and naïve interventionism
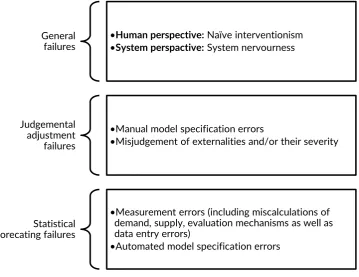
[image:42.595.124.484.290.567.2]In practice, there are many factors which may cause the DP process to fail (e.g., Kerkkänen et al. 2009; Stadtler et al. 2015). These failures include but are not limited to the following (see Figure 7).
Figure 7 Main factors causing demand-planning failures
Even after considering potential failures of statistical forecasting and judgemental adjustment, there are still general factors that may cause DP to fail. Specifically, the systems in which humans operate are characterised by inherent (endogenous) instability often labelled system nervousness. Furthermore, even if the plan is perfectly formulated and accurately takes into account system nervousness, humans may cause DP failures by simply not following the plan, i.e., they are unable to follow the plan and constant
General
failures •Human perspective: Naïve interventionism•System perspactive: System nervourness
Judgemental adjustment failures
•Manual model specification errors
•Misjudgement of externalities and/or their severity
Statistical forecating failures
•Measurement errors (including miscalculations of demand, supply, evaluation mechanisms as well as data entry errors)
cause serious problems (Lim & O ’connor 1995; Goodwin & Fildes 1999). For example, Fildes et al. (2009, p.3) analysed 60,000 forecasts and outcomes of four SCs and observed that not only most of the forecasts were adjusted, the ‘relatively larger adjustments tended to lead to greater average improvements in
accuracy, the smaller adjustments often damaged accuracy.’ This inability to
follow the plan and intervene will be called naïve interventionism.6 The
rationale behind naïve interventionism lies in the fact that managers have a tendency to intervene with the plan (earlier referred to as best efforts) and naivety comes from the lack of understanding of variation and knowledge. In what follows, the focus is on two general factors: System nervousness and Naïve interventionism.
2.3.3
System nervousness
Historically, nervousness was associated to the material requirement planning (MRP) systems and the two basic causes were uncertainty in supply/demand and variations in lot-sizing decisions (Whybark & Williams 1976). However, both causes and effects of the problem of nervousness is far greater in scope. The flow in SCs is usually managed either based on the demand of the first tier customer downstream (next immediate company in the chain) or on the demand of the end customer (ultimate consumer) in the total SC (Van Donselaar et al. 2000). Nervousness (in this case order instability) is a common problem in planning systems across the whole SC (Blackburn et al. 1985; Blackburn et al. 1986; Kadipasaoglu & Sridharan 1995). The assumption is that the opposite of system nervousness is system stability. System stability depends on plan stability. In planning systems,
‘…plan stability is affected by policy parameters’ (de Kok & Inderfurth 1997,
p.55).
Nervousness in the form of order instability causes frequent plan changes leading to adverse effects which propagate through the SC in form of increased cost, reduced productivity, lower service level, and a general state
6 The term ‘naïve interventionism’ is borrowed from Nicholas Nassim Taleb
of confusion in operations (Campbell 1971; Hayes & Clark 1985; Christopher & Lee 2001). Plan changes contribute to operational confusion and have negative impact on performance. ‘Confusion (…) refers to managerial actions
that disrupt the stability of the factory’s operations’ (Hayes & Clark 1985, p.10).
Confusion is also referred to as ‘chaos effects’ in SCs (Christopher & Lee 2001, p.2). Lack of planning stability and continual changes to the plan by the system, drive significant short-term and medium-term adjustment efforts and undermine management’s confidence in planning systems (Blackburn et al. 1985; de Kok & Inderfurth 1997).
Time horizon plays a major role in planning nervousness (Blackburn et al. 1986). Examining different planning heuristics (policies) in relation to the time horizon, Simpson (1999) identified that time-horizon sensitive logistics exhibit less nervousness than horizon-myopic ones.
Other factors rather than planning horizon is uncertainty in the timing or quantity of demand. Zhao and Lee (1993) looked at freezing the master production schedule under demand uncertainty for parameters such as planning horizon, freezing proportions, freezing methods and replanning periodicity. One of the findings on freezing the planning horizon in Zhao and Lee (1993) suggests that longer planning horizons worsens the performance under demand uncertainty conditions while improves the performance under deterministic demand conditions. However, Kadipasaoglu and Sridharan (1995) identify the freezing method as the most effective to reduce instability. . Comparing freezing different proportions of the planning horizon, it is suggested that freezing the whole planning period reduces instability under demand uncertainty (Zhao & Lee 1993). Considering the inverse relationship between period and frequency, if shorter planning periods increase instability, higher planning frequency contributes to instability as well. ‘Higher replanning periodicity results in a lower total cost, schedule
instability, and a higher service level under both deterministic and stochastic demand conditions. Less frequent replanning improves system performance’
There are several strategies to deal with system nervousness. No revision of decision within the planning horizon, also known as freezing the plan (Zhao & Lee 1993; Kadipasaoglu & Sridharan 1995). Freezing the whole planning period reduces instability under demand uncertainty (Zhao & Lee, 1993). This is sensitive to stock outs and must be combined with buffer stocks. One of the most effective to reduce changes but at a higher cost are buffer stocks which are also known as end-item safety stocks (Kadipasaoglu & Sridharan 1995). Finally, Ho (1989) suggests that enforcing the distinction between large and small changes affects nervousness.
2.3.4
Naïve interventionism
As it was mentioned earlier, Deming (1986) defended that best efforts can be damaging if carried out without understanding. The adopted designation in this thesis for efforts without understanding is naïve interventionism. The lack of confidence in the SC leads to actions and interventions by SC members who believe that they can do better by devising independent actions that undermine the overall performance of the SC (Christopher & Lee 2001). Similarly, unnecessary interventions upstream through the disregard of forecasts (even though they are often accurate) through the ‘we know best’ syndrome (Mason-Jones & Towill 1998, p.19) which is one of the identified information flow problems encountered in the practice of SCM. Overconfidence is suggested to be one of the main reasons why decision-makers show strong preference towards their own judgement and the tendency to introduce judgemental adjustments (Kleinmuntz 1990). Moreover, overconfidence can morph into a form of grandiose syndrome, taking an example from OEMs in Childerhouse et al., (2003b, p.141), that all players ‘…felt that they were pro-actively leading world-class supply chains and
saw no need to change their ways.’
Considering how important forecasting is for planning and decision-making, managers are also infamous. ‘Forecast errors are directly related to required
safety stocks, while frequent adjustments of demand forecasts can lead to dramatic changes in plans (i.e., nervousness)’ (Stadtler et al. 2015, p.582).
Managers intervene with their statistical forecasts (Fildes et al., 2009) and are generally over-confident in the accuracy of their adjustment (Brenner et al. 1996; Lawrence & Sim 1999; Moore & Cain 2007). One of the suggested reasons behind tweaking unnecessarily the statistical forecast (Lim & O ’connor 1995; Goodwin & Fildes 1999) as well as preferring judgement over quantitative models (Lim & O’Connor 1996) is incorrect calibration of user’s confidence (Fildes et al. 2006).
The separation between statistical and judgemental tasks is poorly implemented (Fildes et al. 2006). The two components are largely confused as planners often disregard the statistical analysis outputs of the regular component as well as mistaking noise for signal perceiving inexistent regularities and apparent patterns (Goodwin & Wright 1993; Harvey 1995; Lim & O ’connor 1995; Goodwin & Fildes 1999; Sanders & Ritzman 2001).
In practice, inputs from judgement adjustments and statistical forecast are hard to separate. For example, Fildes et al. (Fildes et al. 2006) points two instrumental cases in which managers made adjustments to the time series in terms of level, trend or seasonal factors before the statistical method attempting to improve its accuracy. This way the output of the statistical forecast is already greatly altered by judgement.