warwick.ac.uk/lib-publications
A Thesis Submitted for the Degree of PhD at the University of Warwick
Permanent WRAP URL:
http://wrap.warwick.ac.uk/90231 Copyright and reuse:
This thesis is made available online and is protected by original copyright. Please scroll down to view the document itself.
Please refer to the repository record for this item for information to help you to cite it. Our policy information is available from the repository home page.
From Supply Chain Integration to Operational Performance: The Moderating
Effect of Demand Uncertainty
by
Yi Ding
Dissertation
Submitted to the University of Warwick
For the degree of
Doctor of Philosophy
Supervisor: Dawei Lu Warwick Manufacturing Group
Table of Contents
ABSTRACT ... 1
CHAPTER 1 INTRODUCTION ... 3
1.1SUPPLY CHAINS WITH UNCERTAIN DEMAND ... 3
1.2RESEARCH OBJECTIVES ... 6
1.3RESEARCH METHODOLOGY ... 7
1.4RESEARCH SIGNIFICANCE ... 8
1.5THESIS STRUCTURE ... 9
CHAPTER 2 RESEARCH CONTEXT: THE CHINA AUTOMOTIVE INDUSTRY ... 11
2.1CHAPTER INTRODUCTION ... 11
2.2THE IMPORTANCE OF THE AUTOMOTIVE INDUSTRY IN CHINA’S MANUFACTURING INDUSTRIES ... 13
2.3CHARACTERISTICS OF THE CHINESE AUTOMOTIVE INDUSTRY... 17
2.4SUPPLY AND DEMAND ... 18
2.5SUPPLY CHAIN MANAGEMENT IN THE AUTOMOTIVE INDUSTRY ... 28
2.6AUTOMOTIVE SUPPLY CHAIN CHALLENGES ... 30
2.7CHAPTER CONCLUSION ... 31
CHAPTER 3 RELATIONSHIP BETWEEN SUPPLY CHAIN INTEGRATION (SCI) AND OPERATIONAL PERFORMANCE (OP) ... 33
3.1CHAPTER INTRODUCTION ... 33
3.2THE SYSTEMATIC REVIEW ... 35
3.3THEORETICAL BACKGROUND AND HYPOTHESIS DEVELOPMENT ... 55
3.3.1 The SCI-OP Relationships ... 55
3.3.2 Selection of Environmental Factor – Demand Uncertainty (DU) ... 60
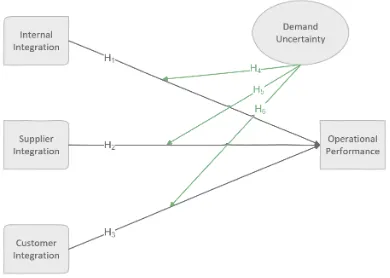
3.4THEORETICAL FRAMEWORK AND HYPOTHESES ... 62
3.4.1 Relationship between SCI and OP ... 62
3.4.2 Relationship between SCI and OP under DU ... 63
4.1CHAPTER INTRODUCTION ... 68
4.2RESEARCH PHILOSOPHY ... 68
4.2.1 Research Epistemology ... 69
4.2.2 Research Approach ... 70
4.3RESEARCH DESIGN ... 72
4.3.1 Questionnaire Design and Measures ... 72
4.3.3 Sampling and Data Collection ... 84
4.3.4 Final Data Sample: Reliability and Validity ... 87
4.3.5 Common Method Bias ... 90
4.3.6 Dimension Reduction ... 91
4.4ANALYZING METHOD ... 94
4.4.1 Linear Analyzing Method ... 94
4.4.2 Non-linear Analyzing Method ... 95
4.4.3 Threshold Regression Analysis (TRA) ... 97
4.5THEORETICAL MODEL ... 109
4.6CHAPTER CONCLUSION ... 111
CHAPTER 5 RESULTS AND FINDINGS ... 112
5.1CHAPTER INTRODUCTION ... 112
5.2 RESULTS OF HIERARCHICAL REGRESSION ANALYSIS ... 112
5.3RESULTS OF MODERATING EFFECTS ON II-OPRELATIONSHIPS ... 114
5.4RESULTS OF MODERATING EFFECTS ON SI-OPRELATIONSHIPS ... 116
5.5RESULTS OF MODERATING EFFECTS ON CI-OPRELATIONSHIPS ... 123
5.6COMPETING MODELS ... 129
5.7CHAPTER CONCLUSION ... 132
CHAPTER 6 DISCUSSION ... 133
6.1DISCUSSION ON LINEAR ANALYZING RESULTS ... 133
6.2DISCUSSION ON NON-LINEAR ANALYZING RESULTS ... 134
6.2.2 SI-OP Relationship Subject to DU ... 137
6.2.3 CI-OP Relationship Subject to DU ... 140
6.3CHAPTER CONCLUSION ... 142
CHAPTER 7 CONCLUSIONS AND LIMITATIONS ... 144
7.1CONTRIBUTION TO THE BODY OF KNOWLEDGE ... 144
7.2PRACTICAL IMPLICATIONS ... 145
7.3RESEARCH LIMITATIONS AND FUTURE DIRECTIONS ... 147
REFERENCES ... 149
APPENDIX A ... 157
APPENDIX B ... 159
APPENDIX C ... 161
APPENDIX D ... 164
List of Tables
Table 1 Selected journals with their abbreviations and ranking in AJG. ... 38
Table 2 Criteria for further selecting relevant journal papers ... 39
Table 3 Summary of primary methodologies applied in the selected 31 journal papers. 40 Table 4 Summary of Journals with number of papers included. ... 40
Table 5 Sub-dimensions of SCI involved in the selected paper ... 47
Table 6 Sub-dimensions of OP involved in the selected paper ... 48
Table 7 Empirical findings of the SCI-OP relationships in the selected paper ... 49
Table 8 Segmented empirical findings of the SCI-OP relationships in the selected paper ... 50
Table 9 Empirical findings of the Moderating effects on SCI-OP relationships in the selected paper ... 53
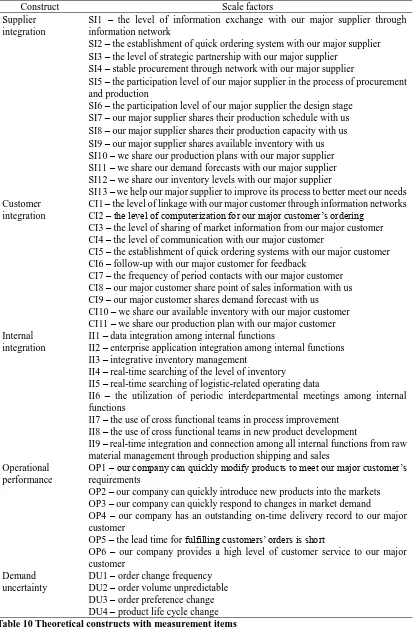
Table 10 Theoretical constructs with measurement items ... 77
Table 11 Measurement model 1 with Cronbach’s alpha measure. ... 78
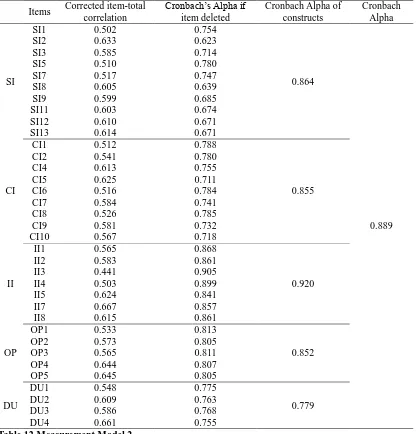
Table 12 Measurement Model 2 ... 80
Table 13 Rotated Item Matrix ... 82
Table 14 Total Variance Explained (PCA with Varimax Rotation) ... 83
Table 15 Construct validity. ... 84
Table 16 Construct correlation matrix. ... 84
Table 17 Profile of sample companies. ... 85
Table 18 Respondent features. ... 87
Table 19 Reliability and validity tests on the measurement model 3 with final data sample. ... 88
Table 21 Rotated item matrix on final data sample. ... 89
Table 22 Construct validity. ... 90
Table 23 Convergent validity ... 90
Table 24 Factor descriptive statistics. ... 92
Table 25 List of inverse U-shaped relationship studies. ... 96
Table 26 Direct and interaction effects regression results. ... 113
Table 27 Tests for threshold effects on II-OP relationship. ... 115
Table 28 Tests for threshold effects on SI-OP relationship. ... 116
Table 29 Threshold estimates ... 117
Table 30 Number of responses in each regime. ... 117
Table 31 Regression estimates: double threshold model ... 118
Table 32 Tests for threshold effects on CI-OP relationship. ... 123
Table 33 Threshold estimates ... 124
Table 34 Number of responses in each regime. ... 124
List of Figures
Figure 1 Total asset of China’s manufacturing industries from 2012 to 2014. ... 15
Figure 2 Total asset of China’s automotive industry and its proportion to the total asset of all manufacturing industries. ... 16
Figure 3 China annual vehicle production in thousands from 1998 to 2014. ... 18
Figure 4 China’s number of private owned vehicle from 2002 to 2014 million units. .... 19
Figure 5 China’s number of private owned passenger vehicle vs private owned truck from 2002 to 2014 in million units. ... 19
Figure 6 Categories of private owned passenger vehicles from 2002 to 2014 in million units. ... 21
Figure 7 Categories of private owned truck from 2002 to 2014 in million units. ... 21
Figure 8 Body type categories of private owned small passenger vehicle with their annual market share of sale from 2010 to 2016... 22
Figure 9 Engine size categories of private owned small passenger vehicle with their annual market share of sale from 2010 to 2016... 24
Figure 10 Total monthly sales and production of private owned small passenger vehicle from 2012.12 to 2015.12 in 10 thousand units. ... 25
Figure 11 Total monthly small passenger vehicle inventory held by OEMs and Dealers from 2011.01 to 2016.05 in 10 thousand units. ... 26
Figure 12 Total monthly small passenger vehicle inventory with its 6-month based weighted average line from 2011.01 to 2016.05 in 10 thousand units. ... 26
Figure 14 Theoretical framework. ... 66
Figure 15 Scatter plot of OP against SI, with DU ... 93
Figure 16 Scatter plot of OP against CI, with DU ... 93
Figure 18 Scatter plot of OP against II with regression line. ... 115 Figure 19 Scatter plot of OP against SI in high volatile demand interval with regression
line... 118 Figure 20 Scatter plot of OP against SI in middle volatile demand interval with regression
line... 119 Figure 21 Scatter plot of OP against SI in low volatile demand interval with regression
line... 120 Figure 22 Confidence interval construction double threshold model ... 121 Figure 23 Confidence interval construction double threshold model by fixing the first
threshold. ... 122 Figure 24 Scatter plot of OP against CI in high volatile demand interval with regression
line... 125 Figure 25 Scatter plot of OP against CI in middle volatile demand interval with regression
line... 126 Figure 26 Scatter plot of OP against CI in low volatile demand interval with regression
line... 127 Figure 27 Confidence interval construction double threshold model ... 128 Figure 28 Confidence interval construction double threshold model by fixing the first
threshold. ... 128 Figure 29 3D plot of the relationship from II to OP with DU, generated by LOWESS
(Locally Weighted Scatterplot Smoothing) ... 136 Figure 30 3D plot of the relationship from SI to OP with DU, generated by LOWESS
(Locally Weighted Scatterplot Smoothing) ... 138 Figure 31 3D plot of the relationship from CI to OP with DU, generated by LOWESS
Table of Abbreviations
AGFI Adjusted Goodness-of-Fit Index
AJG Academic Journal Guide
AVE Average Variance Extracted
BSREC Biomedical & Scientific Research Ethics Committee
CFA Confirmatory Factor Analysis
CFI Comparative Fit Index
CI Customer Integration
CMB Common Method Bias
CT Configuration Theory
DS Decision Science
DU Demand Uncertainty
EFA Exploratory Factor Analysis
EI External Integration
GFI Goodness-of-Fit Index
HRA Hierarchical Regression Analysis
II Internal Integration
IJOPM International Journal of Operations and Production Management
IJPDLM International Journal of Physical Distribution and Logistic Management
IJPE International Journal of Production Economics
IMM Industrial Marketing Management
JIT Just-in-time
JOM Journal of Operations Management
KMO Kaiser-Meyer-Olkin
OEM Original Equipment Manufacturer
OIPT Organizational Information Processing Theory
OLS Ordinary Least Square
OP Operational Performance
RBV Resource Based View
RMSEA Root Mean Error of Approximation
SCI Supply Chain Integration
SCM Supply Chain Management
SCMAIJ Supply Chain Management: An International Journal
SE Standard Error
SEM Structural Equation Modelling
SI Supplier Integration
SLR Systematic Literature Review
TCT Transaction Cost Theory
TJ Transportation Journal
Acknowledgements
I would like to express my gratitude and appreciation to all, who have directly and indirectly helped in completing this research:
Dr Dawei Lu, my first supervisor, for his continuous guidance and support in areas from research design to theoretical modeling; from problem definition to empirical testing; from writing skills to presentation.
Dr Xisha Chen, my wife, for the gift of companionship, in every hard time and lost night.
My parents, for their economic support, and most importantly, their unconditional love which acts as my solid shield and forms my internal confidence.
1
Abstract
2
3
Chapter 1 Introduction
The first chapter presents an introduction of theoretical context and objectives of this study. First, to better understand the research aim and objectives, general background information on how demand uncertainty may impact the relationship between supply chain integration and operational performance is described. The contingency theory in a supply chain context as the core concept for supply chain management and operations management is also introduced. Second, an overview of the research context (China’s automotive industry) is presented. Thus, the first chapter seeks to reveal the two areas examined in this study:
The direct relationship between supply chain integration and operational performance.
The moderating effect of demand uncertainty on the relationship between supply chain integration and operational performance.
Lastly, the aim, objectives, research questions and methodologies of this study are presented, followed by an outline of research significance.
1.1 Supply Chains with Uncertain Demand
Supply chain management (SCM) was developed in the 1980s, enabling organizations to more effectively integrate their business processes (Towill and Christopher, 2002). During the past four decades, SCM has attracted great attention from both academics and practitioners alike. SCM has been defined as the flow of materials, products, information within a company, as
well as across organization from suppliers to manufacturers and from manufacturers to
customers in order to improve the long-term performance of the organizations and the supply
chain as a whole (Mentzer et al., 2001). Supply chain integration (SCI) is one of the key
4
Unlike SCM, SCI is merely a recent entry on the agenda of researchers. Studies have been focused on developing definitions and dimensions of SCI. In particular, for the purpose of examining the contribution of SCI to OP, some studies view SCI as a single concept (Vereecke and Muylle, 2006, Sezen, 2008), however, the majority of the studies constructed SCI from multiple dimensions. For example, according to Gimenez and Ventura (2005), SCI studies can be classified into three categories according to whether they study the relation between internal integration (II) and performance, between external integration (EI) and performance or between both types of SCI with regards to performance. For instance, studies of Gimenez and Ventura (2005), Flynn et al. (2010), Wong et al. (2011b) have examined the effects of both internal and external integration on supply chain performance. In the meantime, other literature has argued that the role of II has been overlooked, and the importance of EI has not been well studied and emphasised (Power, 2005, Stevenson and Spring, 2007). For these reasons, numerous studies elaborate the sole role of EI into supplier integration (SI) and customer integration (CI), which is a further taxonomy of EI (Petersen et al., 2005, Das et al., 2006, Koufteros et al., 2007).
5
validity of SCI that it highly acclaims contribution to OP (Prajogo et al., 2015, Ebrahimi, 2015, Zhao et al., 2015, Beske-Janssen et al., 2015, Yang et al., 2015, Yu et al., 2014).
This study starts with the doubts of ‘common sense’ that SCI will always be positively correlated with the optimum OP (Jonsson et al., 2011, Terjesen et al., 2012). This is because that many previous studies appear to be inconsistent or even conflicting with one another about their findings on the nature of this correlation (Devaraj et al., 2007, Gimenez et al., 2012, Sousa et al., 2012). Some of the positive relationship findings might be restricted to certain specific conditions or might instead be dependent on a specific factor or control parameter (Morash and Clinton, 1998, Stank et al., 2001b), while many others were intended to be general (Bowersox et al., 1999, Frohlich and Westbrook, 2001, Frohlich and Westbrook, 2002, Fawcett and Magnan, 2002). With the advent of a large number of empirical studies which evidence such a positive relationship, inevitable or expected empirical results in terms of an insignificant (Gimenez and Ventura, 2005, Devaraj et al., 2007) and even negative relationship (Swink et al., 2007) emerged. Such inconsistent empirical results have motivated researchers to re-investigate the theoretical foundation of such ‘common sense’ (Halldórsson et al., 2007, Van der Vaart and van Donk, 2008). They also motivated researchers to discover unknown mechanisms and try to perfect theoretical foundations.
6
al., 2010). By introducing contingency theory, extant literature indicated that the contribution of the level of SCI to the manufacturer’s OP is subject to the influence of various environmental factors (Turkulainen, 2008, Wong et al., 2011b, Gimenez et al., 2012). These factors may include ones such as market uncertainty, national culture, political uncertainty and so on. Under the effects of mixed environmental factors, what may be agreeable without too much controversy is that any attempt to construct a universally applicable relationship model between SCI and OP is theoretically doomed before conception. However, what has not been agreed upon, or still remains inconclusive, is how the relationship between SCI and OP may be influenced and by which factors (Van der Vaart and van Donk, 2008, Waller et al., 2008). This inconclusiveness therefore logically gives rise to the research gap in the SCI-related subject domain.
The research gap through which this study enters is that there is a lack of research which provides analytical models and theories to explain why, in some instances, environmental factors have no effect on the SCI-OP relationship but, in other instances, an SCI-OP relationship can be enhanced or weakened under the moderating environmental effects, especially within a focused industry. Without an analytical model or theory, the research findings on the relationship between SCI and OP tend to be fragmented and inconsistent (Flynn et al., 2010, Turkulainen and Ketokivi, 2012). Arguably, a properly derived analytical model, if achievable, will provide a more holistic and detailed explanation than a formative evaluation on how those constructs affect each other.
1.2 Research Objectives
7
research context. This study defines a manageable scope of investigation in between SCI, OP and a selected key exogenous factor: demand uncertainty (DU). This study also attempts to analytically model the relationship between these concepts. The validity of the choices of the three key constructs for this study will be discussed in Chapter 3.
For the above reasons, the objective of this study can be stated as revisiting the relationship between the SCI and the OEMs’ OP under the full spectrum of DU as the moderator by using an empirical instrument to create an analytical model that further explains the inter-play of these three constructs. The unit of analysis in this study is the manufacturer that acts as the OEMs in China’s automotive industry. The level of the research focus is pitched at the dynamic non-linear relationship among the three constructs.
1.3 Research Methodology
8
quantitative approach using hierarchical regression analysis and threshold regression analysis was utilised to test the proposed hypotheses.
1.4 Research Significance
This study adopts a contingency approach in order to analyse the moderating effects of DU on the SCI-OP relationship. Using a data sample from China’s automotive industry, this study expects to contribute to SCM and operations management theories.
First, this study examines the direct relationship among the three dimensions of SCI (internal integration, supplier integration and customer integration) and OP.
Second, by utilising a data sample from China’s automotive industry, this study empirically reveals the moderating effects of DU on the SCI-OP relationships.
Third, by categorising DU into three regimes, including ‘low uncertain demand’, ‘middle uncertain demand’ and ‘high uncertain demand’, this study provides empirical evidence on how DU moderates the SCI-OP relationships in each regime of DU. The obtained empirical results also indicate that DU does not moderate the relationship between internal integration and OP.
9
The empirical findings are highly significant for supply chain daily managers and organizational decision makers of Chinese automotive supply chains, since they require practical knowledge for implementing SCI. Thus, instead of perceiving SCI in a closed supply chain context, this study endorses an extended perspective by including an environmental factor (DU) when approaching SCI to improve OP in China’s automotive industry.
1.5 Thesis Structure
The remainder of the thesis is structured as follows. The first chapter provides a brief introduction to this study. A general background of the relationships between SCI and OP is presented, followed by a short discussion on the moderating effects of DU. The remaining sections report the main research gaps, research objectives, research methodologies and research significances.
Chapter 2 describes the research context, which is China’s automotive industry, with its developmental and industrial challenges which have arisen in recent years with the inclusion of sufficient industrial figures.
Chapter 3 is carried out based on a systematic literature review and provides a detailed summary of relevant theoretical arguments and empirical supports on the SCI-OP relationships. Accordingly, a discussion on the systematic literature review results is presented to clearly identify the research gaps. To overcome the identified gaps, Chapter 3 establishes a theoretical framework with the six research hypotheses which are under examination.
10
were measured and how data were collected and validated. In addition, this chapter introduces the primary data-analysing method – threshold regression analysis with its estimation, inference and computation processes. Lastly, a section is presented to reveal the theoretical model establishment.
The fifth chapter reports the results of the data analysis. The results of examining the direct relationships (hypotheses 1 – 3) are reported first, and the non-linear results of examining the moderating effects (hypotheses 4 – 6) obtained by adopting the threshold regression analysis are reported in the following sections. Importantly, an additional section compares models based on the author-introduced method of analysis and the literature-favoured method of analysis to reveal the significant advantage of using the threshold regression analysis.
11
Chapter 2 Research Context: The China Automotive Industry
2.1 Chapter Introduction
Chapter 1 introduced the research background, objectives and rationale. To represent the research objective, this study aims to examine the moderating effect of demand uncertainty on the relationship between SCI and OP in automotive supply chains of China. There exist a number of reasons to examine such relationships in the context of automotive supply chains in China, the most significant of which are as follows:
Based on the contingent argument, prior studies have examined the moderating or mediating effect of environmental factors on the SCI-OP relationship. However, the majority of such studies have been conducted based on mixed manufacturing industries (Huang et al., 2014, Koufteros et al., 2005, Wong et al., 2011a, Flynn et al., 2010). Lockstroem et al. (2010) argued that the automotive industry is one of the largest manufacturing industries, which has been considered the basic engine of economy. Its products (vehicle) are essential elements in supporting flows of goods and personnel. Thus, a sector-focused empirical investigation seems to be necessary in understanding its significance in the operations management domain.
12
production flows. Such uncertainties will eventually result in challenges to understand and predict future market demand for the automotive OEMs (Lockstroem et al., 2010). Therefore, the Chinese automotive industry and the challenges it is facing indicate the need for improved understanding on how demand uncertainty affects supply chain operations from scholars and supply chain managers.
Another major issue in the Chinese automotive industry is the overcapacity which has existed among OEMs in recent years. Such overcapacity clearly reflected the prior inefficiency of their supply chain management (Holweg et al., 2008). It is argued that inappropriate integration could expose OEMs’ risk of effectively sharing information, strategically using resources and controlling costs. This may result in failure of production capacity management by facing an unpredictable market demand. Thus, it becomes important to investigate how the demand challenges moderate the relationship between SCI and OP in such association.
13
Therefore, the Chinese automotive industry exists as a proper case to examine the SCI-OP relationship based on the contingent argument. Prior empirical studies have been conducted based on mixed manufacturing industries. Consequently, this study provides a new perspective to the current debates on the SCI-OP relationship by focusing on China’s automotive industry.
2.2 The Importance of the Automotive Industry in China’s
Manufacturing Industries
14
15
Figure 1 Total asset of China’s manufacturing industries from 2012 to 2014.
16
Figure 2 Total asset of China’s automotive industry and its proportion to the total asset of all manufacturing industries.
17
2.3 Characteristics of the Chinese Automotive Industry
China’s automotive industry has experienced dramatic growth since 1949. Following
this timeline, there was virtually no automotive industry before 1956. Hundreds of trucks were assembled in 1956, which was the first milestone of China’s automotive industry. After 30 years of growth, China began its production of civilian vehicles. The first joint venture with Volkswagen in 1991 gave a boost to China’s automotive industry development. To prevent international shocks to the achieved development, China’s
automotive market was protected by high tariffs and the central government’s pricing policy in the 1990s. The government-controlled market mechanism was to mediate the balance between demand and supply, which enabled small domestic manufacturers to survive. Later, China joined WTO in 2002 and, from this, followed a number of steps to open up its automotive market, including tariff reduction and a gradual reduction of government controls. After entering the 21st century, the automotive industry began to
18
Figure 3 China annual vehicle production in thousands from 1998 to 2014.
Note: vehicle = car + truck + coach.
Data source: National Bureau of Statistics of China Data, 2016.
2.4 Supply and Demand
19
[image:30.595.92.497.85.344.2]Figure 4 China’s number of private owned vehicle from 2002 to 2014 million units.
Figure 5 China’s number of private owned passenger vehicle vs private owned truck from 2002 to
20
21
Figure 6 Categories of private owned passenger vehicles from 2002 to 2014 in million units.
Notes: L-Large; M-Middle; S-Small; Large: more than 40 seats; Middle: 9-40 seats; Small:5-9 seats;
Micro: less than 5 seats.
Figure 7 Categories of private owned truck from 2002 to 2014 in million units.
Notes: L-Large; M-Middle; S-Small; Large: total mass more than 14 tons; Middle: 6-14 tons;
22
Figure 8 Body type categories of private owned small passenger vehicle with their annual market
share of sale from 2010 to 2016.
23
The significant market share growth of electric vehicles was due to the Chinese government believing that electric battery-powered vehicles will come to play a major role in the future auto market. In 2009, the Chinese government arranged more governmental funding to encourage domestic auto manufacturers to improve their own R&D capabilities, in particular for energy-saving and green-power technologies (Tang, 2009). To further encourage auto manufacturers’ willingness to research and produce electric vehicles and to enhance customers’ purchasing preference on electric vehicles,
24
Figure 9 Engine size categories of private owned small passenger vehicle with their annual market
share of sale from 2010 to 2016.
25
can be seen, the production line lays above the sale line for a majority of the time, in which the difference between production and sales constructs inventory. Figure 11 further provides details of the amount of inventory held by OEMs and dealers, as there generally existed more positive inventory than negative inventory for both OEMs and dealers. By summarising their inventory, Figure 12 shows the total inventory of passenger vehicle in China’s automotive market. The orange line represents the
six-month-based weighted average inventory. Although it fluctuated up and down cross the time period, it stayed positive after January 2014. These features of inventory clearly reflect the issue of overcapacity in China’s automotive industry.
Figure 10 Total monthly sales and production of private owned small passenger vehicle from
26
Figure 11 Total monthly small passenger vehicle inventory held by OEMs and Dealers from 2011.01
to 2016.05 in 10 thousand units.
Figure 12 Total monthly small passenger vehicle inventory with its 6-month based weighted
27
An accompanying effect of the overcapacity was that competition increased considerably. Many price-sensitive consumers delayed their vehicle-purchasing plans as prices continued to fall. This resulted in an effect known as the ‘liquidity trap’ (Krugman et al., 1998), which is when a price war happened between OEMs in order to divest inventory. By witnessing the price fall, consumers further delayed their purchasing plan, which reduced market demand, and the demand reduction further intensified the price war. Not surprisingly, such price falls also forced changes in the demand structure, making the market demand more unpredictable.
28
which reflected the rising issue of overcapacity in OEMs. In addition, rising inventory increased OMEs’ managing cost and reduced asset turnover (Harford, 2005). In order to maximise OEMs’ OP, reducing inventories became necessary and important. However, such inventory reduction activities would cause pricing war in the automotive market, which might further compress OEMs’ profit space. As discussed above, the
pricing war would also lead to the emergence of the liquidity trap. The effect of liquidity trap would bias the demand preference curve, so that future demand would be even more difficult to anticipate.
2.5 Supply Chain Management in the Automotive Industry
Generally speaking, OEMs in the automotive industry have very complex supply chains with upstream suppliers and downstream customers. In a general manufacturing supply chain, OEMs obtain demand information from downstream and estimate order quantities without pre-communication upstream. In such a circumstance, suppliers are unlikely able to fulfil the received orders due to lack of materials, which often leads to overtime production. To achieve just-in-time (JIT) production, automotive manufacturers have been establishing closely integrated collaborations with suppliers who have a willingness to deliver production upgrades together with OEMs (You and Zhu, 2005).
29
OEMs’ SCM, for their final aim is avoiding both being out of stock and having a
massive inventory (Power, 2005). Wei and Qingfen (2015) indicated that automotive OEMs in China were pursuing consumer-demand-driven strategies. By applying such strategies, OEMs are expected to achieve higher operational profits and market share. Many automotive OEMs expend effort to learn consumers’ demand preferences on vehicle body type, design, engine size, number of seats, entertainment and other features (Zhang and Chen, 2006). For example, both Volvo and Ford established their build-to-order online system for consumers to design personalised vehicles. In a different way, domestic OEMs such as BYD and Geely also have their ‘build-up-now’ systems. The aim of launching these systems is to maximally learn consumers’ demand
preferences on vehicles.
The OEMs’ online vehicle design systems were not the only way to learn consumers’ demand preferences. Khoong et al. (1997) indicated that OEMs designed their aftermarket services as a part of their downstream. In this way, closely integrated downstream customers are more likely to satisfy consumers’ need and then gain
consumer loyalty. In addition, downstream customers geographically close to and more directly communicate with consumers, which makes information about consumer demand preference more easily collectable (Lyons et al., 2004). As stated by Mills et al. (2004): “accurate visible real-time information, such as demand information and
30
transport, produce to store etc. can improve demand forecast and price fluctuations,
stimulate the efficiency of upstream operations and result in faster system response
time.”
2.6 Automotive Supply Chain Challenges
By observing the uncertain future trends of market demand preferences, demand uncertainty is a challenge in China’s automotive supply chains. Demand uncertainty is
an issue related to un-anticipatable future demand trends regarding a specific vehicle product. Unlike other manufacturing industries, given that it often takes several years to build a vehicle from its starting design, a failure to anticipate future demand will directly lead to inappropriate vehicle design. Production on such inappropriately designed vehicles usually exceeds market sale, which then forms overstock and eventually depreciates OP for a considerably long period. Therefore, demand information transformation from downstream to OEMs becomes the main objective of downstream supply chain management (Das et al., 2006) for the purpose of accurately anticipate future demand preferences. In particular, for the automotive industry in China, there exists a high need of demand information for anticipation, while the future demand preferences on body type and engine size are getting fuzzy.
31
of steady growing total demand, uncertain future demand preferences and gradually rising inventory. Stocked inventory caused by inappropriate capacity adjustment decisions will lead to higher operational costs and a loss in market share. The production capacity is aligned with upstream in that it is the collaboration between OEMs and suppliers which delivers production. Consequently, from the SCM perspective, the collaboration strength between OEMs and suppliers determines their supply chain production capacity.
To overcome the challenges in China’s automotive industry, a clear understanding of
SCI contributes to OP under the moderating effect of demand uncertainty will be beneficial. This is particularly the case because both of the challenges are related to how OEMs should collaborate with suppliers and customers by facing uncertain demand.
2.7 Chapter Conclusion
Chapter 2 presented a brief introduction to the context of China’s automotive industry. The chapter began with a discussion on the importance of the automotive industry to China’s other manufacturing industries. It was argued that the automotive industry is vital for sustaining and developing China’s economy. A descriptive analysis of China’s annual vehicle production statistics revealed that China’s automotive industry has
32
producers and auto markets in the world. Additionally, it was argued that auto production grew steady in the past years and is expected to continue growing. However, it was demonstrated that the demand preferences on vehicle features are approaching a crossover and may become uncertain to predict in the future. The chapter also introduced how automotive supply chain works differently to other manufacturing supply chains. In the later part of the chapter, challenges facing automotive supply chains were also presented. Under this study, it was suggested that the un-anticipatable demand uncertainty observed in China’s automotive industry brings operational
challenges.
In order to overcome the identified challenges, it was argued that automotive OEMs would require more appropriate adjustment on their collaborations with suppliers and customers when facing different demand conditions. Without observing how OEMs in China actually adjust their collaborations, however, it was argued that the automotive OEMs in China have been adopting consumer-demand-driven strategies in recent years. This could be associated to OEMs’ attention to market changes, the existing demand
33
Chapter 3 Relationship between Supply Chain
Integration (SCI) and Operational Performance (OP)
3.1 Chapter Introduction
Supply chain management has many definitions in academia, most of which are related to integration: “the entire concept of SCM is really predicted on integration” (Pagell,
2004). Integration plays a strategic role in SCM (Stank et al., 2001a), both in research and in practice. There is a ‘common sense’ belief that integration always positively contributes to operational performance, and it has been widely discussed and evidenced on an empirical basis (Sousa et al., 2012, Graham et al., 2005, Wook Kim, 2006). Somewhat in contrast, existing literature reveals disagreements and contradictions regarding the universal understanding of integration of ‘the more the better’. Some studies found insignificant relationships (Devaraj et al., 2007, Gimenez et al., 2012, Stank et al., 2001b, Cousins and Menguc, 2006), while other studies recommend positive relationships with differentiated magnitudes or even negative relationships (Koufteros et al., 2005, Van der Vaart and van Donk, 2008).
34
identify a research gap and establish research hypotheses. As discussed in Chapter 1, this study attempts to answer the following research questions:
1. What is the relationship between SCI and OP?
2. Do the supply chain environmental factors moderate the relationship between SCI and OP?
3. How will the SCI-OP relationship be moderated by the environmental factors and to what extent?
To address the first research question, this chapter begins with a systematic literature review (SLR) on SCI in the SCM and operations management domain. The abundance of SCI studies, diverse methodologies used and different conceptualisations of SCI sub-dimensions have consequently led to diversified empirical findings (Pagell, 2004, Halldórsson et al., 2007). To address these findings, an SLR approach (Power, 2005) is applied for the purpose of clarifying the intricate current understanding of sub-dimensions of SCI and how these sub-sub-dimensions of SCI individually affect OP. The SLR reported in this chapter focuses on prior empirical findings on the subject of the SCI-OP relationship.
35
above areas enables this study to identify the current gaps in knowledge and, therefore, propose research hypotheses.
The rest of this chapter is structured as follows: the second section describes methodology followed for the SLR; the third section analyses findings obtained from the SLR; the fourth section discusses theoretical arguments; the theoretical framework and research hypotheses are presented in the final section.
3.2 The Systematic Review
This study follows the SLR method originally proposed by Tranfield et al. (2003a), (Thomas and Harden, 2008): planning, conducting and reporting the review. As discussed above, SCI is a developing concept with numerous and sometimes varying definitions, and the opinions of its relationship with OP are not unified. The aims of systematic literature are to locate, select and evaluate research question-related literature (Tranfield et al., 2003b). Thus, the systematic literature review in this study is established based on the following questions:
To what extent has the concept of SCI been developed thus far?
What has been found in terms of the impact of SCI on operational performance?
Does SCI always improve operational performance?
36
out based on Google Scholar. The reason for choosing Google Scholar is that it includes most of the journals in the fields of SCM and OM which are relevant to this study. This search was originally conducted in July of 2014 and was updated in January of 2016.
The search string was as follows: Supply chain
OR Suppl* OR Custom* OR Internal
AND integrat*
AND Operat*
AND Performance
AND (data OR empirical OR test OR statistical OR finding* OR result* OR
evidence OR case* OR stud* OR review*)
The keyword supply chain aims at the supply chain management context; Suppl*, Custom* and Internal were to cover studies which might focus on a specific integration
37
from Google Scholar. Thereafter, the following inclusion and exclusion criteria were applied before relevancy analysis:
Exclude articles before year 2000 (include articles from 2000-2016). Since SCI
is a developing concept, it is necessary to include the most recent studies and arguments (Van der Vaart and van Donk, 2008), hence this study excluded articles prior to 2000. This step reduced the number of articles to 247.
Only include journal papers. Stevenson and Spring (2007) indicated that a
systematic review should be conducted by implementing a standard selection method. This study only includes journal papers, which are peer-reviewed, because peer feedback guarantees a high standard of reporting and contributions. After applying this inculcation criterion, the number of articles was reduced to 222.
Journal selection. The previous step of exclusion still concluded with a large
38
Journal Abbreviation AJG
Ranking
Journal of Supply Chain Management JSCM 4*+
Journal of Operations Management JOM 4*+
Production and Operations Management POM 4*
International Journal of Operations & Production Management IJOPM 4*
Supply Chain Management: An International Journal SCMAIJ 3*
International Journal of Production Economics IJPE 3*
Industrial Marketing Management IMM 3*
Decision Science SD 3*
Transportation Journal TJ 3*
International Journal of Physical Distribution & Logistics Management IJPDLM 2*
Table 1 Selected journals with their abbreviations and ranking in AJG.
The journal selection step narrows down the number of journal papers to 46.
The remaining 46 journal papers were then evaluated based on a set of quality criteria such as theory robustness, methodology, generalisability and contribution (Power, 2005). Thereafter, the 46 journal papers were categorised as:
Studies on SCI which had clarity in relation to SCI sub-dimensions and OP. It is
then important to have conceptual accuracy before theoretical discussion.
Clearly presented measures of SCI and OP. In order to better understand the
findings from past studies, it is important to be clear on how they measure SCI and OP.
The majority of the 46 journal papers were conducted in general areas of
39
Studies about SCI that examined different dimensions of SCI including internal,
external, supplier, customer integration, etc.
Obviously, the larger the number of criteria met, the higher the relevance of the journal paper. To achieve a balance, the author decided that journal papers which meet at least three criteria were included, as shown in Table 2, 35 journal papers were included. Among the 35 journal papers, as shown in Table 3, five used ANOVA analysis, 14 used regression analysis, and the remaining 16 were conducted by applying structural equation modelling (SEM). In addition, by categorising the selected journal papers in relation to their measurement methodologies, all of the 35 selected journal papers are survey-based empirical studies. This result is in line with other literature reviews in the SCM domain (Van der Vaart and van Donk, 2008, Power, 2005). As argued by Van der Vaart and van Donk (2008), reviewing articles with different methodologies definitely provides a better understanding of the SCI conceptualisation.
Criteria Number of paper Relevant to study
Studies meeting all four criteria 24 Included
Studies meeting at least three criteria 35 Included
Studies meeting at least two criteria 38 Excluded
Studies meeting at least one criteria 46 Excluded
40
Primary Methodology Number of Papers Percentage (%)
ANOVA 5 16.1
Regression Analysis 14 38.7
SEM 16 45.2
Total 31 100
Table 3 Summary of primary methodologies applied in the selected 31 journal papers.
Eventually, the breakdowns of the 35 selected journal papers were as follows (see Table 4): 10 studies from the Journal of Operations Management (JOM); 3 from the Journal of Supply Chain Management (JSCM); 1 from the Production and Operations
Management (POM); 5 from the International Journal of Operations & Production
Management (IJOPM); 6 from the Supply Chain Management: An International
Journal (SCMAIJ), 2 from the International Journal of Production Economics (IJPE);
3 from the Decision Science (DS); 1 from the Transportation Journal (TJ); 1 from the Industrial Marketing Management (IMM); 3 from the International Journal of Physical
Distribution & Logistics Management (IJPDLM).
Journal Number of papers Percentage (%)
JOM 10 28.6
IJOPM 5 14.3
SCMAIJ 6 17.1
IJPE 2 5.7
JSCM 3 8.6
DS 3 8.6
POM 1 2.8
TJ 1 2.8
IMM 1 2.8
IJPDLM 3 8.6
41
The applied filters narrowed the initial searching results of 294 articles to 35 journal papers. The selected 35 journal papers were then read and analysed in depth, with basis in four aspects:
The way SCI was defined or measured;
The way OP was defined or measured;
The detailed methodologies applied;
Types of relations found between SCI and OP;
The ‘answer’ given to the key question: ‘What has been found in terms of the impact of SCI on OP?’
For the purpose of reviewing the above aspects, the selected journal papers were systematically classified based on a framework developed in the study of Ebrahimi (2015). The framework was developed multi-dimensionally with the basis in an iterative approach. The resulting framework is based on:
Four overall dimensions of SCI including supply chain integration from an
aggregate level, internal integration (II), supplier integration (SI) and customer integration (CI);
An aggregate dimension of OP;
Methodological approaches;
Selected industries;
42
Given answers to the review question: ‘Does SCI always improve OP?’
SCI and sub-dimensions.
43
processes. Without too much argument, the definition of SCI used in this study refers to Flynn et al. (2010).
There are extant studies which examine the SCI-OP relationship while considering SCI as an aggregate construct and emphasising its effects on few aspects, such as supply chain collaborative practices (De Toni and Nassimbeni, 2000, Frohlich and Westbrook, 2001), attitudinal issues (Johnston et al., 2004) and communication technologies (Devaraj et al., 2007). However, it is increasingly accepted that SCI is a multi-dimensional concept (Das et al., 2006).
The literature provides many different classifications of SCI. A fundamental distinction is between internal and external integration (Stank et al., 2001b). Similarly, Frohlich and Westbrook (2001) proposed a distinction which is between upstream and downstream integration. Lee and Whang (2004) argued that SCI can be analysed in three ways in terms of operational integration, functional integration and relational integration. By expanding Lee and Whang (2004)’s argument, Das et al. (2006) further considered enterprise resource planning and relational initiatives. In a recent view, Flynn et al. (2010) argued that “the diverse dimensions of SCI can ultimately be collapsed into three dimensions: customer, supplier and internal”. This study follows
44
The following dimensions were included:
Aggregate: considering supply chain integration at an aggregated level.
Internal integration: integration within a company and across different departments.
Supplier integration: upstream integration between an OEM and its suppliers.
Customer integration: downstream integration between an OEM and its customers.
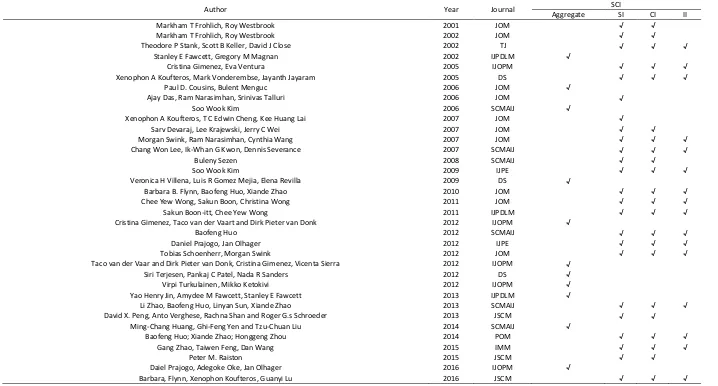
With regards to the discussion of the SCI sub-dimensions (see Table 5), 13 (38.7%) papers are limited at an aggregated level, the remaining 22 (61.3%) papers considered specific sub-dimensions of SCI. With regards to the latter 22 papers, there are 2 (6.5%) papers which only focused on supplier integration in their studies; 5 (9.7%) papers included both supplier integration and customer integration; the final 15 (41.9%) papers studied on all three sub-dimensions of SCI. It can thus be concluded that there are significant variations regarding the inclusion of SCI sub-dimensions, and recent studies have a tendency to include all three sub-dimensions.
OP and Sub-dimensions
45
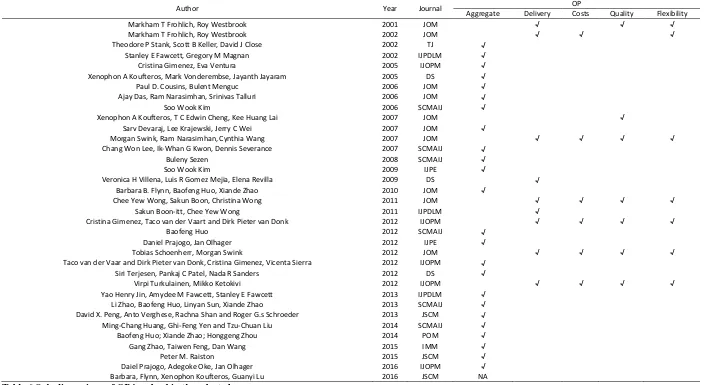
chain participators may work at multiple goals and thus waste resources, which will have a detrimental influence on cost and quality performance (Wang et al., 2012). From the production literature, there are arguments that integration enables the information share along the supply chains (Narasimhan and Kim, 2002) and slows for higher level of production coordination for improving production flexibility and delivery performances (Jonsson et al., 2011). These theoretical arguments have been empirically evident by many studies which found positive relationships between SCI and logistic performance (Gimenez and Ventura, 2005), delivery performance (Jonsson et al., 2011), quality performance (Wang et al., 2012) and cost performance (Waller et al., 2008). All of these empirical findings suggest a four-dimension category of OP (Wong et al., 2011a, Flynn et al., 2010).
Aggregate: considering operational performance at an aggregated level.
Delivery performance: provide on-time and reliable quantity products to customers.
Production cost: produce products with low inventory and overhead costs.
Product quality: produce consistent quality and high performance products that
meet customer needs.
Production flexibility: produce customized product features and able to rapidly
change production volume.
46
47
Author Year Journal SCI
Aggregate SI CI II
Markham T Frohlich, Roy Westbrook 2001 JOM √ √
Markham T Frohlich, Roy Westbrook 2002 JOM √ √
Theodore P Stank, Scott B Keller, David J Close 2002 TJ √ √ √
Stanley E Fawcett, Gregory M Magnan 2002 IJPDLM √
Cristina Gimenez, Eva Ventura 2005 IJOPM √ √ √
Xenophon A Koufteros, Mark Vonderembse, Jayanth Jayaram 2005 DS √ √ √
Paul D. Cousins, Bulent Menguc 2006 JOM √
Ajay Das, Ram Narasimhan, Srinivas Talluri 2006 JOM √
Soo Wook Kim 2006 SCMAIJ √
Xenophon A Koufteros, T C Edwin Cheng, Kee Huang Lai 2007 JOM √
Sarv Devaraj, Lee Krajewski, Jerry C Wei 2007 JOM √ √
Morgan Swink, Ram Narasimhan, Cynthia Wang 2007 JOM √ √ √
Chang Won Lee, Ik-Whan G Kwon, Dennis Severance 2007 SCMAIJ √ √ √
Buleny Sezen 2008 SCMAIJ √ √
Soo Wook Kim 2009 IJPE √ √ √
Veronica H Villena, Luis R Gomez Mejia, Elena Revilla 2009 DS √
Barbara B. Flynn, Baofeng Huo, Xiande Zhao 2010 JOM √ √ √
Chee Yew Wong, Sakun Boon, Christina Wong 2011 JOM √ √ √
Sakun Boon-itt, Chee Yew Wong 2011 IJPDLM √ √ √
Cristina Gimenez, Taco van der Vaart and Dirk Pieter van Donk 2012 IJOPM √
Baofeng Huo 2012 SCMAIJ √ √ √
Daniel Prajogo, Jan Olhager 2012 IJPE √ √ √
Tobias Schoenherr, Morgan Swink 2012 JOM √ √ √
Taco van der Vaar and Dirk Pieter van Donk, Cristina Gimenez, Vicenta Sierra 2012 IJOPM √
Siri Terjesen, Pankaj C Patel, Nada R Sanders 2012 DS √
Virpi Turkulainen, Mikko Ketokivi 2012 IJOPM √
Yao Henry Jin, Amydee M Fawcett, Stanley E Fawcett 2013 IJPDLM √
Li Zhao, Baofeng Huo, Linyan Sun, Xiande Zhao 2013 SCMAIJ √ √ √
David X. Peng, Anto Verghese, Rachna Shan and Roger G.s Schroeder 2013 JSCM √ √
Ming-Chang Huang, Ghi-Feng Yen and Tzu-Chuan Liu 2014 SCMAIJ √
Baofeng Huo; Xiande Zhao; Honggeng Zhou 2014 POM √ √ √
Gang Zhao, Taiwen Feng, Dan Wang 2015 IMM √ √ √
Peter M. Raiston 2015 JSCM √ √
Daiel Prajogo, Adegoke Oke, Jan Olhager 2016 IJOPM √
[image:58.842.69.787.91.477.2]Barbara, Flynn, Xenophon Koufteros, Guanyi Lu 2016 JSCM √ √ √
48
Author Year Journal OP
Aggregate Delivery Costs Quality Flexibility
Markham T Frohlich, Roy Westbrook 2001 JOM √ √ √
Markham T Frohlich, Roy Westbrook 2002 JOM √ √ √
Theodore P Stank, Scott B Keller, David J Close 2002 TJ √
Stanley E Fawcett, Gregory M Magnan 2002 IJPDLM √
Cristina Gimenez, Eva Ventura 2005 IJOPM √
Xenophon A Koufteros, Mark Vonderembse, Jayanth Jayaram 2005 DS √
Paul D. Cousins, Bulent Menguc 2006 JOM √
Ajay Das, Ram Narasimhan, Srinivas Talluri 2006 JOM √
Soo Wook Kim 2006 SCMAIJ √
Xenophon A Koufteros, T C Edwin Cheng, Kee Huang Lai 2007 JOM √
Sarv Devaraj, Lee Krajewski, Jerry C Wei 2007 JOM √
Morgan Swink, Ram Narasimhan, Cynthia Wang 2007 JOM √ √ √ √
Chang Won Lee, Ik-Whan G Kwon, Dennis Severance 2007 SCMAIJ √
Buleny Sezen 2008 SCMAIJ √
Soo Wook Kim 2009 IJPE √
Veronica H Villena, Luis R Gomez Mejia, Elena Revilla 2009 DS √
Barbara B. Flynn, Baofeng Huo, Xiande Zhao 2010 JOM √
Chee Yew Wong, Sakun Boon, Christina Wong 2011 JOM √ √ √ √
Sakun Boon-itt, Chee Yew Wong 2011 IJPDLM √
Cristina Gimenez, Taco van der Vaart and Dirk Pieter van Donk 2012 IJOPM √ √ √ √
Baofeng Huo 2012 SCMAIJ √
Daniel Prajogo, Jan Olhager 2012 IJPE √
Tobias Schoenherr, Morgan Swink 2012 JOM √ √ √ √
Taco van der Vaar and Dirk Pieter van Donk, Cristina Gimenez, Vicenta Sierra 2012 IJOPM √
Siri Terjesen, Pankaj C Patel, Nada R Sanders 2012 DS √
Virpi Turkulainen, Mikko Ketokivi 2012 IJOPM √ √ √ √
Yao Henry Jin, Amydee M Fawcett, Stanley E Fawcett 2013 IJPDLM √
Li Zhao, Baofeng Huo, Linyan Sun, Xiande Zhao 2013 SCMAIJ √
David X. Peng, Anto Verghese, Rachna Shan and Roger G.s Schroeder 2013 JSCM √
Ming-Chang Huang, Ghi-Feng Yen and Tzu-Chuan Liu 2014 SCMAIJ √
Baofeng Huo; Xiande Zhao; Honggeng Zhou 2014 POM √
Gang Zhao, Taiwen Feng, Dan Wang 2015 IMM √
Peter M. Raiston 2015 JSCM √
Daiel Prajogo, Adegoke Oke, Jan Olhager 2016 IJOPM √
[image:59.842.70.783.92.477.2]Barbara, Flynn, Xenophon Koufteros, Guanyi Lu 2016 JSCM NA
49
Author Year Journal Findings SCI-OP
Markham T Frohlich, Roy Westbrook 2001 JOM SI+Quality, SI+Flexibility, CI+Delivery, CI+Flexibility Markham T Frohlich, Roy Westbrook 2002 JOM SI+Flexibility, SI+Cost, CI+Delivery
Theodore P Stank, Scott B Keller, David J Close 2002 TJ CI+OP, II+OP, SI|OP Stanley E Fawcett, Gregory M Magnan 2002 IJPDLM SCI+OP
Cristina Gimenez, Eva Ventura 2005 IJOPM SI+OP, CI+OP, II|OP
Xenophon A Koufteros, Mark Vonderembse, Jayanth Jayaram 2005 DS II+competitive performance, CI+quality performance, SI+competitve&quality performance
Paul D. Cousins, Bulent Menguc 2006 JOM SCI+OP
Ajay Das, Ram Narasimhan, Srinivas Talluri 2006 JOM SI-bell-OP
Soo Wook Kim 2006 SCMAIJ SCI+OP
Xenophon A Koufteros, T C Edwin Cheng, Kee Huang Lai 2007 JOM SI+Quality performance Sarv Devaraj, Lee Krajewski, Jerry C Wei 2007 JOM SI+OP, CI|OP
Morgan Swink, Ram Narasimhan, Cynthia Wang 2007 JOM CI+quality performance, II+all performance dimensions, SI+cost performance Chang Won Lee, Ik-Whan G Kwon, Dennis Severance 2007 SCMAIJ SI+OP, II+OP, CI+OP
Buleny Sezen 2008 SCMAIJ SI+OP, CI+OP
Soo Wook Kim 2009 IJPE SI+OP, II+OP, CI+OP
Veronica H Villena, Luis R Gomez Mejia, Elena Revilla 2009 DS SCI+OP
Barbara B. Flynn, Baofeng Huo, Xiande Zhao 2010 JOM SI+OP, II+OP, CI+OP
Chee Yew Wong, Sakun Boon, Christina Wong 2011 JOM SI, II, CI + all performance dimensions Sakun Boon-itt, Chee Yew Wong 2011 IJPDLM SI+OP, II+OP, CI+OP
Cristina Gimenez, Taco van der Vaart and Dirk Pieter van Donk 2012 IJOPM SCI+OP
Baofeng Huo 2012 SCMAIJ II directly + OP, CI & SI indirectly + OP
Daniel Prajogo, Jan Olhager 2012 IJPE SI+OP, II+OP, CI+OP
Tobias Schoenherr, Morgan Swink 2012 JOM SI,CI+quality&cost performance,II | quality&costs performance. Taco van der Vaar and Dirk Pieter van Donk, Cristina Gimenez, Vicenta Sierra 2012 IJOPM SCI+OP
Siri Terjesen, Pankaj C Patel, Nada R Sanders 2012 DS SCI-Bell-OP
Virpi Turkulainen, Mikko Ketokivi 2012 IJOPM SCI+all performance dimensions Yao Henry Jin, Amydee M Fawcett, Stanley E Fawcett 2013 IJPDLM SCI+OP
Li Zhao, Baofeng Huo, Linyan Sun, Xiande Zhao 2013 SCMAIJ SI+OP, II+OP, CI+OP David X. Peng, Anto Verghese, Rachna Shan and Roger G.s Schroeder 2013 JSCM SI+OP, CI+OP
Ming-Chang Huang, Ghi-Feng Yen and Tzu-Chuan Liu 2014 SCMAIJ SCI+OP
Baofeng Huo; Xiande Zhao; Honggeng Zhou 2014 POM II+OP, CI+OP, SI | OP Gang Zhao, Taiwen Feng, Dan Wang 2015 IMM SI, II, CI - bell- OP
Peter M. Raiston 2015 JSCM SI-OP, CI-OP positive
Daiel Prajogo, Adegoke Oke, Jan Olhager 2016 IJOPM SCI+OP Barbara, Flynn, Xenophon Koufteros, Guanyi Lu 2016 JSCM NA
Note: ‘+’ represents positive relationship, ‘-‘ represents negative relationship, ‘bell’ represents inverse-U shaped relationship,‘|’ represents non-significant relationship
50
Author Year SCI OP Findings SCI-OP
Aggre SI CI II Aggre Delivery Costs Quality Flexibility
SCI & OP at aggregated
level
Stanley E Fawcett, Gregory M Magnan 2002 √ √ SCI+OP
Paul D. Cousins, Bulent Menguc 2006 √ √ SCI+OP
Soo Wook Kim 2006 √ √ SCI+OP
Taco van der Vaar and Dirk Pieter van Donk, Cristina Gimenez 2012 √ √ SCI+OP Siri Terjesen, Pankaj C Patel, Nada R Sanders 2012 √ √ SCI-Bell-OP Yao Henry Jin, Amydee M Fawcett, Stanley E Fawcett 2013 √ √ SCI+OP Ming-Chang Huang, Ghi-Feng Yen and Tzu-Chuan Liu 2014 √ √ SCI+OP Daiel Prajogo, Adegoke Oke, Jan Olhager 2016 √ √ SCI+OP SCI at
aggregated level, OP in
multi-dimensions
Veronica H Villena, Luis R Gomez Mejia, Elena Revilla 2009 √ √ SCI+delivery performance Cristina Gimenez, Taco van der Vaart and Dirk Pieter van Donk 2012 √ √ √ √ √ SCI+ all performance dimensions
Virpi Turkulainen, Mikko Ketokivi 2012 √ √ √ √ √ SCI+all performance dimensions
SCI in multi-dimensions
, OP at aggregated
level
Theodore P Stank, Scott B Keller, David J Close 2001 √ √ √ √ CI+OP, II+OP, SI|OP Cristina Gimenez, Eva Ventura 2005 √ √ √ √ SI+OP, CI+OP, II|OP Ajay Das, Ram Narasimhan, Srinivas Talluri 2006 √ √ SI-bell-OP
Sarv Devaraj, Lee Krajewski, Jerry C Wei 2007 √ √ √ SI+OP, CI|OP Chang Won Lee, Ik-Whan G Kwon, Dennis Severance 2007 √ √ √ √ SI+OP, II+OP, CI+OP
Buleny Sezen 2008 √ √ √ SI+OP, CI+OP
Soo Wook Kim 2009 √ √ √ √ SI+OP, II+OP, CI+OP
Barbara B. Flynn, Baofeng Huo, Xiande Zhao 2010 √ √ √ √ SI+OP, II+OP, CI+OP
Baofeng Huo 2012 √ √ √ √ II directly + OP, CI & SI indirectly + OP Daniel Prajogo, Jan Olhager 2012 √ √ √ √ SI+OP, II+OP, CI+OP
Li Zhao, Baofeng Huo, Linyan Sun, Xiande Zhao 2013 √ √ √ √ SI+OP, II+OP, CI+OP David X. Peng, Anto Verghese, Rachna Shan 2013 √ √ √ SI+OP, CI+OP Baofeng Huo; Xiande Zhao; Honggeng Zhou 2014 √ √ √ √ II+OP, CI+OP, SI | OP
Gang Zhao, Taiwen Feng, Dan Wang 2015 √ √ √ √ SI, II, CI - bell curve- OP
Peter M. Raiston 2015 √ √ √ SI+OP, CI+OP
SCI&OP in multi-dimensions
Markham T Frohlich, Roy Westbrook 2001 √ √ √ √ √ SI+Quality, SI+Flexibility, CI+Delivery, CI+Flexibility Markham T Frohlich, Roy Westbrook 2002 √ √ √ √ √ SI+Flexibility, SI+Cost, CI+Delivery
Xenophon A Koufteros, Mark Vonderembse, Jayanth Jayaram 2005 √ √ √ √ √ √ √ II+competitive performance, CI+quality performance, SI+competitve&quality performance
Xenophon A Koufteros, T C Edwin Cheng, Kee Huang Lai 2007 √ √ SI+Quality performance
Morgan Swink, Ram Narasimhan, Cynthia Wang 2007 √ √ √ √ √ √ √ CI+quality performance, II+all performance dimensions, SI+cost performance Chee Yew Wong, Sakun Boon, Christina Wong 2011 √ √ √ √ √ √ √ SI, II, CI + all performance dimensions
Sakun Boon-itt, Chee Yew Wong 2011 √ √ √ √ SI,II,CI+delivery performance
Tobias Schoenherr, Morgan Swink 2012 √ √ √ √ √ √ √ SI,CI+quality&costperformance, II | quality&costs performance.
Barbara, Flynn, Xenophon Koufteros, Guanyi Lu 2016 √ √ √ NA
51
Relationship between SCI and OP
One review question is ‘what has been found in terms of the impact of SCI on OP?’ It is therefore relevant to determine what kinds of relationships between SCI and OP have been argued and empirically proven in the selected papers, and whether they explicitly or implicitly discussed such relationships. Furthermore, the selected papers were coded on the nature of the relationship of the findings in Table 7. However, these findings are not suitable to be compared directly because SCI and OP were measured at different levels. Thus these findings were segmented into four scenarios in terms of:
Both SCI and OP are measured from an aggregated level.
SCI is measured in three sub-dimensions, and OP is measured from an aggregated level.
SCI is measured from an aggregated level, and OP is measured from four sub-dimensions.
Both SCI and OP are measured in sub-dimensions.
52
Although most findings still tend to support a positive SCI-OP relationship, indeed there are certain inconsistent results. The forth scenario shows expanded inconsistency along with OP measured in sub-dimensions. For example, Koufteros et al. (2014) found in their study that II only contributes to competitive performance, CI positively correlates with quality performance and SI significantly loads to both competitive and quality performance. Likewise, Schoenherr and Swink (2012) demonstrated an insignificant relationship between II and quality and cost performance. In contrast, Wong et al. (2011a) and Jonsson et al. (2011) published results which support overall positive relationships among any sub-dimensions.
One can see, it is the classification of SCI rather than OP which brings inconsistent findings. Further classification merely brings more complex and confused results, which creates more difficulty for scholars to induce existing results into a theory. Flynn et al. (2016) claimed that further studies should contribute to including more factors rather than making more classifications.
53
Author Year Journal Moderator Findings Moderating effect
Paul D. Cousins, Bulent Menguc 2006 JOM Socialization Socialization positively moderates SCI-OP Soo Wook Kim 2006 SCMAIJ Firm size Firm size positively moderates SCI-OP. Xenophon A Koufteros, T C Edwin Cheng, Kee
Huang Lai 2007 JOM Firm size Firm size negatively moderates SI-OP Sarv Devaraj, Lee Krajewski, Jerry C Wei 2007 JOM eBusiness
technology eBusiness positively moderates both of SI and CI Veronica H Villena, Luis R Gomez Mejia,
Elena Revilla 2009 DS
Environmental
volatility Environmental volatility negatively moderates SCI-OP Barbara B. Flynn, Baofeng Huo, Xiande Zhao 2010 JOM Customer learning Customer learning positively moderate SI, II, and CI with OP
Chee Yew Wong, Sakun Boon, Christina
Wong 2011 JOM
Environmental
Uncertainty Environmental uncertainty negatively moderates SCI-OP Sakun Boon-itt, Chee Yew Wong 2011 IJPDLM
Demand Uncertainty & Technology
uncertainty
Technology uncertainty positively moderates SI-OP, negatively moderates II-OP, insignificant on CI; demand uncertainty negatively moderates SI and II, insignificant on CI.
Cristina Gimenez, Taco van der Vaart and
Dirk Pieter van Donk 2012 IJOPM Supply complexity Supply chain complexity negatively moderates SCI-all performance dimensions
Tobias Schoenherr, Morgan Swink 2012 JOM II II positively moderates SI and CI on both delivery and flexibility, insignificant on either quality or costs. Taco van der Vaar and Dirk Pieter van Donk,
Cristina Gimenez, Vicenta Sierra 2012 IJOPM Supply complexity Supply chain complexity negatively moderates SCI-OP Siri Terjesen, Pankaj C Patel, Nada R Sanders 2012 DS Environmental
Uncertainty Environmental uncertainty negatively moderates SCI-bell-OP. Li Zhao, Baofeng Huo, Linyan Sun, Xiande
Zhao 2013 SCMAIJ
Supply delivery risk & Demand variability risk
SI CI II all positive relate to OP; supply delivery risk negatively moderates SI CI and II; demand variability risk negatively moderates CI.
David X. Peng, Anto Verghese, Rachna Shan
and Roger G.s Schroeder 2013 JSCM Product Clockspeed Product clockspeed positively moderate CI-OP, non-significant on SI-OP Ming-Chang Huang, Ghi-Feng Yen and
Tzu-Chuan Liu 2014 SCMAIJ
Demand Uncertainty & Technology
uncertainty
Demand uncertainty positively moderates SCI-OP, technology uncertainty negatively moderates SCI-OP Baofeng Huo; Xiande Zhao; Honggeng Zhou 2014 POM Local competition No moderating effect from local competition
Gang Zhao, Taiwen Feng, Dan Wang 2015 IMM Top management
support Top management support positively moderates either SI CI and II -bell- financial performance. Peter M. Raiston 2015 JSCM Demand response Demand response positively moderate CI-OP, negatively moderate SI-OP
Daiel Prajogo, Adegoke Oke, Jan Olhager 2016 IJOPM Lean strategy Lean strategy positively moderate SCI-OP Barbara, Flynn, Xenophon Koufteros, Guanyi
Lu 2016 JSCM
Micro-Meso-Macro uncertainty
Micro-uncertainty positively moderate CI, Meso-Macro-uncertainty negatively moderate CI; Micro-uncertainty negatively moderate II and SI, Meso-Macro-uncertainty does not moderate on II and SI