warwick.ac.uk/lib-publications
Original citation:
Liu, Kun, Tian, Miao, Jiang, Junfeng, An, Jianchang, Xu, Tianhua, Ma, Chunyu, Pan, Liang,
Wang, Tao, Li, Zhichen, Zheng, Wenjie, Xue, Meng, Wu, Fan and Liu, Tiegen. (2016) An
improved positioning algorithm in a long-range asymmetric perimeter security system.
Journal of Lightwave Technology, 34 (22). pp. 5278-5283.
Permanent WRAP URL:
http://wrap.warwick.ac.uk/93960
Copyright and reuse:
The Warwick Research Archive Portal (WRAP) makes this work by researchers of the
University of Warwick available open access under the following conditions. Copyright ©
and all moral rights to the version of the paper presented here belong to the individual
author(s) and/or other copyright owners. To the extent reasonable and practicable the
material made available in WRAP has been checked for eligibility before being made
available.
Copies of full items can be used for personal research or study, educational, or not-for profit
purposes without prior permission or charge. Provided that the authors, title and full
bibliographic details are credited, a hyperlink and/or URL is given for the original metadata
page and the content is not changed in any way.
Publisher’s statement:
“© 2016 IEEE. Personal use of this material is permitted. Permission from IEEE must be
obtained for all other uses, in any current or future media, including reprinting
/republishing this material for advertising or promotional purposes, creating new collective
works, for resale or redistribution to servers or lists, or reuse of any copyrighted component
of this work in other works.”
A note on versions:
The version presented here may differ from the published version or, version of record, if
you wish to cite this item you are advised to consult the publisher’s version. Please see the
‘permanent WRAP URL’ above for details on accessing the published version and note that
access may require a subscription.
For Review Only
Abstract—In this paper, an improved positioning algorithm is proposed for the long range asymmetric perimeter security system. This algorithm employs zero-crossing rate to detect the disturbance starting point, and then utilizes an improved empirical mode decomposition (EMD) to obtain the effective time-frequency distribution of the extracted signal. In the end, a cross correlation is used to estimate the time delay of the effective extracted signal. The scheme is also verified and analyzed experimentally. The field test results demonstrate that the proposed scheme can achieve a detection of 96.60% of positioning errors distributed within the range of 0~±20 m at the sensing length of 75 km, which significantly improves the positioning accuracy for the long range asymmetric fence perimeter application.
Index Terms—Fiber optic distributed sensor, Asymmetric dual Mach–Zehnder interferometer (ADMZI), positioning algorithm, signal analysis, Empirical mode decomposition (EMD).
I. INTRODUCTION
s a new type of passive distributed sensing system distributed fiber optic sensing system is widely used in long-distance pipelines invasion, leak detection, border security, and other fields, etc. [1-8]. With the rapid development of optical fiber sensing technology, fiber security systems have been generated based on dual Mach-Zehnder interferometry (DMZI) vibration detection. Compared with the traditional security systems, the security system based on DMZI has the advantages of high sensitivity, anti-electromagnetic interference and low loss, etc. The key technology of obtaining disturbance position in Asymmetric Dual Mach-Zehnder Interferometer (ADMZI) systems is the positioning algorithm. Currently many cases have been reported regarding the positioning accuracy of the DMZI.
This work was supported in part by the National Natural Science Foundation of China under Grant 61475114, 61405139, 61227011, 61378043 and 61505138, in part by National Instrument Program under Grant 2013YQ030915, in part by the National Basic Research Program of China under Grant 2010CB327806, in part by the Tianjin Science and Technology Support Key Project under Grant 11ZCKFGX01900. (M. Tian and K. Liu contributed equally to this work. Corresponding author: K. Liu and J. F. Jiang)
M. Tian, K. Liu, J. F. Jiang, C. Y. Ma, T. Wang, Z. C. Li, W.J. Zheng, M. Xue, F. Wu, and T. G. Liu. Zhang are with the College of Precision Instrument & Opto-electronics Engineering, Tianjin University, Tianjin, 300072, P. R. China, and the Key Laboratory of Opto-electronics Information Technology, Ministry of Education, P. R. China (E-mail: [email protected])
Yang An et al. proposed the use of cross-correlation function to estimate the arrival time difference of the two channels disturbance signals, together with applying simulated annealing as the control algorithm to reduce the locating error, which was not only complex to operate and difficult to implement, but also increased the cost of the system [9]. One study by Q. Chen et al. significantly improved the computational speed by using the zero-crossing method for detecting vibration starting point and extracting effective data components before the general cross-correlation function. Although the positioning accuracy is 20m, the range is not large enough in some place [6]. Xie et al. used a Butterworth high-pass filter (HPF) to broaden the 3-dB bandwidth of the power spectrum of interference signal, and achieved a smaller locating mean square error (MSE) in the system [5], [10]. Although Xie’s algorithm analyzed and reduced the positioning error of DMZI sensor, it ignored the environment noise in theperimeter security.
In order to solve the problems existing in the current equipment such as large positioning error, this paper theoretically analyzes the positioning error of the ADMZI sensing system. Based on the analysis of the theory, we propose an improved positioning algorithm with a low positioning error. Firstly, we achieve endpoint detection with the highest zero-crossing rate (ZCR) as the ZCR is easy and efficient to implement [11], [12]. Meanwhile, in order to obtain a valid signal disturbance and to reduce the computation time, we process the signal based on an improved empirical mode decomposition (EMD) method [13] which uses the correlate coefficient significant test to discard the low test value intrinsic mode function (IMF) components and reconstructs the rest of the signal. Finally, cross correlation is used to estimate the time delay based on the reconstructed signals [14], [15]. Compared to the other reported positioning algorithms, experimental results verify that our scheme has improved a higher positioning accuracy and achieved a smaller positioning error.
II. SCHEMATIC OF THE ADMZIVIBRATION SENSOR AND
POSITIONING PRINCIPLE
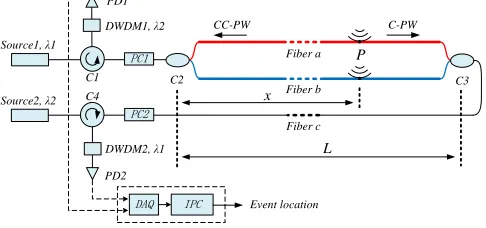
The structure of an ADMZI by using two DFB (distributed feedback) lasers and matching DWDM (dense wavelength division multiplexing) [16] is shown in Fig. 1, where the two outputs of the lasers (λ1 and λ2) are equally split by couplers C2 and C3, respectively, then λ1 and λ2 propagate in opposite directions in the ADMZI. In clockwise (CW) MZI, the λ1
An Improved Positioning Algorithm in Long
Range Asymmetric Perimeter Security System
Miao Tian, Kun Liu, Junfeng Jiang, Tianhua Xu, Chunyu Ma, Tao Wang, Zhichen Li, Wenjie Zheng,
Meng Xue, Fan Wu, Tiegen Liu
A
1For Review Only
interfere with itself at the C3 after being split by C2. The propagation path of the λ1 passes though C1-C2-C3-C4, and is filtered by DWDM1 and detected by PD2 (photo-detector). As DWDM2 can remove the C-RB (clockwise propagated Rayleigh backscattering wave) noise of λ2 and let the C-PW (clockwise propagated primary wave) of λ1 go through perfectly, we can easily acquire the signal of C-PW with a high SNR (signal to noise ratio). Here we use two different wavelengths of λ1 and λ2 as the sources that are close to 1550 nm, and the difference between λ1 and λ2 are larger than the window separation of 0.8 nm. PC1 (polarization controller) and PC2 are used to compensate the visibility variation in each MZI. The situation in the counter-clockwise (CCW) direction MZI is the same.
Assume that a disturbance is suited at a distance of x. From Fig.1, we can see that the time delay d between the distances from P to PD1 (CCW) and from P to PD2 (CW) is usually different. The time difference d can be calculated as:
( 2 ) /
d n L x c (1) Where c is the velocity of lightwave in vacuum (3×10⁸m/s), n is the effective refractive index of fiber optic core, L is the length of the test cable. Here, c, n and L are all constant. From equation (1), we can deduce the disturbance position x from the time delay d.
However, there are different kinds of noises in ADMZI in practical applications, the AC components of the received
noise-involved interference signal can be expressed as [5], [6]:
1 1 1 1 1 1 1
2
2 2 2 2 2 2 2
1 ( )
( ) [1 ( )] cos[2 ( ) ( ) ( )] ( ) ( ) ( )
( ) [1 ( )] cos[2 ( ) ( ) ( )] ( ) ( )
a p b c
a p b c
l t
I t n t t n t n t n t n t
l t d
I t n t t n t n t n t n t
(2)
Where l(t) is the OPD (optical path difference) generated by vibration, λ1 and λ2 are the wavelengths of source1 and source2 in the two MZIs. Polarization effect induces the visibility noise na1(t), na2(t) and the visibility noise nε1(t), nε2(t). The slight vibration induces the additional environment noise ξ1(t) and ξ2(t) in the system. np1(t) and np2(t) are the phase noise introduced by the frequency noise of the laser source, nc1(t) and nc2(t) are the additive circuit noise, respectively, nb1(t) and nb2(t) are the back-scattering noise coming from the mixture of interference
signals between CC-RB in fiber a and b as well as the interference between CC-RB and CC-PW in the coherence area. According to the above analysis, the use of model (1) will lead to an inaccurate time difference d only with a simple cross correlation function. Thus we can add a restriction and make an assumption to solve this issue.
Restriction: In order to assure that the ξ1(t) and ξ2(t) are almost constant during the time of experiment, we set each duration of experiment to a small value.
Assumption: The additive circuit noises nc1(t) and nc2(t) can be regarded as white noise with small amplitude.
On the basis of the above restrictions, as the np1(t) and np2(t) can be reduced by utilizing a narrow line-width laser and compensating the length difference between the two interferometer arms, we can neglect the phase noise. The effect of additive circuit noises nc1(t) and nc2(t) can also be neglected. Similarly, we can also adjust polarization state of the lightto compensate na1(t) and na2(t), nε1(t) and nε2(t) [17-19]. Although the sensing range is long, the SNR still stays high and therefore RB noise nb1(t) and nb2(t) cannot be neglected [19]. Besides, we can easily suppress the RB noise and acquire the signal of CC-PW with a high SNR in the ADMZI structure [16].
Therefore, the alternating current components of the two output signals can be simplified as:
1 1
2
2 2
1
( )
( ) cos[2 ( )]
( )
( ) cos[2 ( )]
l t
I t t
l t d
I t t
(3)
From the equation (3), we can see I1(t) and I2(t) are cosine functions. l(t) and l(t-d) are both functions depending on time t only. So, the frequencies of I1(t) and I2(t) are proportional to the frequencies of l(t) and l(t-d) respectively. We can utilize the time-frequency distributions for the I1(t) and I2(t) instead of l(t) and l(t-d) to compute the time delay d. ξ1(t) and ξ2(t) are constant.
III. PRINCIPLE OF THE PROPOSED POSITIONING ALGORITHM
Fig. 2 shows the consequence frame of the positioning algorithm. Firstly, we extract the endpoint of the disturbance signal based on zero-crossing technique. Then we use the improved empirical mode decomposition (EMD) method to discard the low test value IMF components and to reconstruct the rest of the signal. Finally, the cross correlation is used to estimate the time delay using the reconstructed signals.
A. Endpoint detection based on ZCR
ZCR is usually applied to discrete-time signals such as distinguishing the sounds of different frequencies [12]. ZCR can be expressed as:
Endpoint Detection An Improved
EMD Method Cross-Correlation Intrusion Signal
Fig.2. Framework of position algorithm.
DAQ IPC
L P
Event location C1
C4
C2 C3
PD1
PD2
x
PC2 PC1
Source1, λ1
Source2, λ2
DWDM1, λ2 CC-PW C-PW
Fiber a
Fiber b
Fiber c
DWDM2, λ1
Fig.1. Schematic diagram of ADMZI disturbance sensing system. C2, C3: 3dB fiber coupler; C1, C4: Optical circulator; PD1, PD2: Photo-detector; PC1, PC2: Polarization Controller; DWDM1, DWDM2: dense wavelength division multiplexers; DAQ: Data Acquisition Card; IPC: Industrial Personal Computer; C-PW, CC-PW: the clockwise and counter-clockwise propagated primary wave.
[image:3.612.50.293.232.346.2] [image:3.612.319.574.519.553.2]For Review Only
sgn ( ) sgn ( 1) ( )
1 ( ) 0
sgn ( )
1 ( ) 0
1 / 2 0 1
( ) 0
n
ZCR x m x m n m
x n where x n
x n
N n N and n
otherwise
(4) Note that N is the length of a selected frame. sgn[x] is a symbolic function. ( )n is a rectangular window function. The principle of signal interception based on ZCR is: the undisturbed signal or noise signal differs from the disturbance signal in frequency domain so that the ZCR of disturbance signal is higher than that of the undisturbed signal or noise signal. Therefore we can pull out the disturbance signal from the undisturbed signal or noise signal easily. In order to improve the robustness of ZCR, it also needs to meet the requirement that vibration amplitude should exceed a certain threshold when the signal is calculated through ZCR. Signal higher than the threshold signal segment is identified as disturbing signal; on the contrary, signal lower than the threshold is regarded as the noise signal or interference signal.
In order to fulfill the assumption and locate the zero-crossing point, we apply the double-threshold crossing method to eliminate the additive circuit noises. As the threshold might truncate the discrete-time signals if the differences between the threshold and successive samples have different algebraic signs. We set the two thresholds as δ1 and δ2, where δ1>0, δ2<0, and |δ1|=|δ2|. We note that, in order to eliminate the effect of additive circuit noises, the value of |δ1| should be larger than the amplitudes of noise.
And we note that if a point is a zero crossing, it must meet three conditions:
1)The amplitude of the point Zk (k=1,2,3…K) is zero. 2)The product of the amplitude of Zk-1 (which is before Zk)
and Zk+1 (which is after Zk) is less than zero.
3)The amplitudes of Zk-1 and Zk+1 cross over the two thresholds δ1and δ2 respectively.
When a point meets the above three conditions at the same time, it can be located as one zero-crossing point. Then we can obtain the endpoint of the disturbance signal from the maximum zero-crossing.
B. An improved EMD method
The empirical mode decomposition is a self-adaptive decomposition method based on the local characteristics of the signal, which can effectively decompose the original time-domain signal into the intrinsic mode function with multi-scale time-frequency characteristics. EMD is usually applied to non-linear and non-stationary processes [20].
Obviously, the disturbance signal of a long range asymmetric perimeter security system is an unsteady signal, which can be decomposed into a collection of IMF components. Each IMF should meet two conditions: (1) in the whole data set, the number of extrema and the number of zero-crossings must either
equal or at most have one difference; (2) at any point, both the mean value of the envelope defined by the local maxima and the envelope defined by the local minima are zero.
The correlate coefficient is the most common measurement to evaluate the correlation between variables. Generally speaking, the small correlate coefficient means the low correlation between the variables; and vice versa. However, the increase in the length of signals makes the correlate coefficient become lower and the error get larger. Therefore it is obviously inaccurate to only apply the correlate coefficient to evaluate the correlation between investigated signals. Alternatively, we apply t test which is one of the significant test of correlate coefficient to evaluate the significant of correlate coefficient between the concerned signals based on statistics principles [21]. The steps of the significant test are following:
1)Decompose the vibration signal into a collection of IMFs ci (i= 1,2,3…M). Calculate the correlate coefficienti for each IMF component with the original signal by formula (5):
j 1
2 2
1 1
( )( ( ) ( ))
( ) ( ( ) ( )) R
ij i
j
i R R
ij i j
j j
c c x t x t
c c x t x t
(5)
Where the i th is the IMF component. M is the number of the IMF components. R is the total number of points.
2)The t test value of the correlate coefficientiis expressed as:
2
2
1 i i
i R t
(6) 3)Check the t distribution table to obtain the critical value
/ 2
t based on the given significance level
andfreedom degrees (R-2). If ti t/ 2, i is considered to be insignificant in statistics, therefore the corresponding IMF components will be eliminated. Otherwise, it is considered to be significant, and corresponding IMF components will be reserved.
Reconstruct the remaining IMF components after sweeping t distribution, and we can obtain the time-frequency information of the disturbance signal.
C. Time delay estimation based on cross-correlation
Assuming that the correlated noises are stationary in a short period, we can directly estimate the time delay between the selected signals after obtaining time-frequency information of the disturbance signal. The time delay estimation based on the cross-correlation signal - noise model is [22]:
1 1
2 2
( ) ( ) ( ) ( ) ( ) ( ) I t s t n t I t s t n t
(7)
Where s(t) is the delay signal, n1(t) and n2(t) are the additive white Gaussian noise. Assuming that s(t), n1(t), n2(t) are zero-mean random stationary process, and s(t), n1(t), n2(t) are independent, the cross-correlation function between them is
For Review Only
approximately zero. After I1(t) and I2(t) calculated based on cross-correlation, we can have:
1 2 2 1 1 2
1 2
( )
(
)
( )
( )
( )
(
)
ss s n s n n n
I I
ss
R
t
R t
R
t
R
t
R
t
R t
(8) Where R tss( ) is the autocorrelation function of s(t). According to the nature of the autocorrelation function, when t=-τ, we can obtain the maximum of autocorrelation function. Therefore the time delay d can be estimated by locating the peak position of cross-correlation function1 2( )
I I R t .
IV. FIELD EXPERIMENTS AND ANALYSIS
The practical experiment setup is shown in Fig 1. The length of the sensing cable is 75 km with single mode fibers. The two laser sources λ1 and λ2 are 1549.95nm and 1550.74nm distributed feedback laser respectively with a power of 5 mW and a line-width of 50 kHz (corresponding to the coherence length of 6 km). The central wavelengths of DWDM1 and DWMD2 are 1550.12 nm and 1550.92 nm respectively and with the pass-band width of ±0.22 nm to match λ1and λ2. The two light beams propagate CW directions (C1-C2-C3-C4) and CCW directions (C4-C3-C2-C1) respectively. The synchronous sampling rate of DAQ card and the sampling time of a frame signal are set to be 10 MS/s and 0.3 s respectively. We have conducted 500 sets of in-field experiments in the system, the intrusion is generated at the distance
x
= -45041m by knocking the fence.A. Endpoint detection
Firstly, we obtain the endpoint of the vibration signal based on ZCR after the vibration signal is noise-filtered. The vibration signal of knocking cable and disturbance extraction section are shown in Fig. 3 (b). And Fig. 3 (c) shows the zero-crossing rate distribution of the vibration signal.
Fig. 3(a) and (b) show the interference signals and undisturbed signal. From the figures, it can be seen that the phase change induced by the intrusion event varies much more fiercely than the environment noise. We can also see different signal densities at different time periods, and the output intrusion signal shows great irregularity. Besides, the large amount of acquisition points will lead to a long time operation if signal is decomposed by EMD subsequently. It is important for selecting a valid signal region.
From Fig. 3 (c) we can obtain the distribution of the disturbance signal and easily find the peak position of the curve. On the basis of the positioning theory [6], a high ZCR of the signal segment means a large bandwidth with high positioning accuracy. Therefore we detect the peak position of the ZCR curve and extract 50k samples which are around the peak as the effective signal region.
B. An improved EMD method
From Fig. 4 we can see the vibration signal is decomposed into IMF components by empirical mode decomposition. The
disturbance signal can be expressed as:
( ) ( ) ( )
1 M
x t c t r t i M i
(9) From Fig. 4 we can visually see that although each IMF component is decomposed by the original signal, the relevance between each IMF component and the original signal is different, therefore, the redundant IMF components with a low
0 0.5 1 1.5 2 2.5 3
x 106 -5
0
5 (a) No Intrusion Signal
Data Points A m p litu d e (V )
0 0.5 1 1.5 2 2.5 3
x 106 -10 0 10 Data Points A m p litu d e (V )
(b) Intrusion Signal
0 0.5 1 1.5 2 2.5 3
x 106 0
0.005 0.01
(c) ZCR of One Channel Signal
Data Point
Z
C
R
50k
Fig. 3. Undisturbed signal and interference signals. (a) No intrusion. (b) Knocking cable. (c) ZCR of the knocking cable.
1.0 1.0
S
EMD of Intrusion Signal
-1.0 1.0 i1 -1.0 1.0 i2 -1.0 1.0 i3 -0.5 0.5 i4 -0.5 0.5 i5 -0.5 0.5 A m p litu d e (V ) i6 -0.5 0.5 i7 -0.2 0.2 i8 -0.2 0.2 i9 -0.5 0.5 i1 0 -0.5 0.5 re s.
Fig. 4. EMD decomposition.
0 1000 2000 3000 4000 5000 6000 -0.5 0 0.5 Data Points N o rm a lize d A a m p litu d
e (a) One Channel Signal
0 1000 2000 3000 4000 5000 6000 -1
0
1 (b) Another Channel Signal
Data Points N o rm a lize d A a m p litu d e
0 2000 4000 6000 8000 10000 12000
-50 0 50 100 150 200
(c) Correlation Curve
[image:5.612.322.567.146.286.2]Data Points C o rr e la tio n Co e ff ici e n t The MaximumPoint
Fig. 5. Reconstruct the signal. (a) One channel signal. (b) Another channel signal. (c) Correlation coefficient of the two channel signal.
[image:5.612.319.566.321.717.2]For Review Only
correlation can be removed.
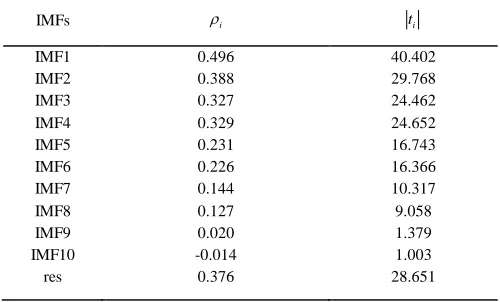
According to (5), (6), the absolute value of the t test ti and the correlation coefficients i of each IMF are shown in Table I.
We set
to 0.05, R 2 4998 and get t/ 2 1.9604by checking the t-distribution table. Comparing ti to the t-distribution at t/ 21.9604, if the former is larger, the corresponding IMF components is retained, otherwise is discarded. Here we eliminate IMF9, IMF10 and reserve the rest. Finally, we reconstruct the disturbed signal by preserving IMF components to obtain the time-frequency information of the disturbed signal, which is shown in Figure 5 (a), (b).C. Location based on cross-correlation
After reconstructing the disturbed signal based on the improved EMD method we can get time-frequency information of the disturbed signal. And then the correlation curve of the two channel signal is obtained, which is shown in Fig. 5 (c). From Fig. 5 (c), we can obtain the time delay estimation by simply using the cross-correlation algorithm.
As a comparison, the experiment based on endpoint detected and cross-correlation (ZCR-CC) without EMD is also conducted. TABLE II shows position error statistics of 500 sets experiments using the proposed method and ZCR-CC without EMD method.
From the TABLE II, compared to ZCR-CC without EMD (MAE =31.622 m, SD =52.3317 m), the proposed method (MAE = 4.7360 m, SD = 7.7376 m) can significantly reduce the SD and MAE of the location error, and can improve the positioning accuracy in the long range asymmetric fence perimeter system.
According to the experimental results, we can see that the
proposed method can detect up to 96.60% of positioning errors distributed within ±20m. Especially, 84.80% of the location error distributes within ±10 m can be detected, which is very close to the theoretical precision limit. That means that only a minor part of error is outside the range of ±20 m.
V. CONCLUSIONS
This paper proposes an improved positioning algorithm in long range ADMZI vibration sensors. We have theoretically analyzed the principle of the positioning in the long range optical fiber perimeter security system by taking into account all types of noises. According to the theoretical analysis, we applied ZCR to extract the endpoint of the intrusion signal. Then we used an improved EMD method to eliminate low redundant IMF components and to obtain a valid signal disturbance. Finally, the cross correlation function was used to estimate the time delay of the reconstructed signals. The field experiments demonstrate that the proposed approach can achieve the detection of 96.60% of positioning errors distributed within the range of 0~±20 m at the sensing length of 75 km, which has a good potential in practical long range asymmetric perimeter security systems.
REFERENCES
[1] J. C. Juarez, E. W. Maier, K. N. Choi, and H. F. Taylor, “Distributed fiber-optic intrusion sensor system, ” IEEE J. Lightw. Technol., vol. 23, pp. 2081, June. 2005.
[2] Y. Liu, L. Wang, C. Tian, M. Zhang, and Y. Liao, “Analysis and optimization of the PGC method in all digital demodulation systems,” J. Lightw. Technol., vol. 26, no. 18, pp. 3225–3233, Sep./Oct. 2008. [3] S. Liang, C. Zhang, W. Lin, L. Li, C. Li, X. Feng, B. Lin, “Fiber-optic
intrinsic distributed acoustic emission sensor for large structure health monitoring,” Opt. Lett., vol. 34, pp. 1858–1860, Jun. 15 2009. [4] S. Xie, M. Zhang, S. Lai, and Y. Liao, “Positioning method for dual
Mach-Zehnder interferometric submarine cable security system,” Proc. SPIE, vol. 7677, pp. 76770A-1–76770A-4, 2010.
[5] S. Xie, Q. Zou, L. Wang, M. Zhang, Y. Li, and Y. Liao, “Positioning error prediction theory for dual Mach-Zehnder interferometric vibration sensor,” IEEE J. Lightw. Technol., vol. 29, no. 3, pp. 362–368, Feb.1, 2011.
[6] Q. Chen, T. Liu, K. Liu, J. Jiang, Z. Shen, Z. Ding, H. Hu, L. Pan and C. Ma, “An Improved Positioning Algorithm with High Precision for Dual Mach–Zehnder Interferometry Disturbance Sensing System,” IEEE J. Lightw. Technol., vol. 33(10), pp. 1954-1960, May. 2015.
[7] X. Zhang, T. Liu, K. Liu, J. Jiang, Z. Ding, and Q. Chen, “Reducing location error and processing time of dual Mach-Zehnder interferometric fiber perturbation sensor using zero-crossing analysis,” in Proc. 22nd Int. Conf. Opt. Fiber Sensor, pp. 8421A8-1–8421A8-4, Oct. 2012. [8] B. Kizlik, “Fibre optic distributed sensor in Mach-Zehnder interferometer
configuration,” in Proc. Int. Conf. Modern Problems Radio Eng., Telecommun. Comput. Sci., 2002, pp. 128–130.
[9] Yang An, Hao Feng, Yan Zhou, Shi-jiu Jin, Zhou-mo Zeng, “A Control Method to Eliminate Polarization-Induced Phase Distortion in Dual Mach-Zehnder Fiber Interferomete,” IEEE 2012 UKAC International Conference, pp.988–991, 2012..
[10] S. Xie, M. Zhang, Y. Li, and Y. Liao, “Positioning error reduction technique using spectrum reshaping for distributed fiber interferometric vibration sensor,” IEEE J. Lightw. Technol., vol. 30, no. 22, pp. 3520–3524, Fov.15, 2012.
[11] Bachu. R.G, Kopparthi. S, Adapa. B, Barkana. B.D, “Separation of voiced and unvoiced using zero crossing rate and energy of the speech signal,” in Proc. Amer. Soc. Eng. Education Zone Conf., 2008, pp. 1–7. [12] S. S. Mahmoud and J. Katsifolis, “Elimination of rain-induced nuisance
[image:6.612.47.297.134.285.2]alarms in distributed fiber optic perimeter intrusion detection systems,” in TABLE I
CORRELATE COEFFICIENT AND ABSOLUTE VALUE OF T-DISTRIBUTION TEST.
IMFs i ti
IMF1 0.496 40.402
IMF2 0.388 29.768
IMF3 0.327 24.462
IMF4 0.329 24.652
IMF5 0.231 16.743
IMF6 0.226 16.366
IMF7 0.144 10.317
IMF8 0.127 9.058
IMF9 0.020 1.379
IMF10 -0.014 1.003
res 0.376 28.651
TABLE II
COMPARISON OF POSITIONING ERROR STATISTICS BETWEEN THE PROPOSED METHOD AND ZCR-CC WITHOUT EMD METHOD
Method Mean absolute
error(MAE/m) Standard deviation(SD/m)
Proposed Method 4.7360 7.7376
ZCR-CC without EMD 31.1622 52.3317
For Review Only
Proc. SPIE Defense, Security, and Sensing, 2009, pp.731604-1–731604-11.
[13] J.H.Zhang, Y.C.Han, L.Z.Li, J.Liu, B.Che, “An Improved EMD Time-Frequency Analysis Method for Rocket Vibration Signal,” Proceedings of 2014 IEEE Chinese Guidance, Navigation and Control Conference, 2014, pp.1842-1846.
[14] I. Cespedes, J. Ophir, and S.K. Alam, “The combined effect of signal decorrelation and random noise on the variance of time delay estimation,” IEEE Trans. Ultrason., Ferroelectr. Freq. Control, vol. 44, no. 1, pp. 220–225, Jan. 1997.
[15] Y. Rui and D. Florencio, “Time delay estimation in the presence of correlated noise and reverberation,” in Proc. IEEE Int. Conf. Acoust., Speech Signal Process., 2004, vol. 2, pp. ii-133–6.
[16] Chunyu Ma, Tiegen Liu, Kun Liu, Junfeng Jiang, Zhenyang Ding, Liang Pan and Miao Tian, “Long range distributed fiber vibration sensor using an asymmetric dual Mach-Zehnder interferometers,” IEEE J. Lightw. Technol., vol. 34(9), pp. 2235 - 2239, 2016.
[17] A. D. Kersey, A. Dandridge, and A. B. Tveten, “Dependence of visibility on input polarization in interferometric fiber-optic sensors,” Optics Letters., vol. 13, no. 4, pp. 288–290, 1988.
[18] A. D. Kersey, M. J. Marrone, and A. Dandridge, “Observation of inputpolarization-induced phase noise in interferometric fiber-optic sensors,” Optics Letters, vol. 13, no. 10, pp. 847–849, 1988.
[19] A. Galtarossa, L. Palmieri, M. Schiano, and T. Tambosso, “Statistical characterization of fiber random birefringence,” Optics Letters, vol. 25, no. 18, pp. 1322–1324, 2000.
[20] Kun Liu, Miao Tian, Tiegen Liu, Junfeng Jiang, Zhenyang Ding, Qinnan Chen, Chunyu Ma, Chang He, Haofeng Hu, Xuezhi Zhang, “A High-Efficiency Multiple Events Discrimination Method in Optical Fiber Perimeter Security,” IEEE J. Lightw. Technol., vol. 33(23), pp. 4885 - 4890, 2015.
[21] Shibing You, Yanqin Yu. Statistics [M]. Wuhan: Wuhan University Press, 2001, 115-118.
[22] C. Knapp and G. C. Carter, “The generalized correlation method for estimation of time delay,” IEEE Transactions on Acoustics, Speech and Signal Processing, 24: 320-327, 1976.
Kun Liu received the B.Eng. degree in opto-electronics information engineering and the M.Eng. and Ph.D. degrees in optical engineering, in 2004, 2006, and 2009 respectively, all from Tianjin University, Tianjin, China.
From 2009 to 2010, he pursued his Postdoctoral Research in Tianjin University, where he is currently an Associate Professor with the College of Precision Instrument and Optoelectronics Engineering. He is also with the Key Laboratory of Opto-electronics Information and Technical Science (Tianjin University), Ministry of Education. His research interests include the development of physics and chemistry sensing system based on optical fiber laser.
Miao Tian was born in Chongqing, China, in 1990. She received a B.Sc. degree from the Shool of Optical Engineering in Changchun University of Science and Technology, China, in 2014. She is currently working toward her M.S degree in optical engineering from Tianjin University, Tianjin, China.
Her research interests mainly focus on distributed fiber sensing. She is Associate Professor Kun Liu’s student.
Junfeng Jiang, received his B.S. degree in 1998 from Southwest Institute of Technology, China. He obtained the M.S. degree and Ph.D. degree from Tianjin University, China, in
2001 and 2004, respectively. He is currently a professor in Tianjin University. His research interests include fiber sensors and optical commu-nication performance measurement.
Tiegen Liu, received the B.Eng., M.Eng. and Ph.D. degree in 1982, 1987 and 1999, respectively, from Tianjin University, China. Now he is a professor in Tianjin University. His research interests involve photoelectric detection and fiber sensing. Prof. Liu is a Chief Scientist of the National Basic Research Program of China under Grant2010CB327802.
Chunyu Ma, biography not available at the time of publication.