warwick.ac.uk/lib-publications
Original citation:
Jeanneret, Raphaël, Pushkin, Dmitri O., Kantsler, Vasily and Polin, Marco. (2016)
Entrainment dominates the interaction of microalgae with micron-sized objects. Nature
Communications, 7 . 12518.
Permanent WRAP URL:
http://wrap.warwick.ac.uk/81148
Copyright and reuse:
The Warwick Research Archive Portal (WRAP) makes this work of researchers of the
University of Warwick available open access under the following conditions.
This article is made available under the Creative Commons Attribution 4.0 International
license (CC BY 4.0) and may be reused according to the conditions of the license. For more
details see:
http://creativecommons.org/licenses/by/4.0/
A note on versions:
The version presented in WRAP is the published version, or, version of record, and may be
cited as it appears here.
Received 2 Jan 2016|Accepted 8 Jul 2016|Published 18 Aug 2016
Entrainment dominates the interaction
of microalgae with micron-sized objects
Raphae
¨l Jeanneret
1, Dmitri O. Pushkin
2, Vasily Kantsler
1& Marco Polin
1The incessant activity of swimming microorganisms has a direct physical effect on surrounding microscopic objects, leading to enhanced diffusion far beyond the level of Brownian motion with possible influences on the spatial distribution of non-motile planktonic species and particulate drifters. Here we study in detail the effect of eukaryotic flagellates, represented by the green microalgaChlamydomonas reinhardtii, on microparticles. Macro- and microscopic experiments reveal that microorganism-colloid interactions are dominated by rare close encounters leading to large displacements through direct entrainment. Simulations and theoretical modelling show that the ensuing particle dynamics can be understood in terms of a simple jump-diffusion process, combining standard diffusion with Poisson-distributed jumps. This heterogeneous dynamics is likely to depend on generic features of the near-field of swimming microorganisms with front-mounted flagella.
DOI: 10.1038/ncomms12518 OPEN
1Physics Department, University of Warwick, Gibbet Hill Road, Coventry CV4 7AL, UK.2Department of Mathematics, University of York, Heslington,
S
wimming microorganisms navigate commonly through fluids characterized by a variety of suspended microparticles, with which they inevitably interact. From malarial parasites meandering around densely packed red blood cells and infecting them1, to protists which regulate primary production in oceans and lakes by grazing on sparsely distributed microalgae and bacteria2,3, these interactions can have important biological and ecological implications. Some, like biogenic mixing, are still intensely debated4–6. Understanding the basic mechanisms of such interactions is timely, as a vast number of plastic micro- and nanoparticles of anthropogenic origin scattered throughout the world’s oceans (up toB105m3) appear to be easily ingested by microorganisms, which then recycle plastics within the marine food web with currently unknown consequences7. From a physics perspective, these systems are particularly appealing. Abstracted as binary suspensions8,9, where an active, self-propelled species interacts with a passive, thermalized one, they represent a naturally occurring category of out-of-equilibrium stochastic systems driven by energy produced directly within the bulk, rather than transmitted through the system’s boundaries. Easily accessible experimentally, and amenable to detailed quantitative modelling10, they are uniquely placed to provide benchmark tests for theories of out-of-equilibrium statistical mechanics11–13. Currently best characterized are the so-called bacterial baths. Wu and Libchaber14, and more recently15–18, showed that colloidal particles within bacterial suspensions perform a persistent random walk leading in bulk to a diffusivity up to B10 the thermal value18. This increase is proportional, at least in the dilute limit, to the product of bacterial speed and concentration, a consequence of random successive single-particle interactions5,19–23. The intrinsic non-equilibrium nature of bacterial baths is also known to lead to other peculiar effects, including motility-induced colloidal pair interactions10 and coupling between enhanced translational and rotational diffusion24.Microparticles’ interactions with the other major class of microorganisms, eukaryotic flagellates, is distinctly less explored. Almost exclusively larger than bacteria (B10–100mm), these species probe a new and biologically relevant physical regime, where the microparticles’ size is significantly smaller than that of the microorganisms (but see also ref. 25 for the effect of bacterial motion on molecular diffusion). Working with the microalga
Chlamydomonas reinhardtii(CR), often studied as model eukaryotic microswimmer, the pioneering study of Leptoset al.26—followed by ref. 27—reported an increase in particle diffusivity of magnitude similar to the bacterial case, as a consequence of loop-like particle trajectories induced by the far-field flow of the algae21,22,28,29. Particle displacements followed a diffusively scaling fat-tailed distribution which, if valid for arbitrary large observation times, would imply a violation of the Central Limit Theorem30. These fat-tailed distributions have indeed been observed in short simulations21,31, but should converge to normal distributions at long times29,31. This prediction, however, has not been tested experimentally.
Here we revisit the behaviour of colloids within a suspension of CR, taken as representative of eukaryotic flagellates, and reveal that their overall dynamics is in fact dominated by rare but dramatic entrainment events. These jumps underpin the surpris-ingly large diffusivity we observe directly in both sedimentation and collective spreading experiments,\40 greater than values
reported previously for the same geometry. The colloids’ behaviour, alternating entrainments and periods of standard enhanced diffusion, is fundamentally different from the persistent random walk common with bacterial suspensions. Through microscopic experiments, simulations and analytical modelling we show instead that this dynamics is well captured by a simple jump-diffusion model.
Results
Experiments. A full description of the experimental procedures can be found in the Methods and Supplementary Methods sec-tions. Briefly, wild-type CR strain CC125 was grown axenically in Tris-acetate-phosphate medium32 at 21°C under continuous fluorescent illumination. Cells were harvested in the exponential phase (B5106cell ml1), concentrated by gentle spinning and then resuspended to reach the desired concentration. Polystyrene microparticles (1mm diameter) were then added to the suspension, and their diffusivity at different CR concentrations (Nc) was measured from three different sets of microfluidic
experiments (Supplementary Methods 1): mapping the particles’ sedimentation profile at steady state; measuring the relaxation dynamics of an inhomogeneous distribution of particles; and by long timescale direct tracking of individual colloids’ dynamics in a thin Hele–Shaw cell. Schematic representations of the experimental setups are shown Supplementary Figs 1 and 2. Except for the sedimentation experiments, the medium was density-matched with the colloids using Percoll33. This increased its viscosity (Zpercoll¼(1.5±0.1)Zwater) as reflected in the slower
average swimming speed, h iv , of the algae. We measured
hviS¼81.8±3.5mm s1, h iv CS¼40.9±3.5mm s1 and
hviHS¼49.1±2.5mm s1 for the sedimentation, spreading and tracking experiments respectively. A colloidal Pe´clet number for tracer/swimmer interactions can be defined asPe¼vL/D0, where vandL(B10mm) are CR’s characteristic speed and body length, and D0 the Brownian diffusivity of the colloids. We obtain PeSC2,000, PeCSC1,500 and PeHSC1,750, respectively for the
three experiments.
Macroscopic diffusion. Macroscopic diffusion experiments coarse-grain over the colloids’ microscopic dynamics and ensure the direct measurement of their effective transport properties, in the spirit of Jean Perrin’s seminal work on sedimentation equi-librium34. We begin by characterizing the colloids’ steady-state sedimentation profile at increasing CR concentrations, always within the dilute regime (volume fractionst0.15%). The average concentrations probed will always be well below the threshold required to induce bioconvective instabilities within our
B200mm-thick sample cells. At the same time the concentration profile is not exactly homogeneous, but slightly decreasing with height, see Supplementary Fig. 3 and Supplementary Note 1. However, as it will be evident from the results, this inhomogeneity did not appear to have appreciable consequences on our measurements. Figure 1a shows that even when the algae are present, the microparticles’ distributions are still in excellent agreement with simple exponential profiles, but crucially with different effective gravitational lengths lg,eff
(Fig. 1b). The exponential profiles are a standard consequence of the balance between the particles’ sedimentation speed vsed,
here due to adr¼50 g l1density mismatch, and their effective diffusivity, combining passive and active processes. Boltzmann-like distributions are indeed what should be expected even in these out-of-equilibrium systems, at least for small enough vsed
(ref. 35), akin to what has been observed for active colloids alone36. The characteristic lengthlg,eff, experimentally observed to
be proportional to the concentration of algae, allows us to measure the concentration-dependent effective diffusivity as
Deff¼vsed lg,eff (Fig. 1c, orange squares, Supplementary Fig. 4
for a close-up at low concentrations). We obtainDeff¼D0þaSNc,
where D0¼0.40±0.01mm2s1 is the thermal diffusivity, the
algal concentration Nc is in units of 106cells ml1, and
aS¼1.71±0.14(mm2s1)/(106cells ml1) (slopes a will be
expressed in these units throughout the paper). Within the same experiments, however, the diffusivity can also be inferred
microscopically from direct short-duration tracking of microparticles’ trajectories in bulk (mean tracks duration
dttracks¼2.6 s), as previously done in ref. 26. These
measurements return a different estimate, Deff¼D0þaTNc
(Fig. 1c, orange circles), with a slope aT¼0.074±0.014 in
reasonable agreement with previous results (aL¼0.041 in ref. 26)
but more than 40-times smaller than the sedimentation valueaS.
The surprisingly large value of aS, larger than any previously
reported bulk value, calls for an independent verification. It was tested here at the macroscopic level by following the diffusive spreading of a uniform band of density-matched colloids within a microfluidic device filled with a uniform concentration of cells (for experimental details see the Methods section, Supplementary Fig. 5 and Supplementary Methods 2). The band’s profile, initially tight around the middle third of a 2-mm-wide, 60-mm-thick channel and running along its full length (B10 mm), spreads with a characteristically diffusive dynamics which enables to measure directly the effective diffusivityDeffat differentNcvalues
(Supplementary Fig. 5 and Supplementary Methods 2). The results are shown in Fig. 1c (green triangles) after being
multiplied by the ratioh iv S=h iv CSof the cells’ swimming speeds to account for their slower motion in the density-matched medium. As before,Deffdepends linearly on cell concentration,
with a slopeaCS¼1.62±0.14 in remarkable agreement with the
sedimentation value.
Microscopic entrainment and diffusion. The quantitative agreement between steady-state and time-dependent macroscopic measurements suggests that our understanding of the micro-scopic interaction between particles and microorganisms, based on the effect of the swimmers’ far-field flows29,37–39and leading to aT(ooaS), is missing a key element. The crucial microscopic
insight is provided by long-time tracking of the particles at a range ofNcvalues. This is achieved here by confining the system
within a 26mm-thick Hele–Shaw cell, which allows us to follow individual colloids for B200 s. Figure 2a and Supplementary Movie 1 show a typical colloidal trajectory in this confined geometry. The dynamics, which leads to a dramatically larger spreading than simple Brownian motion (Fig. 2a inset), results Z (μm)
0 50 100 150
N
(
Z
) /
N0
101
100
10–1
10–2 0
1 2
Nc (106cells per ml)
0 1 2
lg,eff
−
l0
(
μ
m)
0 20 40 60 80 100 120 140 160
Nc (10 6
cells per ml)
0 5 10
〈υ〉
s
〈υ〉
j
(
Deff
−
D0
) (
μ
m
2.s
−1
)
0 2 4 6 8 10 12 14 16
a b c
S = 1.71 ± 0.14
CS = 1.62 ± 0.14
T = 0.074 ± 0.014
L = 0.041
[image:4.595.87.514.52.185.2]HS = 1.67 ± 0.13
Figure 1 | Effect of swimming algae on particle diffusivity.(a) Semi-log plot of the normalized density profiles of 1mm-PS colloids along the gravity direction
for different cell concentrations. Full lines are best exponential fits to the data. Curves have been shifted apart along theyaxis for clarity. Colour bar: CR
concentrationNcin units of 106cells ml1. Error bars represent the s.d. (b) Gravitational lengthlg,effl0as a function ofNcextracted from the fits ina. The solid orange line is the best linear fit to the data,lg,effl0¼((62.8±5)Nc)mm (Ncin units of 106cells ml1). Vertical error bars represent the uncertainty on the fits in a. Horizontal error bars are the standard deviations of cell concentrations. (c) Effective microparticle diffusivity (DeffD0) as a function ofNcfor the three experiments. Diffusivities are rescaled by the ratio of the average CR speedsh ivS=h ivj, wherejstands for sedimentation (S), spreading (CS) or tracking (HS) experiments. Solid lines are best linear fits to the data. Orange squares: sedimentation experiment (slopeaS¼1.71±0.14(mm2s1)/(106cells ml1); all other
values in the same units); green triangles: spreading experiment (aCS¼1.62±0.14); blue circles: Hele–Shaw experiment (aHS¼1.67±0.13). Orange circles and
dashed line: direct tracking in the sedimentation experiment (aT¼0.074±0.014). Black dashed line: fit to the experimental diffusivity obtained by direct tracking in ref. 26 (aL¼0.041). See Supplementary Fig. 5 for a close-up on the low-concentration values. Vertical error bars represent the uncertainty on the fits to obtain the effective diffusivities. Horizontal error bars are the s.d. of the cell concentrations.
X (μm)
–20 0 20 40
Y
(
μ
m)
–40 –30 –20 –10 0 10 20 30 40
0.1 1 10 100
[image:4.595.126.471.324.461.2]a b
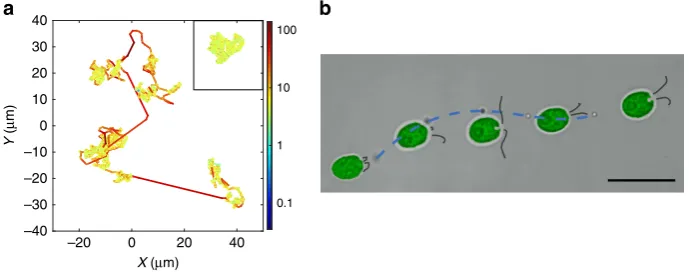
Figure 2 | Microparticle behaviour within the active suspension.(a) Typical microparticle trajectory (B210 s) in the Hele–Shaw experiment at
Nc¼4.84±0.13106cells ml1. Colour represents instantaneous speed (colour bar unit:mm s1). The trajectory shows three types of dynamics:
Brownian motion and loop-like perturbations (yellow-green blobs) followed by rare and large jumps (red lines). Inset: representative trajectory of a purely
Brownian particle in the same setup, lastingB210 s. (b) A representative entrainment event: as the cell swims from the left to the right of the panel, it
from the combination of three different effects of well-separated magnitudes. The weakest component is standard Brownian motion, which dominates the dynamics when the algae are more than B25mm (ref. 26) away from the colloid. At closer separation, but before close contact, the far-field flows of the microorganisms induce loop-like trajectories21,22,31,39,40. Originally reported in ref. 26, these loops provide the concentration-dependent contribution to the particles’ diffusivity previously estimated as aTNc (ref. 26). Finally,
particles within the near field can be occasionally entrained by the algae over distances up to tens of microns (see Fig. 2b), giving rise to the sudden jumps in the trajectory highlighted as red solid lines in Fig. 2a. These jumps, a fundamental feature of the dynamics never observed previously, are the microscopic origin of the term aSNc, the unexpectedly large contribution to the
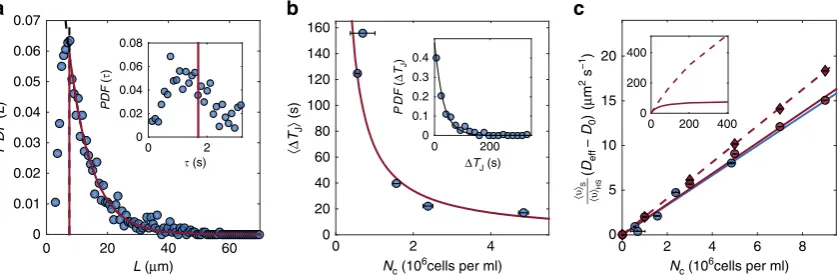
particle diffusivity observed in the macroscopic experiments. This is confirmed directly on Supplementary Movie 2, where we show such an entrainment event taking place during a sedimentation experiment. For our 1mm-diameter tracers, the jump lengthLis (mostly) exponentially distributed with a characteristic length
LJ¼7.5±0.5mm, above a threshold value LT¼7.5±0.5mm
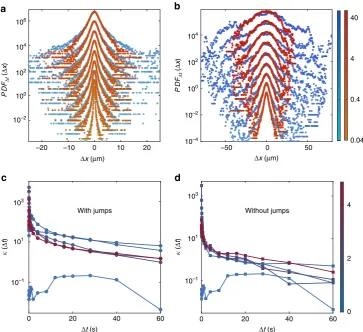
(Fig. 3a) (see Supplementary Methods 3 and Supplementary Fig. 6 for details on the extraction of the jumps from the trajectories). The average displacement is h i ¼L 12.6±0.5mm, although we did record values ofLup toB70mm. The effect of jumps is also clear in the full probability distribution functions of tracer displacements, Fig. 4a,b, which display exponential-like tails much larger than those characteristic of loop-like perturbations only26. Both distributions eventually converge to Gaussians -with different variances- as the observation time increases, a consequence of the Central Limit Theorem already predicted in refs 29,31, see Fig. 4 and Supplementary Note 2.
Jumps are fast (Fig. 3a, inset), lasting on average t¼1.5 s (t¼1.7 s if considering only jumps withLZLT) but they are rare:
as shown in Fig. 2b and Supplementary Movie 3, the algae need to meet a microparticle almost head on in order to entrain it (B65% of all jumps have initial impact parameter r2mm). As a consequence, even at the highest cell concentration probed,
NCC5106 cells ml1, the average time between two
con-secutive jumps is rather long, hDTJi\16 s. Because hDTJi is
dictated by the cell–microparticle encounter rate, for a purely random process one would expect hDTJi /1=Nc: Fig. 3b shows
that this hypothesis is clearly supported experimentally. Further support comes from the analysis of individual inter-jump intervals, which appear to be exponentially distributed as predicted for a simple Poisson process (Fig. 3b inset, see Supplementary Methods 4 for details on the computation of
DTJ
h i).
Computing the mean-square displacement from these long colloidal trajectories offers a microscopic estimate of the effective particle diffusivityDeff, Supplementary Fig. 7 and Supplementary
Note 3. The results are shown in Fig. 1c (blue circles) after multiplication by the swimming speeds ratio h iv S=h iv HS to account for the trivial dependence of the encounter frequency on microalgal speed:Deffis linear with cell concentration, with a
slope aHS¼1.67±0.13 in excellent quantitative agreement with
both macroscopic values. This agreement confirms that the properties of the colloids’ microscopic dynamics, which includes important but rare jumps, have indeed been probed appropriately.
Numerical simulations. The agreement between the macroscopic and microscopic diffusivity measurements highlights the impor-tance of entrainment events, and suggests a combination of jumps and (far-field-enhanced) diffusion as a plausible minimal model of microparticles’ dynamics, at least over the medium-to-long timescales we are interested in. Consequently, we model the two-dimensional projection of the stochastic trajectory of a colloid in the Hele–Shaw experiments, (X(t),Y(t)), as
dX tð Þ ¼ ffiffiffiffiffiffiffiffiffiffiffi2DWJ
p
dWXð Þ þt Lcosð Þy dP tð Þ
dY tð Þ ¼ ffiffiffiffiffiffiffiffiffiffiffi2DWJ
p
dWYð Þ þt Lsinð Þy dP tð Þ
ð1Þ
This combines standard Wiener processes dWX,Y(t) leading to
diffusion with diffusivity DWJ, with a Poisson process for the
jumps, dP(t), characterized by the average time intervalhDTJ(Nc)i
between jumps (Fig. 3b, solid red line). Far-field effects are included at a coarse-grained level by choosingDWJ¼D0þaWJNc,
where aWJ¼0.33±0.05. This is the effective diffusivity,
rescaled byh iv S=h iv HS, which is measured from the microscopic L (μm)
0 20 40 60
PD F ( L ) 0 0.01 0.02 0.03 0.04 0.05 0.06 0.07
Nc (106cells per ml) Nc (106cells per ml)
0 2 4
〈Δ TJ 〉 (s) 0 20 40 60 80 100 120 140 160
0 2 4 6 8
〈υ〉 S 〈υ〉 HS ( Deff − D0 )( μ m
2 s
−1 ) 0 5 10 15 20
ΔTJ (s)
0 200 PD F ( Δ TJ ) 0 0.1 0.2 0.3 0.4
0 200 400
0 200 400
a b c
[image:5.595.90.510.52.190.2](s) 0 2 PDF ( ) 0 0.02 0.04 0.06 0.08
Figure 3 | Microscopic characterization of particle dynamics.(a) Probability distribution function (PDF) of the end-to-end lengthLof the jumps. Above
LT¼7.5mm, the distribution is well fitted by an exponential function with characteristic lengthLJ¼7.5mm (solid red line). Inset: PDF of the durationtof the jumps. The average ist¼1.7 s when considering only jumps of lengthLZLT(solid red line). (b) Mean time interval between consecutive jumps,hDTJi, as a function ofNc. The red solid line is the hyperbolic fit used in the simulations,hDTJi ¼((68.2±8)/Nc)s (Ncin units of 106cells ml1). Horizontal error bars are the standard deviations of cell concentrations. Inset: PDF of the time intervalDTJbetween consecutive jumps atNc¼(1.56±0.10)106cells ml1. Black solid line: exponential
fit with characteristic time (31.9±4)s. Note that these distributions provide a biased measure of the mean waiting timehDTJi, which should be estimated instead
from the average number of jump events as discussed in Supplementary Methods 4. (c) Effective diffusivities,DeffD0, from the Hele–Shaw experiment (blue
circles) and from the simulations: red circles/solid red line fort¼1.7 s (slope 1.03aHS); red diamonds/dashed red line fort¼0.1 s (slope 1.22aHS). Vertical error bars represent the uncertainty on the fits to obtain the effective diffusivities. Horizontal error bars are the standard deviations of the cell concentrations. Inset:
continuation of the simulatedDeffD0curves to very high cell concentrations shows saturation to at-dependent value.
experimental tracks when the entrainment events have been removed. Notice that aWJ4aT due to our conservative choice
for what constitutes a jump, which in the simulation we draw from an exponential fit to the part of the experimental distribution strictly aboveLT(Fig. 3a, solid red line). As a result,
the compounded effect of shorter jumps is included within the coefficientaWJ. The jumps’ orientationyis uniformly distributed
to give an isotropic process, and their duration t¼1.7 s is constant.
This dynamics, simulated with a simple acceptance-rejection method (see Methods section), produces trajectories very similar to the experimental, Supplementary Fig. 8 and Supplementary Note 4. The motion is characterized by an effective diffusivity in excellent agreement with the values from the microscopic experiments (see Fig. 3c, red and blue circles respectively), and
\5 larger thanDWJat the corresponding cell concentration.
The simulations, then, highlight the striking influence that jumps have on particle dynamics, despite their rarity. At the same time, they allow us to explore easily parameter values that have not yet been probed experimentally. For example, Fig. 3c (red diamonds and dashed red line) shows that within the experimental range of cell concentrations, even a drastic reduction of the entrainment durationtto 0.1 s has only a minimal effect on particle diffusivity. The exact value oft, however, will have a major influence as soon ashDTJðNcÞi t, leading to a plateau in the effective diffusivity as
the cell concentration grows above a threshold Ncð Þ /t 1=t
(Fig. 3c inset), at least as long as collective effects do not modify our single-particle picture.
Analytical theory. The experimental and simulation results can be tied together further through a simple continuum theory for the dynamics of microparticles, which rationalizes the dependence of the effective diffusivity Deff(Nc) on the
concentration of algae. Here we extend to two dimensions the one-dimensional approach developed in ref. 41. Briefly, we consider two populations whose densities at position (x, y) and time t are rd(x, y, t) and rb(x, y, t, f), corresponding
respectively to particles diffusing with diffusivity DWJ, and to
particles moving ballistically with a constant velocity u in the direction f. Particles switch from diffusion to directed motion and vice versa with constant transition rates ld(¼1/hDTJi)
andlb(¼1/t) respectively. The system then obeys the following
set of equations:
@rd
@t ¼DWJDrdldrdþlb
Z 2p
0
rbdf
@rb
@t ¼ ucosð Þf @rb
@x usinð Þf @rb
@y þ
ld
2prdlbrb
ð2Þ
which can be easily solved by Fourier–Laplace transform, Supplementary Note 5, yielding the time evolution of the particles’ mean-square displacement and hence their diffusivity.
Δt (s) Δt (s)
0 20 40 60 0 20 40 60
(
Δ
t
)
(
Δ
t
)
10–1 101 103
10–1 101 103
0 2 4
Δx (μm) Δx (μm)
–20 –10 0 10 20
PD
FΔ
t
(
Δ
x
)
PD
FΔ
t
(
Δ
x
)
104
102
100
10–2 106
–50 0 50
10–4 10–2 100 104
102
0.04 0.4 4 40
a b
c d
[image:6.595.115.479.50.382.2]With jumps Without jumps
Figure 4 | Probability distribution functions of particle displacements in the Hele–Shaw experiments.(a,b) Evolution of the PDF of displacements
PDFDt(Dx) of the colloids with the time intervalDtwhen considering the jumps (blue curves) or not (red curves) forNc¼(4.84±0.13)106cells ml1.
The curves have been shifted and separated into two figures for clarity.acorresponds toDtA[0.04, 0.8]s, whilebcorresponds toDtA[1.2, 48]s (colour
bars:Dtin seconds). Both distributions exhibit exponential-like tails at short time which reflect the presence of loop-like perturbations and jumps in the
dynamics. (c,d) Modified kurtosiskof the PDF of displacements as a function of the time intervalDtwith/without jumps respectively. The colours code for
At long timescales this is given by
Deff ¼ lDdWJþllbbþ
ldu2
2lbðldþlbÞ
¼ D0þaWJNcþh iL
2 2 gvNc
1þh iLugvNc ;
ð3Þ
where we wroteDWJ¼D0þaWJNc,lb¼u/hLi andld¼gvNcas
the frequency of entrainment events is proportional to the pro-duct of the speedvand concentrationNcof microorganisms, also
called ‘active flux’16. The quantitygcan be interpreted as a cross-section for entrainment: as an alga swims past, the tracer will be entrained -with a given probability- if it is contained within a region of areagaround the line of motion of the alga19,21. For our Hele–Shaw experiments, using v¼h iv HS and the experimental values of hDTJi (Fig. 3b) we obtain g¼299±35 mm2 (respectively g¼299±35mm2 if Nc is expressed in units of
cells ml1 rather than 106cells ml1). At low concentrations, whereldoolb(or equallyhDTJi t),Deffbecomes
Deff¼D0þaWJNcþ L
h i2
2 gvNc; ð4Þ
which is independent of the jumps’ durationt, here equivalent to independence onu, as suggested by the simulations. Equation (4) recovers the clear division between thermal, far-field and entrainment contributions to the diffusivity that we previously discussed in the context of microscopic experiments. Notice that the contribution from the jumps, by far the most important in our experiments, is simply what should be expected if we interpreted the colloidal trajectory as a freely jointed chain where bonds with exponentially distributed length of mean hLi are added at a rateld¼gvNc.
The coefficient aWJ, representing far-field effects, is
propor-tional to the speedvof the microalgae21,26,29, leading to an overall contribution (DeffD0) which scales with the active fluxvNc, as
originally predicted in ref. 19. Figure 1c shows indeed that the diffusivity curves from different experiments collapse when rescaled by the corresponding velocities. In turn, then, the distribution of jump lengths should be independent of the average velocity of the microorganisms, as expected at low Reynolds numbers. Within the model, however, this proportionality is limited to sufficiently low cell concentrations. AsNcincreases and hDTJibecomes closer tot, nonlinearities become important, and eventually Deff plateaus to a t-dependent value as seen in the
simulations (Fig. 3c, inset) and well captured by the present model, Supplementary Fig. 9 and Supplementary Note 5.
Finally, the short timescale limit of the particles’ mean-square displacement returns Deff¼xdDWJ, where xd is the fraction of
particles that are in the diffusing state. Estimating
xd ’ hDTJi=ðhDTJi þtÞ, we can assumexdC1 within the whole
range of cell concentrations probed experimentally. Short time-scale tracking of microparticles, then, will inevitably return
DeffCDWJrather than the full expression in equation (4). This is
the reason for the small diffusivity reported in ref. 26, which we also observe from direct short-duration tracking of microparticles in the sedimentation experiments.
Discussion
Proposed theoretically either as a consequence of microparticle capture within ‘wake bubbles’21or as a consequence of Darwin drift28, particle entrainment by microorganisms was expected to provide at best a contribution similar to that observed for to far-field loops42and most likely much smaller22. At the same time, lack of experimental evidence for entrainment questioned not just its importance for particle–microswimmer interactions, but its existence as well.
Here we show experimentally not only that entrainment of microparticles by microorganisms exists but also that these rare but large events can dominate particle dynamics, leading in the present case to a diffusivity more than 40 larger than previously reported. Simulation and analytical results support a jump-diffusion process as a good minimal model for the medium-to-long timescales dynamics of the colloids. The simplified continuum model we discuss provides a theoretical support for the observed dependence of the experimental diffusivities on the active fluxvNc,
already introduced in the bacterial context16,17,43. At the same time, it clarifies that long-duration particle tracking is necessary to sample correctly the microscopic dynamics and recover the real long timescale impact of microorganisms.
Although we cannot yet pinpoint the specific mechanism leading to entrainment, the structure of the near-field flow is likely to play a crucial role. The entrainment we observe requires almost head-on collisions, which is likely to be facilitated by the type of stagnation point found (on average) in front of the cell37,38. After reaching the cell apex, the entrained particles slide down the sides of the cell body along a high-shear region almost co-moving with the microorganism, and are eventually left behind having spent slightly more than half of the jump in the front part of the cell (54±9%). The no-slip boundary on the bodies of microorganisms,
and the stagnation points in their flow fields, have in fact been argued to play a major role in large microparticle displacements5,21,29, which are seen here to dominate the effective diffusivity. Our results support these conjectures.
Eukaryotic microswimmers with multiple front-mounted flagella will share much of the near-field flow structure found in
Chlamydomonas: entrainment is then likely to be a generic feature of this whole class of microorganisms. Several of these species are predators2,3, and prey on cells of size similar to our plastic particles. Front-mounted flagella, then, would spontaneously lead to contact with the prey at a predictable location on the cell body within easy reach of the flagella, and therefore facilitate the ingestion of both natural preys and environmental microplastics.
Methods
Cell culture.Cultures of CR strain CC125 were grown axenically in a
Tris-Acetate-Phosphate medium32at 21°C under continuous fluorescent illumination (100mE m2s1, OSRAM Fluora). Cells were harvested at
B5106cells ml1in the exponentially growing phase, then centrifuged
at 800 r.p.m. for 10 min and the supernatants replaced by DI-water (sedimentation experiment) or by a Percoll solution (tracking and spreading experiments; Percoll Plus, Sigma) already containing the desired concentration of PS colloids (Polybead Microspheres, diameterd¼1±0.02mm).
Microfluidics and microscopy.The Percoll solution (38.5% vol/vol) was made to
density-match the beads for the Hele–Shaw and spreading experiments, while preserving the Newtonian nature of the flows33. The appropriate solution was
injected into either 185mm (sedimentation experiment) or 26mm (tracking experiment) thick Polydimethylsiloxane-based microfluidic channels previously passivated with 0.15%w/w BSA solution in water. The microfluidic devices were then sealed using photocurable glue (Norland NOA-68) to prevent evaporation. Regarding the spreading experiment, the band of colloids was initiated in a three-arms fork-shape channel (60mm thick) by injecting at the same flow-rate (using a PHD 2,000 Harvard Apparatus syringe pump and high-precision Hamilton 50 and 100ml gas-tight syringes) the CRþbeads Percoll solution in the central arm and the CR Percoll solution only in the two sided arms. Colloids were observed under either bright-field (sedimentation experiment) or phase contrast (tracking and spreading experiments) illumination on a Nikon TE2000-U inverted microscope. A long-pass filter (cutoff wavelength 765 nm) was added to the optical path to prevent phototactic response of the cells. Stacks of 200 images at 60magnification were acquired at 10 f.p.s. (camera Pike F-100B, AVT) layer by layer by manually moving the plane of focus in order to reconstruct the density profiles for the sedimentation experiment. We used a40 oil immersion objective (Nikon CFI S Fluor40 oil) combined with an extra 1.5 optovar magnification. The condenser iris was completely opened to minimize the depth of field. Regarding the Hele–Shaw experiment, several movies of 2104images were recorded at 25 f.p.s. (camera
Pike F-100B, AVT) using a 20 phase contrast objective (Nikon LWD ADL 20F). Particles trajectories were then digitized using a standard Matlab particle
tracking algorithm (The code can be downloaded at http://people.umass.edu/ kilfoil/downloads.html). Finally the spreading dynamics of the band of colloids was probed by recording the system for a few hours at10 magnification (Nikon ADL 10I) and low frame rate (0.5 f.p.s.) using a Nikon D5000 DSLR camera. The colloids were then featured using the same Matlab particle tracking algorithm in order to reconstruct the density profiles. In all experiments, the concentration of algae was determinedin situby imaging the system under dark-field illumination at low magnification (objective Nikon CFI Plan Achromat UW 2).
Numerical Simulations.The parameters of the simulation correspond to the red
lines in Fig. 3a,b. For each algae concentration, 1,000 trajectories of 2,000 s have been simulated using a time-stepdt¼0.004 s, which is 10 times smaller than the acquisition period in the Hele–Shaw experiment. At each time step a random walk with diffusivity
DWJis performed. To simulate the Poisson process, we draw at each time step a
random number in the open interval ]0;1[. If this number is within the centred closed interval [(1dt/hDTJi)/2;(1þdt/hDTJi)/2], then we perform a jump that lastst¼1.7 s
(or 0.1 s) with a length taken out of the distributionPDF(L), along the direction corresponding toy, which is uniformly distributed in [p,p[. This technique allows to simulate accurately the Poisson process44. We stress that within the simulation, once the particle has entered a jump, it will escape it after exactlyt¼1.7 s (or 0.1 s). This is done in order to approximate the experiments, which show that the distribution function of jumps’ duration is tighter around the mean than that of jumps’ lengths. Notice that during the jumps the random walk component is switched off. After the jump has been performed, a new random number is picked in order to choose between a random step or a jump and continue the jump-diffusion process.
Data availability.The authors declare that the data supporting the findings of this
study are available on request.
References
1. Heddergott, N.et al.Trypanosome motion represents an adaptation to the crowded environment of the verterbrate bloodstream.PLoS Pathog.8,e1003023 (2012). 2. Montagnes, D. J. S.et al.Selective feeding behaviour of key free-living protists:
avenues for continued study.Aquat. Microb. Ecol.53,83–98 (2008). 3. Wetherbee, R. & Andersen, R. Flagella of a chrysophycean alga play an active
role in prey capture and selection. Direct observations onEpiphysis pulchra
using image enhanced video microscopy.Protoplasma166,1–7 (1992). 4. Visser, A. W. Biomixing of the oceans?Science316,838–839 (2007). 5. Thiffeault, J.-L. & Childress, S. Stirring by swimming bodies.Phys. Lett. A374,
3487–3490 (2010).
6. Katija, K. Biogenic inputs to ocean mixing.J. Exp. Biol.215,1040–1049 (2012). 7. Wright, S. L., Thompson, R. C. & Galloway, T. S. The physical impact of
microplastics on marine organisms: a review.Env. Pol.178,483–492 (2013). 8. Mallory, S. A., Valeriani, C. & Cacciuto, A. Induced activation of a passive
tracer in an active bath.Phys. Rev. E90,032309 (2014).
9. Ku¨mmel, F., Shabestari, P., Lozano, C., Volpe, G. & Bechinger, C. Formation, compression and surface melting of colloidal clusters by active particles.Soft Matter11,6187 (2015).
10. Angelani, L., Maggi, C., Bernardini, M. L., Rizzo, A. & di Leonardo, R. Effective interactions between colloidal particles suspended in a bath of swimming cells.
Phys. Rev. Lett.107,138302 (2011).
11. Maggi, C.et al.Generalized energy equipartition in harmonic oscillators driven by active baths.Phys. Rev. Lett.113,238303 (2014).
12. Koumakis, N., Maggi, C. & di Leonardo, R. Directed transport of active particles over asymmetric energy barriers.Soft Matter10,5695 (2014). 13. Takatori, S. C. & Brady, J. F. A theory for the phase behavior of mixtures of
active particles.Soft Matter11,7920–7931 (2015).
14. Wu, X.-L. & Libchaber, A. Particle diffusion in a quasi-two-dimensional bacterial bath.Phys. Rev. Lett.84,13 (2000).
15. Valeriani, C., Li, M., Novosel, J., Arlt, J. & Marenduzzo, D. Colloids in a bacterial bath: simulations and experiments.Soft Matter7,5228 (2011). 16. Min˜o, G. L.et al.Enhanced diffusion due to active swimmers at a solid surface.
Phys. Rev. Lett.106,048102 (2011).
17. Jepson, A., Martinez, V. A., Schwarz-Linek, J., Morozov, A. & Poon, W. C. K. Enhanced diffusion of non swimmers in a three-dimensional bath of motile bacteria.Phys. Rev. E88,041002 (R) (2013).
18. Patteson, A. E., Gopinath, A., Purohit, P. K. & Arratia, P. E. Particle diffusion in active fluids is non-monotonic in size.Soft Matter12,2365–2372 (2016). 19. Underhill, P. T., Hernandez-Ortiz, J. P. & Graham, M. D. Diffusion and spatial
correlations in suspensions of swimming particles.Phys. Rev. Lett.100,248101 (2008).
20. Ishikawa, T., Locsei, J. T. & Pedley, T. J. Fluid particle diffusion in a semidilute suspension of model micro-organisms.Phys. Rev. E82,021408 (2010). 21. Lin, Z., Thiffeault, J.-L. & Childress, S. Stirring by squirmers.J. Fluid Mech.669,
167–177 (2011).
22. Morozov, A. & Marenduzzo, D. Enhanced diffusion of tracer particles in dilute bacterial suspensions.Soft Matter10,2748–2758 (2014).
23. Kasyap, T. V., Koch, D. L. & Wu, M. Hydrodynamic tracer diffusion in suspensions of swimming bacteria.Phys. Fluids26,081901 (2014). 24. Peng, Y.et al.Diffusion of ellipsoids in bacterial suspensions.Phys. Rev. Lett.
116,068303 (2016).
25. Kim, M. & Breuer, K. Enhanced diffusion due to motile bacteria.Phys. Fluids 16,L78–L81 (2004).
26. Leptos, K. C., Guasto, J. S., Gollub, J. P., Pesci, A. I. & Goldstein, R. E. Dynamics of enhanced tracer diffusion in suspensions of swimming eukaryotic microorganisms.Phys. Rev. Lett.103,198103 (2009).
27. Kurtuldu, H., Guasto, J. S., Johnson, K. A. & Gollub, J. P. Enhancement of biomixing by swimming algal cells in two-dimensional films.Proc. Natl Acad. Sci. USA108,10391–10395 (2011).
28. Pushkin, D. O. & Yeomans, J. M. Fluid mixing by curved trajectories of microswimmers.Phys. Rev. Lett.111,188101 (2013).
29. Thiffeault, J.-L. Distribution of particle displacements due to swimming microorganisms.Phys. Rev. E92,023023 (2015).
30. Zaid, I. M., Dunkel, J. & Yeomans, J. M. Le´vy fluctuations and mixing in dilute suspensions of algae and bacteria.J. R. Soc. Interface8,1314–1331 (2011). 31. Pushkin, D. O. & Yeomans, J. M. Stirring by swimmers in confined
microenvironments.J. Stat. Mech.4,P04030 (2014).
32. Rochaix, J. D., Mayfield, S., Goldschmidt-Clermont, M. & Erickson, J. M. inPlant Molecular Biology: A Practical Approach. (ed. Schaw, C. H.) 253–275 (IRL Press, 1988).
33. Gachelin, J.et al.Non-Newtonian viscosity ofEscherichia colisuspensions.
Phys. Rev. Lett.110,268103 (2013).
34. Perrin, J. Molecular reality.Ann. Chim. Phys.8,1 (1909).
35. Tailleur, J. & Cates, M. E. Sedimentation, trapping, and rectification of dilute bacteria.Eur. Phys. Lett.86,60002 (2009).
36. Palacci, J., Cottin-Bizonne, C., Ybert, C. & Bocquet, L. Sedimentation and effective temperature of active colloidal suspensions.Phys. Rev. Lett.105,
088304 (2010).
37. Drescher, K., Goldstein, R. E., Michel, N., Polin, M. & Tuval, I. Direct measurement of the flow field around swimming microorganisms.Phys. Rev. Lett.105,168101 (2010).
38. Guasto, J. S., Johnson, K. A. & Gollub, J. P. Oscillatory flows induced by microorganisms swimming in two dimensions.Phys. Rev. Lett.105,168102 (2010). 39. Dunkel, J., Putz, V. B., Zaid, I. M. & Yeomans, J. M. Swimmer-tracer scattering
at low Reynolds number.Soft Matter6,4268–4276 (2010).
40. Mathjissen, A. J. T. M., Pushkin, D. O. & Yeomans, J. M. Tracer trajectories and displacement due to a micro-swimmer near a surface.J. Fluid Mech.773,
498–519 (2015).
41. Me´ndez, V., Campos, D. & Bartumeus, F.Stochastic Foundations in Movement EcologyCh. 3.3 (Springer Complexity, 2014).
42. Pushkin, D. O., Shum, H. & Yeomans, J. M. Fluid transport by individual microswimmers.J. Fluid Mech.726,5–25 (2013).
43. Min˜o, G. L., Dunstan, J., Rousselet, A., CleZˇment, E. & Soto, R. Induced diffusion of tracers in a bacterial suspension: theory and experiments.J. Fluid Mech.729,423–444 (2013).
44. Hanson, F. B.Applied Stochastic Processes and Control for Jump-Diffusions: Modeling, Analysis, and ComputationCh. 1 (SIAM, 2007).
Author contributions
R.J., D.O.P., V.K., M.P. designed the study; R.J. performed the experiments, analytical and numerical modelling; R.J. and M.P. analysed the results; R.J., V.K., M.P. wrote the manuscript.
Additional information
Supplementary Informationaccompanies this paper at http://www.nature.com/ naturecommunications
Competing financial interests:The authors declare no competing financial interests.
Reprints and permissioninformation is available online at http://npg.nature.com/ reprintsandpermissions/
How to cite this article:Jeanneret, R.et al.Entrainment dominates the interaction of microalgae with micron-sized objects.Nat. Commun.7:12518 doi: 10.1038/ncomms12518 (2016).
This work is licensed under a Creative Commons Attribution 4.0 International License. The images or other third party material in this article are included in the article’s Creative Commons license, unless indicated otherwise in the credit line; if the material is not included under the Creative Commons license, users will need to obtain permission from the license holder to reproduce the material. To view a copy of this license, visit http://creativecommons.org/licenses/by/4.0/