http://go.warwick.ac.uk/lib-publications
Original citation:
D. I. Woodward, M. R. Lees & P. A. Thomas (2012). “Structural phase transitions in the Ag2Nb4O11 – Na2Nb4O11 solid solution”. J. Solid State Chem. 192, 385-389.
Permanent WRAP url:
http://wrap.warwick.ac.uk/50169
Copyright and reuse:
The Warwick Research Archive Portal (WRAP) makes the work of researchers of the University of Warwick available open access under the following conditions. Copyright © and all moral rights to the version of the paper presented here belong to the individual author(s) and/or other copyright owners. To the extent reasonable and practicable the material made available in WRAP has been checked for eligibility before being made available.
Copies of full items can be used for personal research or study, educational, or not-for-profit purposes without prior permission or charge. Provided that the authors, title and full bibliographic details are credited, a hyperlink and/or URL is given for the original metadata page and the content is not changed in any way.
Publisher’s statement:
“NOTICE: this is the author’s version of a work that was accepted for publication in Journal of Solid State Chemistry. Changes resulting from the publishing process, such as peer review, editing, corrections, structural formatting, and other quality control mechanisms may not be reflected in this document. Changes may have been made to this work since it was submitted for publication. A definitive version was subsequently published in Journal of Solid State Chemistry, [VOL: 192, August 2012] DOI:
10.1016/j.jssc.2012.04.014”
A note on versions:
The version presented here may differ from the published version or, version of record, if you wish to cite this item you are advised to consult the publisher’s version. Please see the ‘permanent WRAP url’ above for details on accessing the published version and note that access may require a subscription.
1
Structural phase transitions in the Ag2Nb4O11 – Na2Nb4O11 solid solution
David I. Woodward,a* Martin R. Leesa and Pam A. Thomasa
a
Department of Physics, University of Warwick, Gibbet Hill Road, Coventry, CV4 7AL, UK.
*[email protected] Telephone: + 44 (0)24 7615 1782 Fax: +44 (0)24 7615 0897
Abstract
The phase transitions between various structural modifications of the natrotantite-structured system xAg2Nb4O11 – (1-x)Na2Nb4O11 have been investigated and a phase diagram constructed as a function of temperature and composition. This shows three separate phase transition types: (1) paraelectric – ferroelectric, (2) rhombohedral – monoclinic and (3) a phase transition within the ferroelectric rhombohedral zone between space groups R3c and R3. The parent structure for the entire series has space group R3c. Compositions with x > 0.75 are rhombohedral at all temperatures whereas compositions with x < 0.75 are all monoclinic at room temperature and below. At x = 0.75,
rhombohedral and monoclinic phases coexist with the phase boundary below room temperature being virtually temperature-independent. The ferroelectric phase boundary extends into the monoclinic phase field. No evidence was found for the R3–R3c phase boundary extending into the monoclinic phase field and it is concluded that a triple point is formed.
1. Introduction
Ferroelectricity occurs in many different oxide groups. Of these, perovskites are by far the most widely studied, due in part to their simple prototype structure, the wide range of compounds that can be formed and their existing markets for applications. Ferroelectricity also exists in other oxide groups, such as tungsten bronzes [1], pyrochlores [2,3] and bismuth-layered structures including Aurivillius phases [4]. These structures are all based on corner-sharing octahedra that are able to undergo distortions that can lead to the development of a switchable polarisation. However, some recent work has revealed that ferroelectricity exists in the material Ag2Nb4O11 [5,6], one of a number of materials with structures related to the minerals natrotantite (Na2Ta4O11) [7,8] and calciotantite (CaTa4O11) [9]. These materials are not based solely on corner-sharing octahedra, but are comprised of alternating layers of distorted edge-sharing TaO7 or NbO7 polyhedra which are corner-connected to layers containing regular TaO6 or NbO6 octahedra. The larger, lower valancy cations are incorporated into the layers with the regular octahedra and, in addition to Ag+, Na+ and Ca2+, the cations Cu+ [10,11], Sr2+ [12], and La3+ [13] are compatible with this structure, although the presence of La3+ requires charge-balancing by replacing some Ta5+ with Zr4+. The majority of known phases with the natrotantite structure are formed with Ta5+.
At present, only Ag2Nb4O11 from this group of materials is known to be ferroelectric. It is rhombohedral at room temperature with space group R3c. Its Curie temperature, TC, is ~ 150 °C,
where it goes through a phase transition to a paraelectric structure with space group R3c. At ~ -75 °C, there is another phase transition to a structure with space group R3 [5]. Evidence for the
2
replacement of Ag+ by Na+ causes a reduction in TC and that at a composition of x = 0.75, there is a
phase boundary between monoclinic and rhombohedral structures [6].
In the xAg2Nb4O11 – (1-x)Na2Nb4O11 solid solution, there are therefore four known structural variants that exist as a function of temperature and composition, but their corresponding phase fields are unknown. In this work, the temperatures and compositions of the phase boundaries have been
determined with the primary intention of producing a phase diagram for the solid solution to elucidate the sequences of phase transitions that can take place.
2. Materials and methods
Powders in the xAg2Nb4O11 – (1-x)Na2Nb4O11 solid solution were made by a standard solid-state processing route. Ag2O (99+ %, Alfa Aesar), Nb2O5 (Puratronic, 99.9985 %) and Na2CO3 (BDH, 99 %) were weighed out in stoichiometric amounts into batches of ~ 50 g. These were ball-milled for ~ 24 h in a high-density polythene pot with propan-2-ol and 10 mm diameter milling media. The slurry was dried at 70 °C and the resultant powder ground with a pestle and mortar and passed through a 250
m mesh sieve. The mixed powders were reacted in a lidded Al2O3 crucible and heated at a ramp rate of 5 °C/min to 800 °C for 2 h, with the exception of compositions x = 0 and 0.25 which were heated to 775 °C. After reacting, the crucible remained in the furnace which was left to cool with no power applied. Phase purity was assessed by powder X-ray diffraction (XRD). Only Ag2Nb4O11 was found to be phase pure by XRD. All other compositions were found to contain weak peaks corresponding to the phase Na13Nb35O94 [17].
XRD was performed using a Panalytical X’Pert Pro MPD with a curved Johansson monochromator producing Cu K1 radiation. An Anton Paar HTK1200N furnace was used to heat the samples above room temperature at a rate of 0.5 °C/min. Pawley refinements were performed on these data using Topas Academic 4.1 to produce lattice parameters [18]. Low-temperature XRD was performed on a Bruker D5005 diffractometer, equipped with an Oxford Cryosystems Phenix low-temperature stage which cooled the samples at a rate of 0.5 °C/min.
Differential scanning calorimetry (DSC) was performed using a Mettler Toledo DSC1 STARe system. Samples were weighed into Al pans, cooled to -150 °C, heated to 200 °C at a rate of 5 °C/min and cooled back down to -150 °C at the same rate.
Degradation of the natrotantite structure at elevated temperatures prevents the formation of dense ceramics, so where solid samples were required to be poled, powder of the relevant composition was mixed with an epoxy resin (M-Bond 610, Agar Scientific), centrifuged for 5 min at 40,000 RPM and cured for 4 h at 100 °C, using the technique reported by Carr [19]. One of the main benefits of using composites instead of porous ceramics is that the absence of air within the material means that high fields can be used without arcing. Silver paste (RS Components) was used to paint electrodes onto these composites, which were then poled for 10 min at room temperature at fields up to a maximum of 6 kV/mm. Values of d33, the piezoelectric coefficient relating the charge generated on the faces normal to an applied force, were obtained using a YE2730A d33 meter (APC International, Ltd.). This method of mixing powder samples into a resin matrix creates a ‘0-3 composite’, so-called because a representative cube of the composite comprises a dispersed piezoelectric phase with no connectivity in the three directions perpendicular to the cube faces, while the matrix phase has connectivity in all three directions [20].
3
Design) was used to cool the samples to -263 °C at 1 °C/min. The capacitance was measured in-situ with an Agilent 4294A Impedance Analyzer.
3. Results and Discussion
3.1. Ferroelectric ↔ Paraelectric transition
Table 1 shows the values of d33 recorded for composites in the series. These show that samples with compositions x ≥ 0.6 are ferroelectric at room temperature, while those with compositions x ≤ 0.5 are not. As samples x ≤ 0.7 are monoclinic at room temperature, this shows that ferroelectricity persists into the monoclinic phase field. 0-3 composites containing 60 vol% Pb(Zr1-xTix)O3 (PZT) have been found to have a d33 an order of magnitude lower than that of the corresponding ceramic [21]. The d33 of Ag2Nb4O11 is therefore anticipated to be around 50 pC/N - similar to that of many perovskites.
Composition, x Maximum poling field (kV/mm)
d33 (pC/N)
0 6 0
0.25 6 0
0.5 6 0
0.6 4.3 0.8
0.65 6 0.4
0.7 3.9 1.0
0.75 2.3 2.5
1 6 3.4
Table 1: Piezoelectric coefficients for composites in the xAg2Nb4O11 – (1-x)Na2Nb4O11 solid solution at room temperature. Where fields below 6 kV/mm are reported, the maximum applicable field was limited by sample conductance. The error in the reported d33 values is ± 5 %.
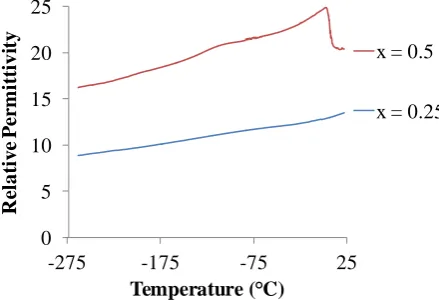
Low-temperature permittivity was used to locate the ferroelectric phase transition below room temperature (Fig. 1). The composition x = 0.5 shows a peak in permittivity at ~ 2 °C, indicating the ferroelectric phase transition, while the composition x = 0.25 shows no peak between room
temperature and -263 °C, showing that the temperature of the ferroelectric phase boundary drops sharply for x < 0.5. It was found that the temperature of the peak in the x = 0.5 trace was repeatable to within ±15 °C.
0 5 10 15 20 25
-275 -175 -75 25
R
el
a
ti
v
e
P
erm
itti
v
ity
Temperature ( C)
x = 0.5
[image:4.595.188.408.509.659.2]x = 0.25
Fig. 1: Low-temperature permittivity obtained during cooling for ceramics with compositions x = 0.5 and x = 0.25. These data have not been corrected for porosity.
3.2. Rhombohedral ↔ Monoclinic transition
Powder XRD patterns of compositions across the series were used for Pawley refinements to obtain lattice parameters for each composition in the series. The volume per formula unit for each
4
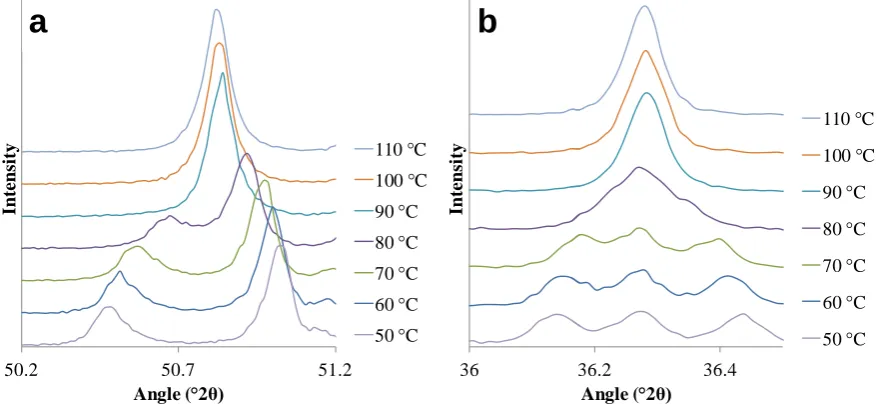
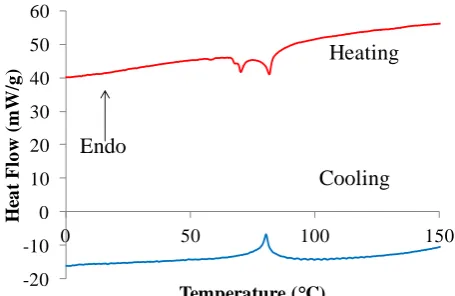
coexist, it is clear that the phase transition from R to M is accompanied by an increase in volume. It therefore follows that there should be an associated peak in DSC for R – M phase transitions. High-temperature XRD data of Na2Nb4O11 (x = 0) (Fig. 3) show peaks that split on transforming from R to M. These data show that the R – M phase transition is close to 80 °C for Na2Nb4O11. DSC data for x = 0 are shown in Fig. 4, where the only peak in this range has a mean onset temperature of 80 (2) °C. It is concluded that this peak arises due to the R – M phase transition and its onset temperature can therefore be used to give a more precise measure of the phase transition temperature than XRD. The physical origin of the peak at ~ 70 °C in the heating curve is unknown.
204.8 205 205.2 205.4 205.6 205.8 206 206.2
0 0.2 0.4 0.6 0.8 1
V
o
lu
m
e
p
er
fo
rm
u
la
u
n
it
(Å
3)
Composition, x
Rhombohedral
[image:5.595.190.411.203.372.2]Monoclinic
Fig. 2: Volume per formula unit of compositions in the xAg2Nb4O11 – (1-x)Na2Nb4O11 series derived from Pawley refinements.
50.2 50.7 51.2
Intens
ity
Angle ( 2θ)
110 C
100 C
90 C
80 C
70 C
60 C
50 C
a
36 36.2 36.4
Intens
ity
Angle ( 2θ)
110 C
100 C
90 C
80 C
70 C
60 C
50 C
b
Fig. 3: High-temperature XRD data from x = 0 (Na2Nb4O11) showing the evolution of two key peaks with temperature: (a) {300}R splits into {602 }M and { 3 31}M peaks (b) {1 26}R splits into {311}M,
[image:5.595.76.515.423.625.2]5 -20
-10 0 10 20 30 40 50 60
0 50 100 150
H
ea
t
F
lo
w
(m
W/
g
)
Temperature ( C)
Endo
Heating
[image:6.595.182.410.75.223.2]Cooling
[image:6.595.182.400.364.512.2]Fig. 4: DSC heating and cooling data for Na2Nb4O11 (x = 0) showing peak due to R – M transition.
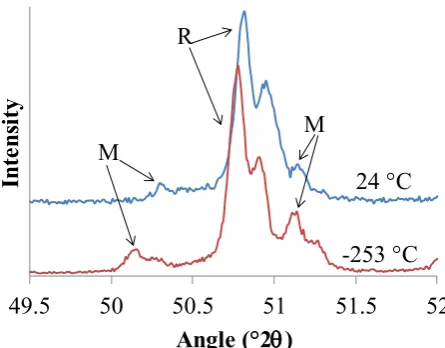
Fig. 5 shows that this peak moves to lower temperatures as x increases. The mean onset values derived from these peaks for the corresponding R – M transition are given in Table 2. No relevant peak was observed in DSC for x = 0.75, but at room temperature, XRD shows the presence of both R and M phases. Low-temperature XRD of x = 0.75 shows that both sets of peaks persist to -253 °C (Fig. 6), indicating that the R – M phase boundary at x = 0.75 is virtually temperature-independent. Perhaps the best-known example of a temperature-independent phase boundary is in PZT, at which piezoelectric properties are found to be maximised [22,23]. It is yet to be shown whether piezoelectric properties are maximised at this, a phase boundary in a different structural system.
0 20 40 60 80 100
H
e
at
F
low
Temperature ( C)
x= 0.7 x= 0.65
x= 0.6 x= 0.5
x= 0.25
[image:6.595.190.439.551.641.2]x= 0 Endo
Fig. 5: DSC cooling data for compositions in the xAg2Nb4O11 – (1-x)Na2Nb4O11 series.
Composition, x Mean onset temperature (°C)
0.7 30 (5)
0.65 34 (5)
0.6 39 (5)
0.5 47 (5)
0.25 55 (5)
0 80 (2)
6
49.5
50
50.5
51
51.5
52
In
te
ns
ity
Angle ( 2
q
)
24 C
-253 C
M
[image:7.595.182.405.77.251.2]M
R
Fig. 6: XRD of x = 0.75 sample showing the presence of {300}R, {602 }M and { 3 31}M peaks
corresponding to both R and M phases at 24 and -253 °C.
3.3. R3c ↔ R3 transition
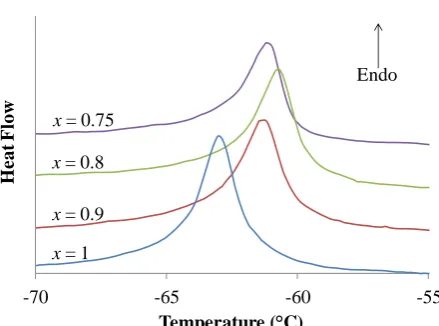
DSC shows strong peaks in the heating and cooling sections for Ag2Nb4O11 with a mean onset temperature of -62 (1) °C (Fig. 7) and it is assumed that these peaks are associated with the volume change of the R3c – R3 phase transition. This transition was found to be present in all samples with compositions x ≥ 0.75, i.e. those with rhombohedral symmetry at room temperature (Fig. 8). The temperature of this phase transition is almost independent of composition, varying by only 2 °C across the four samples (Table 3). Samples with compositions x ≤ 0.7 have no peaks that could correspond to this transition and so it must be concluded that the phase transition mechanism does not take place in the monoclinic variant. Where the R3c – R3 phase boundary meets the R – M phase boundary, there is therefore a triple point.
-20 -10 0 10 20 30
-100 -75 -50 -25 0
H
ea
t
F
lo
w
(m
W/
g
)
Temperature ( C)
Heating Cooling
[image:7.595.184.415.444.602.2]Endo
7
-70 -65 -60 -55
H
e
at
F
low
Temperature ( C)
x= 0.75
x= 0.8
x= 0.9
x= 1
[image:8.595.191.411.73.236.2]Endo
Fig. 8: DSC cooling curves for compositions with x ≥ 0.75 showing peaks due to R3c – R3 phase transition.
Composition, x Mean onset temperature (°C)
1 -62 (1)
0.9 -61 (1)
0.8 -61 (1)
0.75 -61 (1)
Table 3: Mean onset temperatures for R3c – R3 phase transition from heating and cooling DSC data.
4. Conclusions
High- and low-temperature X-ray diffraction, differential scanning calorimetry, low-temperature permittivity and room-temperature piezoelectric techniques have been used to plot a phase diagram as a function of temperature for compositions in the natrotantite-structured system xAg2Nb4O11 – (1-x)Na2Nb4O11 (Fig. 9). There are three separate phase transition types: (1) paraelectric – ferroelectric, (2) rhombohedral – monoclinic and (3) a phase transition within the ferroelectric rhombohedral zone between the space groups R3c and R3.
-250 -200 -150 -100 -50 0 50 100 150
0 0.2 0.4 0.6 0.8 1
T
e
mp
e
r
atu
re
(
C)
Composition, x
DSC
SHG
Permittivity
Piezo
R3c
R3
C2/c
R3c
_
[image:8.595.182.419.478.636.2]Cc
Fig. 9: Phase diagram of the xAg2Nb4O11 – (1-x)Na2Nb4O11 solid solution. SHG data taken from [6].
8
monoclinic phase field and it is concluded that a triple point is formed where it meets the rhombohedral – monoclinic phase boundary.
Acknowledgments
The PANalytical MPD diffractometer used in this research was obtained though the Science City Energy Futures Project: Hydrogen Energy, with support from Advantage West Midlands (AWM). The DSC, PPMS and Impedance Analyzer used in this research were obtained though the Science City Advanced Materials project: “Creating and Characterizing Next Generation Advanced Materials” project, with support from Advantage West Midlands (AWM) and partly funded by the European Regional Development Fund (ERDF).
[1] M. C. Stennett, I. M. Reaney, G. C. Miles, D. I. Woodward, A. R. West, C. A. Kirk, I. Levin, J. Appl. Phys. 101 (2007) 104114.
[2] V. A. Isupov, Tech. Phys. 42 (1997) 1155-1157.
[3] M. T. Weller, R. W. Hughes, J. Rooker, C. S. Knee, J. Reading, Dalton Trans. 19 (2004) 3032-3041.
[4] R. E. Newnham, R. W. Wolfe, J. F. Dorrian, Mater. Res. Bull. 6 (1971) 1029-1040.
[5] N. Masó, D. I. Woodward, P. A. Thomas, A. Várez, A. R. West, J. Mater. Chem. 21 (2011) 2715-2722.
[6] D. I. Woodward, P. A. Thomas, Appl. Phys. Lett. 98 (2011) 132904. [7] T. S. Ercit, F. C. Hawthorne, P. Černý, Bull. Mineral. 108 (1985) 541-549. [8] R. Mattes, J. Schaper, Rev. Chim. Miner. 22 (1985) 817-820.
[9] L. Jahnberg, J. Solid State Chem. 1 (1970) 454-462.
[10] L. Jahnberg, M. Sundberg, J. Solid State Chem. 100 (1992) 212-219.
[11] O. Palasyuk, A. Palasyuk, P. A. Maggard, Inorg. Chem. 49 (2010) 10571-10578. [12] Von E. Bayer, R. Gruehn, Z. Anorg. Allg. Chem. 507 (1983) 149-154.
[13] C. Zheng, A. R. West, J. Mater. Chem. 1 (1991) 163-167. [14] N. Masó, A. R. West, J. Mater. Chem. 20 (2010) 2082-2084.
[15] E. Irle, R. Blachnik, B. Gather, Thermochim. Acta 179 (1991) 157-169.
[16] N. Masó, D. I. Woodward, A. Várez, A. R. West, J. Mater. Chem. 21 (2011) 12096-12102. [17] D. C. Craig, N. C. Stephenson, J. Solid State Chem. 3 (1971) 89-100.
[18] A. A. Coelho, TOPAS-Academic v4.1, <http://www.topas-academic.net> (2007). Last accessed 09.02.12.
[19] M. J. Carr, J. Electron Micr. Microsc. Tech. 2 (1985) 439-443.