http://wrap.warwick.ac.uk
Original citation:
Li, Ruizhe, Li, Chang-Tsun and Guan, Yu (Researcher in Computer Science) (2014) A
reference estimator based on composite sensor pattern noise for source device
identification. In: Media Watermarking, Security, and Forensics 2014, San Francisco,
California, USA, 02 Feb 2014. Published in: SPIE Proceedings, Volume 9028
Permanent WRAP url:
http://wrap.warwick.ac.uk/62363
Copyright and reuse:
The Warwick Research Archive Portal (WRAP) makes this work by researchers of the
University of Warwick available open access under the following conditions. Copyright ©
and all moral rights to the version of the paper presented here belong to the individual
author(s) and/or other copyright owners. To the extent reasonable and practicable the
material made available in WRAP has been checked for eligibility before being made
available.
Copies of full items can be used for personal research or study, educational, or not-for
profit purposes without prior permission or charge. Provided that the authors, title and
full bibliographic details are credited, a hyperlink and/or URL is given for the original
metadata page and the content is not changed in any way.
Publisher’s statement:
Citation
: Li, Ruizhe, Li, Chang-Tsun and Guan,Yu, A reference estimator based on
composite sensor pattern noise for source device identification. In: Media
Watermarking,”
SPIE Proceedings Vol. 9028: Media Watermarking, Security, and
Forensics 2014, Adnan M. Alattar; Nasir D. Memon; Chad D. Heitzenrater, Volume 9028
(2014)
Copyright notice
: Copyright 2014 Society of Photo-Optical Instrumentation Engineers.
One print or electronic copy may be made for personal use only. Systematic
reproduction and distribution, duplication of any material in this paper for a fee or for
commercial purposes, or modification of the content of the paper are prohibited.
DOI abstract link
:
http://dx.doi.org/10.1117/12.2038651
A note on versions:
The version presented here may differ from the published version or, version of record, if
you wish to cite this item you are advised to consult the publisher’s version. Please see
the ‘permanent WRAP url’ above for details on accessing the published version and note
that access may require a subscription.
A reference estimator based on composite sensor pattern
noise for source device identification
Ruizhe Li, Chang-Tsun Li, and Yu Guan
Department of Computer Science
University of Warwick, Coventry, CV4 7AL, UK
ABSTRACT
It has been proved that Sensor Pattern Noise (SPN) can serve as an imaging device fingerprint for source camera identification. Reference SPN estimation is a very important procedure within the framework of this application. Most previous works built reference SPN by averaging the SPNs extracted from 50 images of blue sky. However, this method can be problematic. Firstly, in practice we may face the problem of source camera identification in the absence of the imaging cameras and reference SPNs, which means only natural images with scene details are available for reference SPN estimation rather than blue sky images. It is challenging because the reference SPN can be severely contaminated by image content. Secondly, the number of available reference images sometimes is too few for existing methods to estimate a reliable reference SPN. In fact, existing methods lack consideration of the number of available reference images as they were designed for the datasets with abundant images to estimate the reference SPN. In order to deal with the aforementioned problem, in this work, a novel reference estimator is proposed. Experimental results show that our proposed method achieves better performance than the methods based on the averaged reference SPN, especially when few reference images used.
Keywords: Multimedia forensics, source device identification, sensor pattern noise, photo-response non-uniformity.
1. INTRODUCTION
With a large amount of digital imaging devices, the use of digital images as key piece of evidences in the fight against crime is emerging, making digital forensic techniques more important. In some cases, forensic investigators need to identify the origin of images in order to link the images to a suspect. Therefore, effective techniques for identifying the origin of digital images are urgently needed.
Sensor pattern noise has been proved as the most efficient forensic techniques for identifying source imaging device[1]. It can be used to identify individual cameras even of the same brand and model because of its uniqueness. Firstly, Lukas et al. [1] used a wavelet-based denoising technique [2] to extract the sensor pattern noise as the link between the query image and its origin. Since the main component in SPN is Photo Response Non-Uniformity noise (PRNU) which is a kind of multiplicative noise, Chen et al. [3] proposed a maximum likelihood method to estimate the corresponding multiplicative factor from the reference images. Later, Goljan
et al. [4] introduced the Peak to Correlation Energy ratio (PCE) as a replacement for normalized correlation detector to reduce the false acceptance rate. In [5], Li pointed out that the noise residue contains significant characteristics of the SPN, but it can be easily affected by the image content. To address this issue, Li introduced an enhanced SPN by assigning higher weight to the reliable components. A further investigation into SPN’s location-dependent quality is reported by Li and Satta in [6]. In [7], Kang et al. applied the context adaptive interpolation to predict the noise-free image for suppressing the impact of image content before SPN feature extraction.
The existing methods generally estimate the camera reference SPN from a number of blue sky images taken by the same digital camera. This method was applied because the smooth and bright images provide pure SPNs and averaging multiple images suppresses the random noises. However, in practice we may face the special case of source device identification, which is lacking the camera and its reference SPN in the investigators possession.
(a) (b) (c)
Figure 1. (a) Four natural images with scene details. All the four images are taken by the same camera. (b) Four SPNs extracted from the images in Figure (a). (c) A composite SPN consists of blocks collected from the SPNs in Figure 1(b).
Under this circumstance, it is more likely that only ordinary pictures with scene details are available for the reference SPN estimation rather than blue sky images. In addition, the number of available reference images sometimes is too few (<20) for the existing methods to build a reliable reference SPN. Although there have been several studies dedicated to improving the performance of SPN based source camera identification, an efficient method for estimating the reference SPN from a limited number of images with scene details is still lacking. In this work, we propose a novel approach for estimating reliable reference SPN from a limited number of natural images so as to improve the performance of source device identification. Experimental results show that our proposed method achieves better performance than the schemes based on the averaged reference SPN especially when few reference images used.
The rest of this is organized as follows. In Section 2, we will first describe how to evaluate the quality of SPN blocks for reference SPN estimation. Then a composite reference estimator is proposed. Experimental results are reported in Section 3. The conclusion and future plan are set out in Section 4.
2. PROPOSED METHOD
The SPN extracted from images with strong scene details can be severely contaminated, as a result, the reference SPN estimated by averaging these SPNs is unsatisfactory. However, there should be some relatively smooth and bright region insides these images, which can provide cleaner SPNs than the regions with scene details (because the SPNs extracted from smooth and bright regions are more correlated to ground truth than those from the regions with scene details). Due to the variety of SPN quality within any image with scene details, a more reliable reference SPN can be achieved by assigning higher weight to the SPNs obtained from the smooth and bright regions rather than the averaging method treating the SPNs from all the regions equally. In order to facilitate the following weighting operation, we combine the SPNs with the same quality level (in terms of smoothness and brightness of its source image region) from different locations together to form a new SPN. To estimate the reference SPN, we just assign a certain amount of weighting factors to the composite SPN according to the level of its quality.
For example, Figure 1(a) shows four natural pictures which contain strong details from the scenes, and there are still some smooth and bright regions in each of them. We roughly divided each image into 4 blocks, and marked out the optimal blocks in terms of smoothness and brightness among the blocks in the same location of these 4 images. From Figure 1(b) we can see that the SPNs extracted from these optimal blocks contain less scene details than the SPNs from other blocks. As illustrated in Figure 1(c), a composite SPN, with optimal SPN blocks collected from Figure 1(b), contains cleaner SPN than any individual SPN in Figure 1(b). It suggests that assigning higher weight to the composite SPNs with SPN blocks collected from smoother and brighter image regions, a more reliable reference SPN can be obtained.
2.1 SPN Blocks Quality Measurement
[image:3.595.69.537.75.205.2]is therefore proposed
Q(IBlock) =
( B(I
Block)
E(IBlock), if30< B(IBlock)<253
0, else (1)
where B(IBlock) is the average brightness of image block IBlock. Notice that SPNs extracted from dark or
saturated regions are very weak. So we exclude a regionIBlock ifB(IBlock)630 orB(IBlock)>253. E(IBlock)
is the entropy ofIBlock, which is a statistical measure of randomness that can be used to characterize the degree
of details in images. The smoother the image region is, the lower the entropy it should be. It is calculated as follow
E(IBlock) =−
255
X
k=0
pklog2pk (2)
wherekis a gray level value of a pixel,pk is the probability of the gray level valuekin the image regionIBlock.
2.2 Methodology
The proposed reference SPN estimator is built in five steps and details for individual steps are shown as follow:
Step 1. Assume there are a set of imagesGi(i= 1, ..., N) taken by the same camera. Firstly, we extract raw
SPNWi from eachGi in the discrete wavelet domain, such that
Wi=DW T(Gi)−F(DW T(Gi)) (3)
whereDW T is discrete wavelet transform andF is the wiener filter. Here, we extract SPNs from Red, Green and Blue channel separately and combine them intoWi by using the linear combination as in RGB to grayscale
conversion. The obtainedWi is then transformed to the spatial domain and normalized intoHi(i= 1, ..., N). Step 2. Each imageGiand SPNHiis then segmented into a set of non-overlapping image blocksgij(j = 1, ..., M)
and SPN blockshij(j = 1, ..., M), respectively. So each imageGi and SPN Hi will have M subblocks fromM
locations. The size ofgijand its correspondinghijisS. Each obtained image blockgijis then used for evaluating
the quality Qij of its corresponding SPN block hij. All the obtained SPN blocks are used as candidates for
constituting the new SPNs.
Step 3. For each location j, SPN blocks hij(i = 1, ..., N) from N images are sorted in the descending order
according to their qualityQij. SPN blockhij with better quality will have higher ranking (with 1 as the highest). Step 4. SPN blocks from different locations with the same ranking are then selected to form a new SPN. By repeating this stepN times, a set ofN composite SPN Cd(d= 1, ..., N) can be generated, each with the rank
valued. Notice that, after this step, not only SPNs constituted clean SPN blocks but also SPNs which are full of scene details can be obtained. In this work, the composite SPNs composited by low-quality SPN blocks are also taken into account for the reference SPN estimation as they still can contribute to remove random noises, especially when the number of available images is limited.
Step 5. Instead of calculating the reference SPN by averaging the SPNs extracted from multiple images, we assign higher weight to the composite SPNCd with higher ranking. Weighting factorωdfor each composite SPN
Cd is calculated as follow
ωd=
2(N+ 1−d)
N(N+ 1) , d∈[1, N] (4)
Finally, the reference SPNr is estimated as the weighted average of theN composite SPNs
r=
N
X
d
ωdCd, d∈[1, N] (5)
Notice that different size S of image and SPN blocks will affect the estimated reference SPN r. Applying smallerS is more likely to achieve better performance. However, whenS is too small (e.g., 16×16 pixels) the computational complexity may become unacceptable. In order to find an proper setting ofS, the performance in terms of the Receiver Operating Characteristic curve (ROC) curves of our proposed method measured on three different sizes ofS (i.e. 16×16, 32×32 and 64×64 pixels) is shown in Figure 2. As illustrated in Figure 2, the results with three sizes are very similar, which implies the impact of SPN block sizeS is relatively low for reference SPN estimation. In this work, we useS= 64×64 as it is 2 and 4 times faster thanS = 32×32 and
10−3 10−2 10−1 100 0
0.1 0.2 0.3 0.4 0.5 0.6 0.7 0.8 0.9 1
Flase positive rate
Ture positive rate
Block size 16×16 Block size 32×32 Block size 64×64
(a)
10−3 10−2 10−1 100 0
0.1 0.2 0.3 0.4 0.5 0.6 0.7 0.8 0.9 1
Flase positive rate
Ture positive rate
Block size 16×16 Block size 32×32 Block size 64×64
[image:5.595.101.511.79.256.2](b)
Figure 2. The ROC performance with respect to three different SPN block sizes. (query/reference image size: (a) 128×128 pixels. (b) 256×256 pixels. reference image number: 15)
2.3 Detection Statistics
Normalized Cross Correlation is applied in this work to measure the similarity between the query SPN q and the estimated reference SPN r. The model is formulated as
corr(q, r) = (q−q) (r−r)
kq−qk kr−rk (6)
whereqandrare the means of qandr, respectively.
3. EXPERIMENTS
In order to validate the capability of our method, we test our method on the Dresden Image dataset [8] and compare it with the state-of-the-art schemes [1,5], of which the reference SPN is estimated by averaging. A total of 2400 images from 16 camera devices are involved in this experiment, each device responsible for 150. These 16 camera devices belong to four camera models, so each camera model has 3∼5 different devices. Table 1 lists the cameras used in the dataset.
Table 1. Cameras used in our experiment
Cameras Alias Resolution Cameras Alias Resolution
Canon Ixus70 A C11 3072×2304 Samsung L74wide A C31 3072×2304
Canon Ixus70 B C12 3072×2304 Samsung L74wide B C32 3072×2304
Canon Ixus70 C C13 3072×2304 Samsung L74wide C C33 3072×2304
Nikon CoolPixS710 A C21 4352×3264 Olympus mju 1050SW A C41 4352×3264
Nikon CoolPixS710 B C22 4352×3264 Olympus mju 1050SW B C42 4352×3264
Nikon CoolPixS710 C C23 4352×3264 Olympus mju 1050SW C C43 4352×3264
Nikon CoolPixS710 D C24 4352×3264 Olympus mju 1050SW D C44 4352×3264
Nikon CoolPixS710 E C25 4352×3264 Olympus mju 1050SW E C45 4352×3264
[image:5.595.88.525.509.647.2]10−3 10−2 10−1 100 0 0.1 0.2 0.3 0.4 0.5 0.6 0.7 0.8 0.9 1
Flase positive rate
Ture positive rate
[image:6.595.336.522.78.238.2]Model 3 Proposed Basic
Figure 3. The ROC curves on images with size of 128×128 pixels and 15 reference images.
10−3 10−2 10−1 100 0 0.1 0.2 0.3 0.4 0.5 0.6 0.7 0.8 0.9 1
Flase positive rate
Ture positive rate
[image:6.595.85.273.79.238.2]Model 3 Proposed Basic
Figure 4. The ROC curves on images with size of 128×128 pixels and 30 reference images.
10−3 10−2 10−1 100 0 0.1 0.2 0.3 0.4 0.5 0.6 0.7 0.8 0.9 1
Flase positive rate
Ture positive rate
Model 3 Proposed Basic
Figure 5. The ROC curves on images with size of 256×256 pixels and 15 reference images.
10−3 10−2 10−1 100 0 0.1 0.2 0.3 0.4 0.5 0.6 0.7 0.8 0.9 1
Flase positive rate
Ture positive rate
Model 3 Proposed Basic
Figure 6. The ROC curves on images with size of 256×256 pixels and 30 reference images.
dataset and test image dataset, each with 30 and 120 images respectively. Images in reference image dataset are used for reference SPN estimation and images in test image dataset are for identification as test samples. Instead of using the full size photo, both reference and test images are of three different sizes (i.e. 128×128, 256×256 and 512×512 pixels) cropped from the center of entire image.
The corresponding experimental results in terms of the overall Receiver Operating Characteristic curve are used for presenting the performance. For each chosen camera, we first estimate reference SPN using L= 15 and
L = 30 images from the reference image dataset for different methods respectively. Then, 120 test images of this camera are selected as the positive samples and 1800 test images of the other 15 cameras (each responsible for 120) are selected as the negative samples. Totally we get 120×15 positive and 1800×15 negative samples of correlation values for the overall 16 cameras. For each given detection threshold, the number of true positive decisions and the number of false positive decisions for each camera are recorded respectively, and then they were summed up to obtain the overall True Positive Rate (TPR) and overall False Positive Rate (FPR). Finally, the overall ROC curve can be created by plotting the FPR versus overall TPR in conjunction with different threshold setting.
[image:6.595.81.275.280.436.2] [image:6.595.335.515.280.438.2]10−3 10−2 10−1 100 0
0.1 0.2 0.3 0.4 0.5 0.6 0.7 0.8 0.9 1
Flase positive rate
Ture positive rate
[image:7.595.99.360.79.240.2]Model 3 Proposed Basic
Figure 7. The ROC curves on images with size of 512×512 pixels and 15 reference images.
10−3 10−2 10−1 100 0
0.1 0.2 0.3 0.4 0.5 0.6 0.7 0.8 0.9 1
Flase positive rate
Ture positive rate
[image:7.595.283.510.80.241.2]Model 3 Proposed Basic
[image:7.595.176.439.285.364.2]Figure 8. The ROC curves on images with size of 512×512 pixels and 30 reference images.
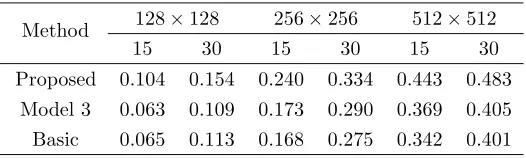
Table 2. The TPR of three methods at a low FPR of 10−3
Method 128×128 256×256 512×512
15 30 15 30 15 30
Proposed 0.104 0.154 0.240 0.334 0.443 0.483 Model 3 0.063 0.109 0.173 0.290 0.369 0.405 Basic 0.065 0.113 0.168 0.275 0.342 0.401
show that, on the challenging Dresden Image Database, the proposed method outperforms the other methods [1,5], especially for a few number of reference images.
Table 2 shows the TPR of different methods at a low FPR of 10−3. It shows that the TPR of the proposed method is always the largest at a low FPR. In addition, we can see that the difference between TPR of proposed method on 15 and 30 reference images is smaller than other methods. For example, on images with size of 128×128, the TPR of proposed method drops 32.5%, from 0.154 at 30 reference images to 0.104 at 15 reference images. The TPR of the Model 3 and Basic method decrease 47.8% and 42.5% respectively. It implies that the impact of losing reference images on the proposed method is not as serious as other methods.
4. CONCLUSION
In this paper, we introduced a measurement based on the smoothness and brightness to evaluate the quality of SPN blocks for the reference SPN estimation. Based on this measurement, a novel reference SPN estimator is then proposed to improve the performance of source device identification. By weighting the SPN blocks according to their quality, the proposed estimator can achieve reliable reference SPN from the limited number of natural images with scene details. Experimental results show that our method achieves better results than the state-of-the-art schemes, especially when the number of available reference images is few. These results demonstrate that our proposed technique is more practical for solving the problem of source device identification in the absence of the imaging camera than the methods based on the averaged reference SPN.
REFERENCES
[1] J. Lukas, J. Fridrich, and M. Goljan, “Digital camera identification from sensor pattern noise,”IEEE Trans-actions on Information Forensics and Security,vol. 1(2), pp. 205–214, 2006.
[2] M. Mihcaak, I. Kozintsev, and K. Ramchandran, “Spatially adaptive statistical modeling of wavelet image co-efficients and its application to denoising,” inProc. IEEE Int. Conf. Acoustics, Speech and Signal Processing,
vol. 6, pp. 3253–3256, 1999.
[3] M. Chen, J. Fridrich, M. Goljan, and J. Lukas, “Determining image origin and integrity using sensor noise,”
IEEE Transactions on Information Forensics and Security,vol. 3(1), pp. 74–90, 2008.
[4] M. Goljan and J. Fridrich, “Digital camera identification from images - estimating false acceptance proba-bility,” inin Proc. of the 8th Int. Workshop on Digital-forensics and Watermarking, November 10-12, 2008. [5] C.-T. Li, “Source camera identification using enhanced sensor pattern noise,” IEEE Transactions on
Infor-mation Forensics and Security,vol. 5(2), pp. 280–287, 2010.
[6] C.-T. Li and R. Satta, “Empirical investigation into the correlation between vignetting effect and the quality of sensor pattern noise,”Computer Vision, IETvol. 6(6), pp. 560–566, 2012.
[7] G. Wu, X. Kang, and K. Liu, “A context adaptive predictor of sensor pattern noise for camera source identification,” inProc. of the 19th IEEE Int. Conf. on Image Processing, pp. 237–240, 2012.