0
A MULTISENSORY WINE TASTING EXPERIENCE
Influence of (in)congruent room design on taste perception and liking
MASTER THESIS
Student: Daphne Lagraauw
Student number: S1731815
Date: 22-9-2019
1 Abstract
Purpose
The purpose of this experiment was to explore the influence of ambient lighting, ambient music and personal characteristics on the taste of white wine. More specific, the combination of (in)congruent ambient music (sweet vs. sour) and ambient lighting (red vs. green) on the taste of a sweet and a dry white wine was explored. Sensitivity to room design (SRD) was measured to find effect of personal characteristics on the multisensory wine tasting
experience. Design
A 2 (sweet ambient music vs. sour ambient music) x 2 (red ambient lighting vs. green ambient lighting) x 2 (low SRD vs. high SRD) field experiment was performed. The sweet music was high pitched, consonant and legato. The sour music was high pitched, dissonant and staccato.
In a restaurant, two congruent and two incongruent room designs were created by using different combinations of ambient colored lighting and ambient music. A ‘sour room’ with sour music and green lighting, and a ‘sweet room’ with sweet music and red lighting were
considered as congruent. The incongruent rooms had a combination of sweet music and green lighting or sour music and red lighting. Both a sweet and dry white wine were tasted in the designed rooms. The taste of the wines and SRD were measured using paper
questionnaires. Findings
The field experiment showed that incongruent room design emphasized specific taste aspects in white wine and increased liking. Sweet white wine tasted more sour in the incongruent room designs. The dry white wine was liked more in the incongruent room
designs. Moreover, the congruent ‘sour room’ made the sweet white wine taste less salty and more fruity.
Practical recommendations
If a restaurant or wine tasting event uses ambient colored lighting and ambient music to influence wine tasting, it is recommended that they use incongruent stimuli.
Future implications
As the findings do not all support former results of similar studies, future experiments should be performed in realistic settings more often. Also personal characteristics should be
2
Table of Contents
1. Introduction 3
2. Theoretical framework 5
2.1 Multisensory experience and (in)congruence 5
2.2 Crossmodal correspondence 6
2.3 Color and taste 6
2.4 Music and taste 9
2.5 Color, music and taste 11
2.6 Moderator 12
2.7 Covariates 13
3. Method 15
3.1 Pre-test 1 15
3.2 Pre-test 2 16
3.3 Design and stimulus materials 17
3.4 Procedure 17
3.5 Participants 18
3.6 Measures 19
3.7 Analyses 21
4. Results 22
4.1 Main effects 22
4.2 Effects of the independent variables on sweet white wine 23 4.3 Effects of the independent variables on dry white wine 26
4.4 Interaction effects on sweet white wine 29
4.5 Interaction effects on dry white wine 32
5. Conclusion and discussion 35
5.1 Limitations 39
6. Practical recommendations and implications for future research 40
References 41
Appendix 46
Appendix 1 Wine specifications 46
Appendix 2 Music specifications 47
Appendix 3 Room specifications 48
Appendix 4 CVPA to SRD 50
3
1. Introduction
In recent years, multisensory wine tasting events have grown explosively (Spence, 2019). Stimulating different senses while eating or drinking can be called a multisensory taste experience. A product that is given more and more attention in the field of multisensory taste experiences is wine. This lead to several multisensory wine tasting events, where different stimuli are used to influence taste experience (Spence, 2019).
During these events, music often served as the main stimuli. Pairing music with wine goes back a long way. Wine experts and also non-experts are able to reliably match wines with particular pieces of music (Spence & Wang, 2015). Furthermore, research shows that music can even modulate the taste perception of wine (Wan & Spence, 2015; Spence, Velasco, & Knoeferle, 2014).
Another stimulus that is linked to multisensory wine tasting is color, and more specific colored ambient lighting. Color is matched with and can change the taste perception of wine. For example, Oberfeld, Hecht, Allendorf, and Wickelmaier (2009) found that wine tasted sweeter and fruitier when red lighting was present in a room. Spence, Velasco, and Knoeferle (2014) combined the use of music and colored lighting in a multisensory wine tasting study. The results implicate that the combination of color and music can influence the taste perception of wine. Inspired by Spence, Velasco and Knoeferle (2014), the present study will also use ambient lighting and ambient music for a multisensory wine tasting study. The connection between the stimuli used during a wine tasting experience needs to be considered. It can be more effective if the stimuli in a multisensory experience are
congruent, which means that they are corresponding. Congruence can lead to more positive product evaluations (liking) (Krishna, Elder, & Caldara, 2010). On the other hand, contrary literature claims that (moderate) incongruence can also lead to liking of taste (Havermans & Hendriks, 2019). Literature about (in)congruence and its effect on liking of taste show conflicting results.
Also, the question whether congruence or incongruence of stimuli has any overarching effect on basic tastes and taste aspects such as intensity or fruitiness is still unanswered. Therefore, the present study will focus on the effect of congruent vs.
incongruent ambient music and colored ambient lighting, and its effect on taste perception and taste pleasantness (liking) of wine. In the discussion, attention will be given to the match of wine type and the room design, as wine type can also be (in)congruent with the
environment.
In the former wine experiment that is performed with a combination of ambient lighting and music (Spence, Velasco, & Knoeferle, 2014), personal characteristics are not taken into account. As a taste experience is a very complex and personal experience, this may be a necessary step to gain more knowledge in the field of multisensory taste
experiences. Stimuli in a wine taste environment that can influence taste may be perceived differently from person to person. Therefore, a variable was created: Sensitivity to Room Design (SRD). SRD is the significance that room design has for an individual, and will be measured in the present study.
Combining all the above, the following research question was formed:
● Can (in) congruent music and ambient lighting, and sensitivity to room design influence taste perception and taste pleasantness of wine?
4
designs for every condition, two congruent and two incongruent. Participants could fill in a questionnaire while tasting the wine. Through the use of a questionnaire, different questions about the taste of the wine were asked, sensitivity to room design was measured, and eventually personal details were collected. The data was analyzed using SPSS.
5
2. Theoretical framework
2.1 Multisensory experience and (in)congruence
A multisensory experience is an experience that combines our different sensory modalities; taste, sight, sound, smell and touch. One can imagine that almost all of our daily experiences are multisensory. For example, when walking outside, sounds, scents, colors and
temperature are perceived and processed by an individual. These stimuli can affect an individual's perception, judgement and behavior (Krishna, 2011).
Multisensory experiences seem to be more effective when stimuli are congruent. Congruence can be defined as the ´degree of fit among characteristics of a stimulus´ (Krishna, Elder, & Caldara, 2010, p. 412). Congruence is effective because it can lead to better information processing (Clark & Fiske, 1982), faster recognition of stimuli (Laurienti et al, 2002) and more positive product evaluations (Krishna, Elder, & Caldara, 2010).
Congruence can lead to more positive evaluations of various objects. For example,
Spangenberg et al. (2005) showed that congruence between ambient scent and music in a store improved the store evaluations. Krishna, Elder, and Caldara (2010) did a research on the effect of congruency between touch and smell. They conducted two studies, one with paper (rough vs. smooth) and smell (feminine vs. masculine), and one with gel packs (warm vs. cold) and temperature scent (warm vs. cold). The studies showed that congruence between touch and smell lead to more positive evaluations of both paper and gel packs. The effect of congruence on taste experience has not received a lot of attention yet. The assumption is that congruence can lead to increased ratings of taste pleasantness (Labroo, Dhar, & Schwartz, 2008). To study this assumption, Wang and Spence (2015) conducted an experiment with wine and live music. The focus was on congruence between music characteristics and wine characteristics. The experiment had a congruent and incongruent condition. It showed that participants rated the taste of the wine as more pleasant when it was accompanied with congruent music.
Recently, more attention is given to the effect of incongruent stimuli on taste. For example, Lanseng & Sivertsen (2019) studied the effect of incongruent information on the taste of wine. Before the wine tasting started, participants received information that was either congruent or incongruent with the wine. They found that incongruent information promoted liking of the wine, especially for people who were experienced wine drinkers. Havermans and Hendriks (2019) studied the effect of (in)congruent cup use (double walled glass vs. porcelain cup) and context (dining room vs. sensory laboratory) on the taste of coffee. Interaction effects between cup use and context were expected, but not found. The study did show that incongruent context, in this case a sensory laboratory, positively influenced liking of the taste of coffee.
6 2.2 Crossmodal correspondence
Why are two stimuli that are perceived in a different sensory modality seen as congruent? Scientists have not yet been able to agree on an answer. There are multiple theories that try to explain cross-modal associations between stimuli (Spence, 2011; Spence & Deroy, 2012). Scientists do have a name for the concept: crossmodal correspondence. Spence (2011, p. 972) defines the concept of crossmodal correspondences as ‘non arbitrary associations that appear to exist between different basic physical stimulus attributes, or features, in different sensory modalities’. A famous example is the Maluma-Takete effect: round shapes
[image:7.595.120.471.267.398.2]correspond with the soft sounding word Maluma, while angular shapes are connected to the sharp sounding word Takete (Kohler, 1929) (See Figure 1). The vision of the shape and the sound of the word are matched, which is called crossmodal correspondence.
Figure 1. Example of the ´takete´ (angular) and ´maluma´ (round) shape.
As mentioned before, there are different theories that explain the mechanism behind
crossmodal correspondence. One way to explain crossmodal correspondence is by means of the Bayesian integration theory (Ernst in Knoblich et al, 2006). This theory is supported and mentioned in multiple articles (Knoblich, Thornton, Grosjean, & Shiffrar, 2006; Roach, Heron, & McGraw, 2006; Spence, 2011). The Bayesian integration theory suggests that people combine prior knowledge and sensory information in a statistically manner when interacting with different stimuli. Ernst in Knoblich et al. (2006) argued that the strength of crossmodal correspondence is prior knowledge. Signals are combined, based on an expected distribution of these signals (i.e., a priori). Therefore, it can be argued that prior knowledge is an
important factor for crossmodal correspondence to occur.
2.3 Color and taste
Research shows that the basic tastes sour, salty, bitter, sweet and umami correspond with certain colors. Studies that focus on the crossmodal correspondence between color and taste have asked participants which taste matches a certain color, and the other way around (O´Mahony, 1983; Heller, 1999; Kock & Koch, 2003; Tomasik-Krótki & Strojny, 2008). A recent example is a cross-cultural study of Wan et al. (2014). Four groups of participants in China, India, Malaysia and the USA participated in an online study concerning the
7
sour taste and the white shapes with saltiness. Different studies that explored the
correspondence between basic tastes and colors showed similar results. Black is mostly associated with bitter, green and yellow with sour, orange, pink and red with sweet and white with saltiness (Wan et al., 2014; O´Mahony, 1983; Heller, 1999; Kock & Koch, 2003;
Tomasik-Krótki & Strojny, 2008).
[image:8.595.152.443.290.480.2]Research shows that certain colors and basic tastes can be matched. Therefore, these stimuli also can be seen as congruent. Presumably, these colors and tastes are matched because of statistical regularities of the environment. For example, a tomato is cross-cultural matched with the color red, and a cucumber with the color green (natural pairing). When it comes to chicken-flavored crisps, the pairing with colors varies across countries (Velasco, Wan, Knoeferle, Zhou, Salgado-Montejo, & Spence, 2015). This may indicate that perceived congruence depends on statistical regularities in the environment and culture.
Figure 2. Question format used in a study to assess the crossmodal correspondence between color and the five basic tastes. Reprinted from ´Cross-cultural differences in crossmodal correspondences between tastes and visual features´ by Wan et al. (2014), Frontiers in Psychology, 5, p. 1365
Next to taste perception, color can also influence taste experience. Research on taste modulation by means of color focuses mainly on changing the color of the food product. For example, several studies show that adding red food coloring increases the perception of sweetness (Pangborn, 1960; Strugnell, 1997; Spence & Levitan, 2010). Less research focuses on the effect environmental colors have on taste experience. Oberfeld, Hecht, Allendorf, and Wickelmaier (2009) found that wine can taste fruiter and sweeter when red lighting is present. Spence, Velasco and Knoeferle (2014) found that also the combination of sweet music and red lighting enhances the fruitiness of wine. Furthermore, their study showed that wine was liked more when the combination of sweet music and red lighting was present, compared to the environment with only red lighting. While the role of congruence is not mentioned in the study by Spence, Velasco and Knoeferle (2014), this can be a plausible explanation for the difference in liking.
8
of sweetness. Green is mostly matched with and can evoke the taste of sourness. Therefore, the following hypotheses were made:
● H1a: Participants experience a sweeter taste of white wine with red ambient lighting compared to participants who taste white wine with green ambient lighting.
9 2.4 Music and taste
There is a growing interest in the crossmodal association between taste and sound. Certain sounds seem to be associated with certain tastes (Knoeferle et al., 2015; Guetta & Loui, 2017; Crisinel & Spence, 2012), and sound can even influence the taste experience (Crisinel et al., 2012; Carvalho, Wang, Van Ee, Persoone, & Spence, 2017). Different studies
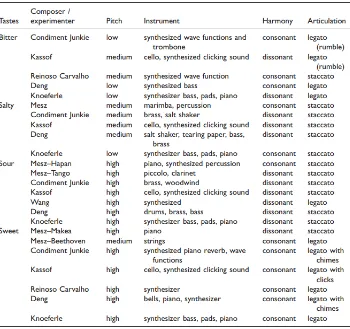
examined the crossmodal correspondence between music (soundtracks) and the basic tastes sweet, sour, salty bitter and (sometimes) umami. Wang, Woods, and Spence (2015) compared different studies that used soundscapes to evoke or match a specific taste. They analyzed the soundscapes based on pitch, harmony and articulation. Pitch can be high, medium or low, harmony can be consonant (not false) or dissonant (false) and the articulation can be legato (smooth) or staccato (not smooth).
Table 1 (Wang, Woods, & Spence, 2015, p. 5) shows the comparison of the different soundscapes used in different studies. It shows that bitter soundscapes have a medium to low pitch and are consonant and legato. Salty soundscapes have a medium pitch, mostly dissonant harmony and staccato articulation. Sour soundtracks are high pitched, dissonant and mostly staccato. Sweet soundtracks are most often high pitched, consonant and legato with the use of chimes or clicks. When for example a sour taste is combined with a sour soundtrack, these stimuli could be considered congruent. They are matched with each other, based on flavor or musical parameters that both communicate sourness.
Soundscapes can not only be matched with basic tastes, they can influence the taste experience as well. Crisinel et al. (2012) conducted an experiment with a bittersweet toffee and a sweet and sour soundscape. Participants had to taste four pieces of toffee with an identical taste. During two of the tasting rounds, sweet or sour soundscapes randomly played for 40 seconds. As expected, participants rated the taste of the toffee significantly more bitter when they listened to the bitter soundscape, and significantly more sweet when they listened to the sweet soundscape. An experiment with wine and live music of Wang and Spence (2015) showed that Jardin Sous la Pluie by Debussy, a high pitched and relatively high tempo piano solo, enhanced the sour taste in dry white wine. This effect was expected, based on the congruence of the soundtrack which is associated with sour taste (high pitched) and the taste of the dry white wine, which has a sour (acid) taste as well. The study shows that congruent musical parameters may influence the taste perception of wine.
The questions why such crossmodal correspondences between music and taste exist is still not answered. Spence and Deroy (2013) provide a few possible explanations in their article. A plausible explanation can be connotative or symbolic priming. For example, the words ´heavy´ and ´mellow´ both can be used for wine and music. If music triggers a certain interpretation (e.g. heavy), and wine is tasted at the same time, a certain characteristic of wine (e.g. heavy) can be primed. This effect was shown in a study of North (2012), but is not yet replicated or further investigated.
10 regularities of the environment.
As mentioned above, high pitched, consonant and legato music is mostly associated with the taste of sweetness, and high pitched, dissonant and staccato music is mostly matched with the taste of sourness. These musical parameters can also influence the taste experience. Therefore, the following hypotheses where made:
● H2a: Participants who drink white wine while listening to high pitched, consonant and legato music (sweet music) experience a sweeter taste than participants who drink white wine while listening to high pitched, dissonant and staccato music (sour music). ● H2b: Participants who drink white wine while listening to high pitched, dissonant and
[image:11.595.132.482.361.690.2]staccato music (sour music) experience a more sour taste than participants who drink white wine while listening to high pitched, consonant and legato music (sweet music).
Table 1.
Comparison of acoustic properties of soundscapes used in different studies.
11 2.5 Color, music and taste
In the present study, ambient lighting and ambient music were used. The lighting was either green or red. The music was either sweet (high pitched, consonant and legato) or sour (high pitched, dissonant and staccato). The combination of red lighting and high pitched,
consonant and legato music was seen as congruent. Both are associated with the taste of sweetness. Green lighting was combined with high pitched, dissonant and staccato music. Both are associated with sourness and therefore seen as congruent. Literature shows that both colored ambient lighting (Oberfeld, Hecht, Allendorf, & Wickelmaier, 2009; Spence, Velasco, & Knoeferle, 2014) and music (Crisinel et al., 2012; Wang & Spence, 2015) can change perceived taste.
Therefore, the following hypotheses were made:
● H3a: Participants who drink white wine in a room with red lighting and high pitched, consonant and legato music (sweet music) experience a sweeter taste than
participants who drink white wine in a room with green lighting and high pitched, dissonant and staccato music (sour music).
● H3b: Participants who drink white wine in a room with green lighting and high pitched, dissonant and staccato music (sour music) experience a more sour taste than
participants who drink white wine in a room with red lighting and high pitched, consonant and legato music (sweet music).
Most crossmodal studies only looked at the effect of colored lighting or music separately. Spence, Velasco, and Knoeferle (2014) did a study where they combined ambient lighting with congruent music. They examined the separate and combined effect of those stimuli on the perceived taste of wine. As mentioned before, their study showed that wine was liked more when the combination of sweet music and red lighting was present, compared to the environment with only red lighting. While it is not mentioned in the study by Spence, Velasco and Knoeferle (2014), this may be caused by the congruence between the sensory cues, as congruence can increase product liking (Krishna, Elder, & Caldara, 2010). Therefore, the present study focused on the effect of congruent or incongruent music and ambient lighting on the taste of a white wine.
Based on the above, the following hypotheses were made:
● H4a: Participants who drink white wine in a room with red lighting and high pitched, consonant and legato music (sweet music) like the wine more than participants who drink white wine in a room with red lighting and high pitched, dissonant and staccato music (sour music).
12 2.6 Moderator
Sensitivity to Room Design
Consumers increasingly make product choices based on aesthetic value. (Visual) aesthetics can influence consumers in different ways. First of all, it is a way to distinguish a product from another. Secondly, visual aesthetics have a symbolic function; it influences how a product is comprehended and evaluated. Finally, the appearance of a product is the first thing that a potential buyer sees. It is the first judgement made, based on the sensory experience. How important visual aesthetics are when buying a product, may vary per person. Bloch, Brunel, and Arnold (2003, p. 1) created a questionnaire which measures ´the centrality of visual product aesthetics (CVPA), defined as the level of significance that visual aesthetics hold for a particular consumer in his/her relationship with products´.
In their article, Bloch, Brunel and Arnold (2003) mention several possible areas of research expansion for the CVPA questionnaire. One of these areas is the aesthetics of (store) interiors. The assumption is that if an individual has greater abilities and/or interests regarding aesthetics, they will ´give them a relatively high weight wherever they may be encountered ́ (Bloch, Brunel, & Arnold, 2003). In the present study, the CVPA will be used to measure the significance of visual but also audible and sensible aesthetics of an individual, which will be called Sensitivity to Room Design (SRD). It is assumed that room design can be encountered in the same way as visual product aesthetics. This means that the design of a room influences consumers in three ways:
● Room design distinguishes stores, restaurants or other places from its competitors. ● Room design has a symbolic function; it can influence how consumers experience the
place, ambience or event.
● Room design is something that can connect with a customer, it is a judgement that follows from a sensory experience.
The CVPA is a continuous difference variable which ranges between low and high significance of visual aesthetics. A high significance of visual aesthetics means that an individual has a greater than average concern for aesthetics, independent of the setting (Bloch, Brunel, & Arnold, 2003). In this study, SRD ranges between a low and high sensitivity to room design. A high sensitivity to room design means that an individual has a greater than average concern for design, independent of the setting. It can be assumed that an individual with a high score on SRD pays more attention to the room and design elements such as music and colored lighting. Therefore, it may seem likely that an individual with a high score on SRD also experiences more effect of music and colored lighting while tasting wine.
Based on all the above, the following hypothesis was made:
13 2.7 Covariates
Hunger state
An additional variable that will be considered is hunger state. Research shows that the need for energy, which is called hunger state, can influence the evaluation of a food product or beverage. The liking of a flavor can also be influenced by a hunger state. For example, a sweet taste can predict a high energy level. A study by Mobini, Chambers, and Yeomans (2007) showed that a highly sweetened beverage was liked more when participants were in a hunger state, compared to when participants were in a sated state. Birch, McPhee,
Steinberg, & Sullivan (1990) found similar results for children. Children showed a preference for flavors with high energy content in a hunger state and a lower preference for flavors with high energy content in a sated state. The present study focuses on the taste and liking of a beverage. Therefore, hunger state was measured.
Culture
Even though some crossmodal correspondences are seen within and across different cultures, culture also can influence crossmodal correspondences. Velasco et al. (2016) did several experiments with taste and color in different countries. It showed that red is most frequently associated with sweetness in a lot of different cultures (mostly in South-America). There was a difference for saltiness: Mexicans mostly matched saltiness with the color brown, while Brazilians matched saltiness mostly with the color white. This shows a difference between the two cultures. It is worth mentioning that this also can be caused by the difference in meaning of taste words across languages. Still, cross-cultural differences seem to exist and need to be considered (Velasco et al., 2016).
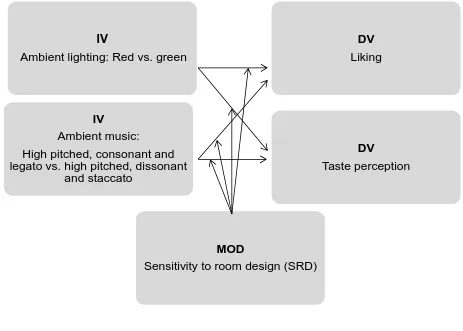
14 Figure 3. Conceptual framework
IV
Ambient lighting: Red vs. green
DV
Liking
IV
Ambient music:
High pitched, consonant and
legato vs. high pitched, dissonant
and staccato
DV
Taste perception
MOD
15
3. Method
To test the hypotheses, two pre-tests and an experiment were performed. In this chapter, the design and methods of the pre-tests and the field experiment will be explained.
3.1 Pre-test 1
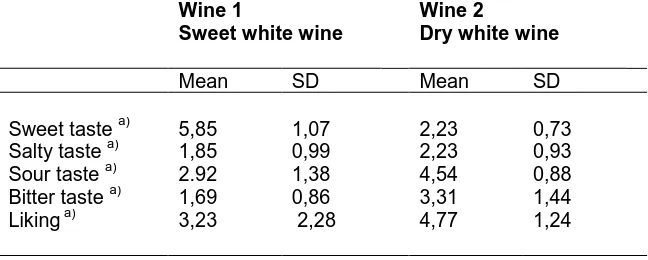
[image:16.595.136.460.333.463.2]The first pre-test was conducted to measure the taste of the wines that were used in the main study. This pre-test was an online questionnaire, which was filled in by guests at a restaurant. The pre-test did not contain colored lighting (only daylight) and music. 15 participants in total tasted a medium-sweet white wine and a dry white wine (consult Appendix1. for wine specifications), rating them on sweetness, sourness, bitterness and saltiness on a scale from 1 (not at all) to 7 (very). Participants also rated how much they liked the taste of the wine on a scale from 1 (not at all) to 7 (very). There were 15 participants in total. In Table 2 the results of pre-test 1 are shown. The dry white wine was liked the most (M=4,77, SD=1,24).
Table 2.
Scores on the basic tastes for the sweet and dry white wine. Wine 1
Sweet white wine
Wine 2
Dry white wine
Mean SD Mean SD
16 3.2 Pre-test 2
[image:17.595.99.488.293.426.2]To test music-color congruence, a second pre-test was performed. This pre-test was an online survey, which was distributed via WhatsApp. 32 participants in total had to listen to four soundtracks which where cross modally designed. The first two songs were Sour and Sweet by Mesz, Sigman and Trevisan (2012). The second two songs were Sweet and Sour by Condiment Junkie (See Appendix 2 for music specifications). Participants answered the question ‘Which of the basic tastes matches with the soundtrack’, and could choose between sweet, sour, salt and bitter. In Table 3, the results for the music-taste correspondence are shown. The song Sweet by Condiment Junkie was matched mostly with the basic taste sweet and therefore chosen for the main study. The song Sour by condiment Junkie was matched mostly with Sour and therefore also chosen for the main study.
Table 3.
Number of times a basic taste was matched with a song. Music-Taste
Sweet Sour Salt Bitter Sour by Mesz, Sigman and
Trevisan (2012)
10 17 3 2
Sweet by Mesz, Sigman and Trevisan (2012)
10 1 9 12
Sweet by Condiment Junkie 21 5 5 1 Sour by Condiment Junkie 1 18 4 9
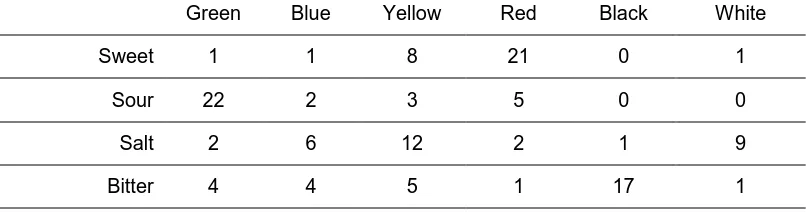
After the musical part, participants had to match colors with basic tastes. Participants had to match saltiness, bitterness, sourness and sweetness with a color. They could choose between green, blue, yellow, red, black and white. In Table 4 the results of the taste-color correspondence are presented. As shown in Table 4, the results strengthen the assumptions based on literature: sweetness is most often matched with the color red, and sourness with the color green.
Table 4.
Number of times a basic taste was matched with a color.
Taste-Color
Green Blue Yellow Red Black White
Sweet 1 1 8 21 0 1
Sour 22 2 3 5 0 0
Salt 2 6 12 2 1 9
[image:17.595.92.495.607.713.2]17 3.3 Design and stimulus materials
A 2 (‘sweet’ music vs. ‘sour’ music) x 2 (red lighting vs. green lighting) x 2 (low SRD vs. high SRD) experimental study was conducted to answer the main question and test the
hypotheses. The wine types used during the experiment were a sweet and dry white wine. The stimulus materials were a consonant, legato and high pitched song called ‘Sweet’ and a dissonant, legato and high pitched song called ‘Sour’ by Condiment Junkie. These
soundscapes are designed for crossmodal purposes. For example, Crisinel et al. (2012) used the soundscapes ‘Bitter’ and ‘Sweet’ to enhance these tastes in a bittersweet toffee. The other stimuli were the colored lighting conditions in the room. The room had several recessed spotlights in the ceiling, which were covered with translucent foil in the colors red or green.
3.4 Procedure
The field experiment was performed at Fellini, a restaurant and bar in Enschede. A part of the restaurant was reserved for the experiment. The room had a wooden floor, wooden tables and yellow fabric chairs (see Appendix 3 for pictures of the experiment room). On the table there was a paper questionnaire, some pens and a glass filled with ground coffee. The dry and sweet wines where served in a transparent wine glass. There were four experimental conditions:
● Tasting sweet and dry white wine in a congruent room with high pitched, consonant and legato music (sweet music) and red lighting.
● Tasting sweet and dry white wine in an incongruent room with high pitched, dissonant and legato music (sweet music) and red lighting.
● Tasting sweet and dry white wine in a congruent room with high pitched, dissonant and legato music (sour music) and green lighting.
● Tasting sweet and dry white wine in an incongruent room with high pitched, consonant and legato music (sour music) and green lighting.
Restaurant guests were invited to the experiment. The number of participants which were present in the experiment room variated between 1 and 8 participants. The ambient music, ambient lighting and wine that belonged to the experiment condition were present when the participants entered the room. Before starting, participants had to show identification. In The Netherlands, it is allowed to drink alcohol from the age of 18. The participants were asked to sit on the chair in front of the paper questionnaire. They could read the introduction and informed consent of the experiment. If they agreed, they could started with filling in the questionnaire using a pen or pencil (See Appendix 5 for the complete questionnaire used during the experiment).
18
the taste of the wine. These question were identical to the questions of the first tasting round. When they completed the second tasting round, the wine tasting ended. The questionnaire continued with questions about room design. Participants could fill in on a 7 point Likert-scale whether they agreed or disagreed with statements about room design. Eventually, there were some questions that concerned personal details. Participants could fill in their age, gender and nationality. When participants finished the questionnaire, they left the experiment room.
3.5 Participants
All the participants were guests of the restaurant Fellini in Enschede. Participants who sat at a table or entered the room were asked if they wanted to participate in a wine-tasting study. This means that participants were recruited by convenience sampling, which is a type of non-random sampling where the participants are chosen based on practical criteria, such as availability or proximity (Etikan, Musa, & Alkassim, 2016).
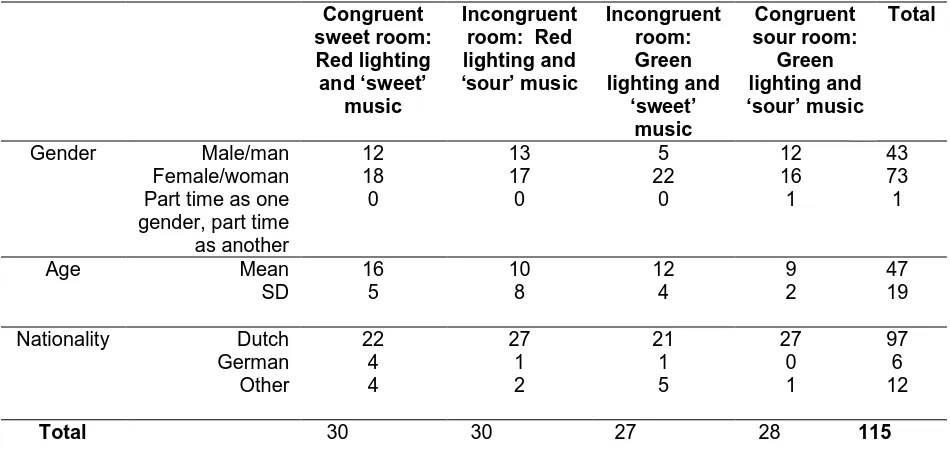
[image:19.595.65.540.374.603.2]In total, there were 115 participants. Condition 1 and 2 had 30 participants, condition 3 27 participants and condition 4 28 participants. There were 120 completed questionnaires, but incomplete questionnaires are left out of the analysis. Participants were asked to fill in their age, gender and nationality. The details of the participants are shown in Table 5.
Table 5.
Number of participants based on condition, age, gender and nationality. Congruent sweet room: Red lighting and ‘sweet’ music Incongruent room: Red lighting and ‘sour’ music Incongruent room: Green lighting and ‘sweet’ music Congruent sour room: Green lighting and ‘sour’ music Total
Gender Male/man 12 13 5 12 43
Female/woman 18 17 22 16 73
Part time as one gender, part time as another
0 0 0 1 1
Age Mean 16 10 12 9 47
SD 5 8 4 2 19
Nationality Dutch 22 27 21 27 97
German 4 1 1 0 6
Other 4 2 5 1 12
19 3.6 Measures
Basic taste of wine
To measure the taste of the white wine, different instruments were used. First, participants had to rate the sweetness, sourness (acidity), bitterness and saltiness of the wine on a Likert-scale from 1 (not at all) to 7 (very much).
Wine attributes
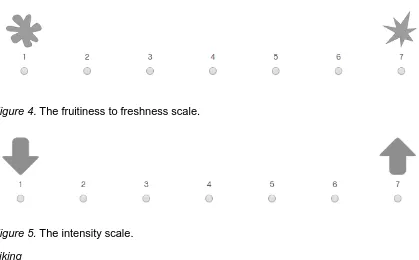
To measure the level of intensity and fruitiness/freshness of the wine, an instrument by Spence, Velasco, and Knoeferle (2014) was used. Wine can be described in levels of fruitiness (more sweet) and freshness (more sour) and in level of intensity (low or high). These terms seem understandable for social drinkers (excluding wine connoisseur language). Participants could rate the wine on a scale from fruity (1) to fresh (7) and from intensity low (1) to high (7).
[image:20.595.78.497.360.620.2]Images were used to complement these terms. Fruitiness was complemented with a round shape, while freshness was shown with an angular shape (Figure 4). Low intensity was combined with an arrow pointing down, and high intensity was complemented with an arrow pointing down (Figure 5).
Figure 4. The fruitiness to freshness scale.
Figure 5. The intensity scale. Liking
To test how much participants liked the wine, a question used in the study of Spence, Velasco, and Knoeferle (2014) was used. On a scale from 1 (not at all) to 7 (very much) participants had to indicate how much they liked the wine. ‘Not at all’ was complemented with an image of a hand with a thumb down, and ‘very much’ with an image of a hand with
20 Figure 6. The liking scale
Sensitivity to Room Design
To measure differences in levels of SRD, the Centrality of Visual Product Aesthetics (CVPA) questionnaire by Bloch, Brunel and Arnold (2003) was used. The questionnaire originally focused on product design, but it was transformed into a questionnaire about room design. For example, the statement ‘Owning products that have a superior design makes me feel good about myself’ was changed to ‘Being in a place with a superior design makes me feel good about myself’. In Appendix 4, the original and altered statements can be found. The construct SRD consisted out of 11 items. The original scale of the CVPA is a 5-point Likert scale. The scale of SRD was changed to a 7-5-point Likert-scale to facilitate the analysis. On the scale, participants could indicate whether they not at all (1) or very much (7) agreed with the statement. A high score on the construct represents a high sensitivity to design. Eventually, groups were made using a median split in SPSS. One group was labeled as not-sensitive to room design, and the other group as being sensitive to room design. In Table 6, the reliability of the construct SRD is shown.
Table 6.
Computed Cronbach´s Alfa for the construct SRD.
Construct Cronbach’s Alfa Number of items Items removed
Room design .85 11 0
Covariates: degree of hunger and culture
[image:21.595.67.516.481.511.2]21 Additional questions
At the end of the questionnaire, personal information was asked. Participants could fill in their age in a text entry. To indicate gender, participants could choose between ´male/man´, ´female/woman´, ´part time as one gender, part time as another´, and ´a gender not listed here, please specify´. If participants chose the last option, they could fill in their gender in a text entry.
3.7 Analyses
22
4. Results
The aim of this research was to examine the effects of the independent variables ambient lighting and ambient music and the moderator SRD on the taste of two wines: a sweet and dry white wine. More specific, the dependent variables were sweet, sour, bitter and salty taste, fruitiness and freshness of the wine, and liking of the taste of the wine. To test the main and interaction effects and the hypotheses, a multivariate analysis of variance (MANOVA) was performed for both of the wines.
First, the main effects of the independent variables will be given. Then, the effects of the independent variables on the taste and liking of the sweet white wine and dry white wine will be discussed separately. The interaction effects of the dependent variables will also be discussed separately for each wine.
4.1 Main effects
23
4.2 Effects of the independent variables on sweet white wine
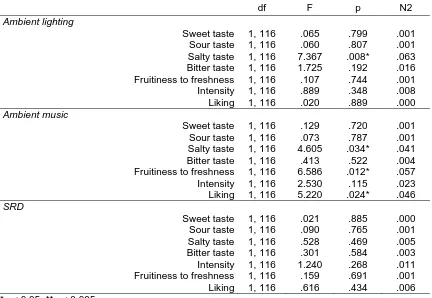
[image:24.595.71.503.228.526.2]In Table 7, the results of the MANOVA of the sweet white wine are shown. Ambient music significantly influenced the salty taste of the sweet white wine (F(1,116)=.4.605, p=.034, partial eta squared=.041), the fruitiness/freshness of the wine (F(1,116)=6.586, p=.012, partial eta squared=.057) and liking of the wine (F(1,116)=5.220, p=.024, partial eta squared=.046). Ambient lighting also significantly influenced salty taste of the sweet white wine (F(1,116)=7.367, p=.008, partial eta squared=.063).
Table 7.
Results of the multivariate analysis of variance of the independent variables for the sweet white wine.
df F p N2
Ambient lighting
Sweet taste 1, 116 .065 .799 .001 Sour taste 1, 116 .060 .807 .001 Salty taste 1, 116 7.367 .008* .063 Bitter taste 1, 116 1.725 .192 .016 Fruitiness to freshness 1, 116 .107 .744 .001 Intensity 1, 116 .889 .348 .008 Liking 1, 116 .020 .889 .000
Ambient music
Sweet taste 1, 116 .129 .720 .001 Sour taste 1, 116 .073 .787 .001 Salty taste 1, 116 4.605 .034* .041 Bitter taste 1, 116 .413 .522 .004 Fruitiness to freshness 1, 116 6.586 .012* .057 Intensity 1, 116 2.530 .115 .023 Liking 1, 116 5.220 .024* .046
SRD
24
In Table 8, the scores given on the different taste aspects of the sweet white are shown, divided by ambient lighting color. A significant difference in saltiness of the sweet white wine was found between the ambient lighting colors. The sweet white wine tasted saltier when red lighting was present (M=2.32, SD=1.16), compared to the saltiness when green ambient lighting was present (M=1.79, SD=0.88).
Table 8.
Mean scores given on the different taste aspects of the sweet white wine, divided by lighting. Wine 1
Sweet white wine
Mean SD
Red lighting Sweet taste 5.20 1.27
Salty taste 2.32 1.16 Sour taste 2.85 1.25 Bitter taste 2.23 1.35 Fruitiness to freshness 3.93 1.59
Liking 4.62 1.85
Intensity 3.60 1.49 Green lighting
Sweet taste 5.12 1.27 Salty taste 1.79 0.88 Sour taste 2.79 1.28 Bitter taste 1.96 0.93 Fruitiness to freshness 3.91 1.65
Liking 4.68 1.90
25
In table 9, the scores given on the different taste aspects of the sweet white wine are shown, divided by ambient music type. Significant differences were found for salty taste, fruitiness to freshness and liking.
Sweet white wine tasted saltier with the presence of sweet ambient music (M=2.24, SD=1.03), compared to the saltiness of the wine with sour ambient music (M=1.88,
[image:26.595.65.414.288.514.2]SD=1.56). The wine tasted fresher with the presence of sweet ambient music (M=4.26, SD=1.62) compared to the freshness of the wine with sour ambient music (M=3.59, 1.55). Sweet white wine was liked more with the presence of sweet ambient music (M=5.03. SD= 1.86), compared to liking of the wine with sour ambient music (M=4.27, 1.80)
Table 9.
Mean scores given on the different taste aspects of the sweet white wine, divided by music.
Wine 1
Sweet white wine
Mean SD
Sweet music Sweet taste 5.21 1.29
Salty taste 2.24 1.03 Sour taste 2.84 1.18 Bitter taste 2.17 1.17 Fruitiness to freshness a) 4.26 1.62
Liking 5.03 1.86
Intensity 3.95 1.56 Sour music
Sweet taste 5.12 1.25 Salty taste 1.88 1.07 Sour taste 2.80 1.34 Bitter taste 2.03 1.16 Fruitiness to freshness 3.59 1.55
Liking 4.27 1.80
26
4.3 Effects of the independent variables on dry white wine
[image:27.595.73.502.215.515.2]In Table 10, the results of the MANOVA of the dry white wine are shown. Ambient lighting significantly influenced sweet taste (F(1,116)=4.01, p=.048, partial eta squared=.035), sour taste (F(1,116)=4.061, p=.046, partial eta squared= .036) and bitter taste of the dry white wine (F(1,116)=4.788, p=.031, partial eta squared=.042).
Table 10.
Results of the multivariate analysis of variance of the independent variables for dry white wine.
df F p N2
Ambient lighting
Sweet taste 1,116 4.008 .048* .035 Sour taste 1,116 4.061 .046* .036 Salty taste 1,116 2.907 .091 .026 Bitter taste 1,116 4.788 .031* .042 Fruitiness to freshness 1,116 .396 .530 .004 Intensity 1,116 1.164 .283 .011 Liking 1,116 .747 .389 .007
Ambient music
Sweet taste 1,116 2.673 .105 .024 Sour taste 1,116 .512 .476 .005 Salty taste 1,116 3.110 .081 .028 Bitter taste 1,116 .014 .906 .000 Fruitiness to freshness 1,116 .269 .605 .002 Intensity 1,116 1.292 .258 .012 Liking 1,116 .585 .446 .005
SRD
27
In table 11, the scores given on the different taste aspects of the dry white wine are shown, divided by ambient lighting color. A significant difference between the red and green lighting groups were found for the bitterness, sweetness and sourness of the dry white wine.
The wine tasted more bitter with presence of red ambient lighting (M=3.97, SD=1.40) compared to the bitterness of the wine with green ambient lighting (M=3.44, SD=1.65). The dry white wine tasted more sweet with presence of red ambient lighting (M=2.63, SD=1.30), compared to the sweetness with presence of green ambient lighting (M=2.18, SD=1.12). Also, the wine tasted more sour with red ambient lighting (M=4.27, SD=1.52), compared to the sour taste of the wine with green lighting (M=3.67, SD=1.67).
Table 11.
Mean scores given on the different taste aspects of the dry white wine, divided by lighting. Wine 2
Dry white wine
Mean SD
Red lighting Sweet taste 2.63 1.30
Salty taste 2.90 1.36 Sour taste 4.27 1.52 Bitter taste 3.97 1.40 Fruitiness to freshness 4.07 1.39
Liking 3.60 1.69
Intensity 4.33 1.48 Green lighting
Sweet taste 2.18 1.12 Salty taste 2.47 1.34 Sour taste 3.67 1.67 Bitter taste 3.44 1.65 Fruitiness to freshness 3.89 1.38
Liking 3.84 1.68
28
[image:29.595.64.412.177.405.2]In Table 12, the scores given on the difference taste aspects of the dry white wine are shown, divided by ambient music. No significant differences caused by ambient music type were found.
Table 12.
Mean scores given on the different taste aspects of the dry white wine, divided by music. Wine 2
Dry white wine
Mean SD
Sweet music Sweet taste 2.22 1.17
Salty taste 2.91 1.52 Sour taste 3.93 1.74 Bitter taste 3.74 1.66 Fruitiness to freshness a) 3.91 1.41
Liking 3.59 1.64
Intensity 4.05 1.48 Sour music
Sweet taste 2.59 1.27 Salty taste 2.47 1.15 Sour taste 4.02 1.50 Bitter taste 3.68 1.43 Fruitiness to freshness a) 4.05 1.37
Liking 3.85 1.72
Intensity 4.39 1.40 a) Reported on a scale from 1 to 7 (fresh/fruity)
Based on the results of the effects of the independent variables ambient music and ambient lighting, hypotheses h1a, h1b, h2a and h2b are rejected for both the sweet and dry white wine.
H1a: ‘Participants experience a sweeter taste of white wine with red ambient lighting compared to participants who taste white wine with green ambient lighting’ is
rejected.
H1b: ‘Participants experience a more sour taste of white wine with green ambient lighting compared to participants who taste white wine with red ambient lighting’ is rejected.
H2a: ‘Participants who drink white wine while listening to high pitched, consonant and legato music (sweet music) experience a sweeter taste than participants who drink white wine while listening to high pitched, dissonant and staccato music (sour music)’ is rejected.
29 4.4 Interaction effects on sweet white wine
The main interaction effects of ambient lighting, ambient music and SRD on the dependent variables sweet, sour, salty and bitter taste, fruitiness and freshness, intensity and for the sweet and dry white wine were analyzed by means of a multivariate analysis of variance (MANOVA). Wilks’ Lamba revealed a significant interaction effect between music and lighting (F=.262, p=.010).
In Table 13, the interaction effects of ambient lighting, ambient music and SRD for the sweet white wine are presented. The combination of ambient lighting and ambient music had a significant effect on sour taste (F(1,116)=4.536, p=.035, partial eta squared=.040), salty taste (F(1,116)=4.559, p=.035, partial eta squared=.040) and fruitiness to freshness
[image:30.595.68.502.296.696.2](F(1,116)=10,483, p=.002, partial eta squared=.088). The nature of these interaction effects are shown in Figure 7.
Table 13.
Interaction effects of the independent variables of wine 1 (sweet white wine)
df F p N2
Ambient lighting * ambient music
Sweet taste 1,116 .030 .863 .000 Sour taste 1,116 4.536 .035* .040 Salty taste 1,116 4.559 .035* .040 Bitter taste 1,116 .009 .924 .000 Fruitiness to freshness 1,116 10.483 .002** .088 Intensity 1,116 2.415 .123 .022 Liking 1,116 1.877 .174 .017
Ambient lighting * SRD
Sweet taste 1,116 .091 .764 .001 Sour taste 1,116 .011 .916 .000 Salty taste 1,116 3.327 .071 .030 Bitter taste 1,116 .000 .999 .000 Fruitiness to freshness 1,116 .193 .661 .002 Intensity 1,116 .317 .575 .003 Liking 1,116 .781 .379 .007
Ambient music * SRD
Sweet taste 1,116 .329 .568 .003 Sour taste 1,116 .006 .936 .000 Salty taste 1,116 1.704 .194 .015 Bitter taste 1,116 .452 .503 .004 Intensity 1,116 .043 .835 .000 Fruitiness to freshness 1,116 3.713 .057 .033 Liking 1,116 .948 .332 .009
Ambient lighting * ambient music * SRD
30
Figure 7. Interaction effects of ambient music and lighting on sour taste, salty taste and fruitiness to freshness of the sweet white wine.
2.50 2.60 2.70 2.80 2.90 3.00 3.10
Sweet music Sour music
Sour taste
Red lighting Green lighting
1 1.2 1.4 1.6 1.8 2 2.2 2.4
Sweet music Sour music
Salty taste
Red lighting
Green lighting
3.00 3.50 4.00 4.50 5.00
Sweet music Sour music
Fruitiness to freshness
31
As shown in Figure 7, sweet white wine tastes more sour with the presence of incongruent ambient music and ambient lighting (sour music and red lighting, sweet music and green lighting), compared to the sourness of the wine with the presence of congruent music and ambient lighting (sweet music and red lighting, sour music and red lighting). This result contradicts hypothesis 3b.
H3b: ‘Participants who drink dry white wine in a room with green lighting and high pitched, dissonant and staccato music (sour music) experience a more sour taste than participants who drink dry white wine in a room with red lighting and high pitched, consonant and legato music (sweet music)’ is rejected.
As shown in Figure 7, saltiness of the sweet white wine was affected by green ambient lighting. Green ambient lighting in combination with sour ambient music made the sweet white wine taste less salty compared to green ambient lighting in combination with sweet ambient music. In the red lighting groups, the level of saltiness of the sweet white wine is experienced as almost similar.
32 4.5 Interaction effects on dry white wine
[image:33.595.66.503.245.634.2]In Table 14, the interaction effects of the independent variables ambient lighting, ambient music and SRD on sweet, sour, salty and bitter taste, fruitiness to freshness, intensity and liking of the dry white wine are presented. An interaction effect of ambient lighting and ambient music on liking of the dry white wine is found (F(1,109)=4.702, p=.032, partial eta squared=.041). Also, an interaction effect between ambient lighting and SRD on sour taste is found (F(1,109)=7.073, p=.009, partial eta squared=.061). Bitter taste is significantly influenced by an interaction effect between ambient music and SRD. The nature of these interaction effects are shown in Figure 5, 6 and 7.
Table 14.
Interaction effects of the independent variables of wine 2 (dry white wine).
df F p N2
Ambient lighting * ambient music
Sweet taste 1,116 1.254 .265 .011 Sour taste 1,116 .112 .738 .001 Salty taste 1,116 .174 .667 .002 Bitter taste 1,116 .893 .347 .008 Fruitiness to freshness 1,116 .074 .786 .001 Intensity 1,116 .630 .429 .006 Liking 1,116 4.702 .032* .041
Ambient lighting * SRD
Sweet taste 1,116 .131 .718 .001 Sour taste 1,116 7.073 .009* .061 Salty taste 1,116 .265 .608 .002 Bitter taste 1,116 1.423 .235 .013 Fruitiness to freshness 1,116 .002 .967 .000 Intensity 1,116 .002 .961 .000 Liking 1,116 .011 .918 .000
Ambient music * SRD Sweet taste 1,116 .134 .715 .001
Sour taste 1,116 .251 .618 .002 Salty taste 1,116 .001 .970 .000 Bitter taste 1,116 5.878 .017* .051 Fruitiness to freshness 1,116 .005 .945 .000 Intensity 1,116 2.447 .121 .022 Liking 1,116 .350 .556 .003
Ambient lighting * ambient music * SRD Sweet taste 1,116 .154 .696 .001
33
Figure 8. Interaction effect of ambient music and lighting on liking of the dry white wine. In Figure 8, the interaction effect of ambient music and ambient lighting on liking of the dry white wine is shown. With presence of sweet music and red lighting, dry white wine was liked less compared to liking with a combination of sweet music and green lighting. For sour music, dry white wine was liked more with sour music and red lighting compared to the liking with sour music and green lighting. This shows that the dry white wine is liked more with incongruent ambient music and ambient lighting (sweet music and green lighting, sour music and red lighting). These results reject hypotheses h4a and h4b.
● H4a: ‘Participants who drink white wine in a room with red lighting and high pitched, consonant and legato music (sweet music) like the wine more than participants who drink white wine in a room with red lighting and high pitched, dissonant and staccato music (sour music)’ is rejected.
● H4b: ‘Participants who drink white wine in a room with green lighting and high pitched, dissonant and staccato music (sour music) like the wine more than participants who drink white wine in a room with green lighting and high pitched, consonant and legato music (sweet music)’ is rejected.
3.00 3.50 4.00 4.50
Sweet music Sour music
Liking
34
Figure 9. Interaction effect of ambient lighting and SRD on salty taste of the dry white wine. Figure 9 presents the interaction effect between ambient lighting and SRD on salty taste of the dry white wine. Dry white wine tasted the most salty for participants with low SRD when red ambient lighting was present. Dry white wine tasted the least salty for participants with low SRD when green ambient lighting was present.
Figure 10. Interaction effect of ambient music and SRD on bitter taste of the dry white wine. In Figure 10, the interaction effect of ambient music and SRD on bitter taste of the dry white wine is presented. Low SRD in combination with sweet ambient music made dry white wine taste less bitter, while high SRD in combination with sweet ambient music made the wine taste more bitter. For sour music, the opposite is visible. Participants with low SRD rated the wine as more bitter with presence of sour ambient music, while participants with high SRD rated the wine as less bitter with presence of sour ambient music.
3.00 3.50 4.00 4.50 5.00
Low SRD High SRD
Salty taste
Red lighting Green lighting
3.00 3.50 4.00 4.50
Low SRD High SRD
Bitter taste
35
Remaining are hypotheses h3a, h5a, h5b and h5c, which are all not supported by the results. ● H3a: ‘Participants who drink sweet white wine in a room with red lighting and high
pitched, consonant and legato music (sweet music) experience a sweeter taste than participants who drink sweet white wine in a room with green lighting and high pitched, dissonant and staccato music (sour music)’ is rejected.
36
5. Conclusion and discussion
The goal of this experiment was to examine the effects of room design on taste experience and liking of wine. More specific, the effect of colored lighting, music and sensitivity to room design (SRD) on the taste of a dry and a sweet white wine were examined. An experiment with four different music and lighting conditions was performed to examine several
hypotheses. While the hypotheses are rejected, several other significant effects were found. These effects indicate that room design does influence different taste aspects of white wine. Sweet white wine tastes saltier with presence of red ambient lighting, and also with presence of sweet ambient music. Besides, sweet white wine tastes fresher and is liked more with the presence of sweet ambient music. Dry white wine tastes more bitter, sour and sweet with presence of red ambient lighting. Ambient music did not have any effect on the taste of the dry white wine.
Moreover, several interaction effects were found. Sweet white wine tastes more sour with the presence of incongruent ambient music and ambient lighting. A ‘sour room’ makes sweet white wine less salty and more fruity. Dry white wine is liked more in incongruent room designs. High SRD in combination with green ambient lighting makes dry white wine taste more salty. High SRD in combination with sweet music makes dry white wine taste more bitter, and high SRD in combination with sour music makes dry white wine taste less bitter. No three way interaction effects between ambient lighting, ambient music and SRD were found.
Ambient lighting
The first aim of the research was to find separate effects of ambient lighting, ambient music and SRD. Ambient lighting did not show a significant main effect. Ambient lighting did influence the taste of the sweet and dry white wine, but not as expected. While previous research suggests that the color green is associated with the taste of sourness (Wan et al., 2014), green ambient lighting did not significantly influence sour taste in the present
experiment. Red ambient lighting is associated with sweetness (Oberfeld, Hecht, Allendorf, & Wickelmaier, 2009). In the present experiment, red ambient lighting also made the dry white wine taste more sweet. Only, also the bitter and sour taste of the dry white wine were emphasized by red ambient lighting. A possible explanation is that red colored lighting gave a surprise effect. The color red gave the expectation of sweet taste, while in general, dry white wine is considered as more bitter or sour. This difference between expectation and reality may emphasized the bitter and sour taste of the dry white wine.
Sweet white wine tasted saltier with presence of red ambient lighting. A possible explanation for this effect is the difficulty to determine the level of saltiness of the sweet white wine. During the experiment, multiple participants reacted surprised when this question came up. Sweet white wine is often not described as salty, so this may have caused the
37 Ambient music
Ambient music did not show a significant main effect. Ambient music did influence the taste of the wines, but not as expected. ‘Sour’ and ‘sweet’ music did not have any effect on the basic tastes sweet and sour, while previous research suggests the opposite (Crisinel et al., 2012). Sweet white wine tasted more salty when sweet ambient music is present. Sweet music is high pitched, consonant and legato. Salty music is medium pitched, dissonant and legato. That is the opposite of a sweet soundscape. Therefore, it seems unlikely that music triggered salty taste. It seems more likely that again, it was difficult to determine the saltiness of the sweet white wine. Therefore, there was a lot of difference between the scores on saltiness, which may have caused the significant effect.
Sweet white wine tasted more fruity with presence of sour ambient music. A fruity taste often linked to sweetness, while a fresh taste can be linked to sourness. The enhanced fruitiness may be caused by again a pleasant surprise. The wine taster expected a more fresh taste because of the sour music, but they tasted a more fruity and sweet white wine. Therefore, the fruitiness of the wine stood out, which made the scores on fruitiness higher. The sweet white wine was liked the most with presence of sweet ambient music. An explanation for this can be congruence of the music with type of wine. Sweet wine matches with sweet music, which can enhance liking of a product (Krishna, Elder, & Caldara, 2010). SRD
One of the aims of this research was to find effect of personal characteristics on taste experience. For this experiment, a new variable was created: Sensitivity to Room Design (SRD). SRD is based on another variable, the centrality of (visual) product aesthetics (CVPA). The CVPA assumes that the importance of aesthetics differ per person and influence how a product is experienced (Bloch, Brunel, & Arnold, 2003). In the present experiment, SRD did not have influence on the wine experience in terms of taste. This may indicate that sensitivity to room design does not influence how drinks are experienced. Ambient music and ambient lighting
In this research, the main focus was to find interaction effects between ambient music and ambient lighting. A significant interaction effect between ambient music and ambient lighting was found. Previous research shows that the combination of music and colored lighting can influence the taste of wine (Spence, Velasco, & Knoeferle, 2014). Also in the present experiment, ambient lighting and ambient music showed several significant effects. The combination of ambient lighting and ambient music influences the sour taste of sweet white wine. It was expected that the combination of two congruent sour stimuli, green lighting and ‘sour’ music, would evoke a more sour taste than for example a incongruent room design with green lighting and ‘sweet’ music. The experiment showed the opposite result. Wine tastes more sour in the incongruent conditions (‘sweet’ music and green lighting, ‘sour’ music and red lighting) compared to the congruent conditions (‘sweet’ music’ and red lighting, ‘sour’ music and green lighting).
38
Green lighting (in combination with sour music) made the dry white wine taste less bitter. Sour ambient music made the sweet white wine taste less salty. Also the combination of green lighting and sour music made the sweet white wine taste less salty. A possible explanation for the effects on salty taste is already given. It may be difficult to determine levels of saltiness in white wine.
There is another possible explanation, which focuses on the effects of sour music and green ambient lighting. Sour music is high pitched dissonant and staccato. Research shows that bitter soundscapes have a medium to low pitch and are consonant and legato, and salty soundscapes have a medium pitch, mostly dissonant harmony and staccato articulation (Wang, Woods, & Spence, 2015). In short, music that can evoke salty or bitter taste, are different compared to or maybe even the opposite of a sour soundscape. The sour
soundscape was complemented by green lighting. Therefore, it evoked a strong association with sourness. This association with sourness was so strong that it dominated the taste, and therefore reduced the bitter and salty notes in the taste of both wines.
Incongruence and wine type
Some literature suggests that congruence can influence liking of a product positively
(Krishna, Elder, & Caldara, 2010), while other literature suggest that moderate incongruence can influence liking (Havermans & Hendriks, 2019). In the present study, incongruent
elements in a room design enhanced liking. Dry white wine is liked more in the incongruent conditions, compared to the congruent conditions. This may be due to incongruence between wine type and room design elements.
A possible explanation for the positive effect of incongruence on liking is already mentioned before: it is a pleasant surprise. Incongruence can be experienced as pleasant, and can deliver an enjoyable experience if it is purposefully designed in that way and executed in an optimal way (Velasco et al., 2016). A complete ‘sour’ room is congruent with the taste of a dry white wine. If you expect sour, and the wine also tastes sour or acid, there may not be much arousal or surprise. In a design where there is also a ‘sweet’ element, the expectation of taste is different and therefore can create a surprise that is experienced as pleasant.
The dry white wine was not liked more in the sweet room, while this is also
incongruent with the wine type. It may be the case that this level of incongruence between wine type and room design is too high. Incongruence may turn out positively if it is moderate (Havermans & Hendriks, 2019). If the room design contains a congruent sour element and an incongruent sweet element, this possibly gives the right amount of incongruence. Again, the combination of incongruent ‘taste stimuli’ creates a different expectation of taste. The actual taste of the wine may give a pleasant surprise, which increases liking.
39 5.1 Limitations
This experiment should be read within its limitations. As mentioned before, this research was not performed in an experimental room. Experimental rooms often have a neutral interior with a minimal amount of other stimuli that can influence the senses. The designed rooms used in this study were part of a restaurant. There were sounds, lighting, smell and visual stimuli in the room that were not part of the manipulation, such as restaurant sounds, smell of food, colored interior and much more. All these stimuli may have influenced the results.
Restaurant guests were asked to participate in the research. Some guests already had a drink or some food just before the experiment. Some participants may have been under the influence of alcohol. Other participants ate or drank something else before participating. The taste in their mouth or their satiety may have influenced the results. Taste is a very personal experience. In the questionnaire, taste is standardized on a scale from 1 to 7. It is not said that participants experience taste on a scale from 1 to 7, and that they all experience this in the same way. Taste is also cultural. The results of this experiment may have been different if it was performed outside Europe or even The Netherlands.
In this experiment, no effect of SRD was found. It may be the case that SRD does not have influence on the taste of wine and the influence of room design. Another explanation for the absence of effect can be the instrument used to measure SRD. The CVPA questionnaire was adjusted in terms of room design and used to measure SRD. The statements were slightly adjusted. These adjustments can be enough to make the questionnaire invalid. It may be the case that this questionnaire did not measure SRD adequately, and therefore did not show significant effects.
40
6. Practical recommendations and implications for future research
Restaurant, café or wine tasting owners should or can consider every aspect of their space when designing a room. The color of lighting and the music in the background can influence the taste of a wine. More broad, the human senses are all involved while tasting, and how the senses are stimulated depends on the design.
This experiment shows that the match or congruence between stimuli used in a multisensory experience needs to be considered. When talking about taste, congruence does not always lead to improved evaluations. As shown in this experiment, incongruence can even lead to more positive evaluations of taste compared to congruence. Future
research can explore the use of incongruence more, as it is still unknown how large this level of (in)congruence can be. In this study, the incongruence probably served as a pleasant surprise, but there may be a point where it becomes an unpleasant surprise. It may be that the type of wine also has influence on how the stimuli are received. As also is shown in this experiment, specific music and lighting may have a different effect on red wine compared to the effect on white wine. Wine type should also be considered more in a future study. If a restaurant or wine tasting event wants to use colored lighting and music to influence wine tasting, it can be recommended that they use one stimuli that matches with the taste of the wine, and one that does not match. For example, when they use a red wine, they can have a ‘salty’ soundscape in combination with yellow lighting. The ‘salty’ song may not be congruent with the taste of the red wine, but yellow is associated with sour taste. In this way, the incongruence of the stimuli may create a pleasant surprise.
Experimental rooms often have a neutral interior with a minimal amount of other stimuli that can influence the senses. While this technique can measure the effects of the manipulations more precisely, it does not give a realistic or practical view on the effects. When researching multisensory experiences, it should be important to consider all the influences that are present in real life situations. Scientist do agree that multisensory taste experiences can be influenced by all the senses, but in studies, they diminish external influences by performing a multisensory experience in an experimental room. The results in the present study contradicts results from former studies performed in experimental rooms. Future research should be performed more in realistic settings, as these results give a more realistic results and therefore are more usable for real life settings such as restaurants. While this study does not show effect of SRD, it is important that personal differences within the field of multisensory taste experiences are considered and studied. Every
individual experiences taste differently, and therefore it is important to create and study more tangible, measurable differences.