Master
Master thesis, Industrial Engineering and Management
Improving the waste collection
planning of Amsterdam
Author
W.J.P Heijnen
w.j.p.heijnen@student.utwente.nl
Committee of supervisors
Dr.ir. M.R.K. MesDr.ir. E.A. Lalla
University of Twente, dep. Industrial Engineering and Business Information Systems
H. Palm
DAT.Mobility, CS Conculting
Ing. A.H. Oldenburger
Goudappel Coffeng, MD Mobiliteitsdiensten
1
Management summary
Introduction
This research is conducted at the Goudappel Group, where it is part of a project initiated by the
municipality of Amsterdam. Amsterdam’s motivation for this project is to improve the performance of its waste collection planning. The waste collection of Amsterdam involves the collection of the waste generated by its 854 thousand inhabitants. The scope of this research is limited to the waste collected from underground containers, of which there are 12.000 scattered over Amsterdam.
The goals of the municipality of Amsterdam are to reduce the total collection costs, distance driven, and improve the service level to its inhabitants. The current planning methodology, which is based on fixed, static schedules and emptying frequencies, is unsuitable for the stochastic and dynamic demand for waste collection. Accordingly, the main research question of this research is: in which way and to what degree can the waste collection planning of Amsterdam be improved by using dynamic scheduling algorithms?
The main research question is answered by analyzing the characteristics of the waste collection system of Amsterdam, reviewing existing literature to find related problems, proposing a new solution approach based on the findings of the literature review, and evaluating its performance on the waste collection planning of Amsterdam to formulate recommendations for the municipality.
Waste collection in Amsterdam
The logistical chain that is set up in Amsterdam to collect its waste consists of four types of locations: (1) containers, used to collect waste, (2) wharfs, which function as a base for collection operations, and two types of disposal facilities where collection vehicles can dispose the waste they collected: (3) satellite facilities and (4) waste processing facilities.
During the planning of the waste collection, decision makers should make two decisions: when to empty which container and how to combine these containers into vehicle routes. This problem most closely resembles the theoretical Inventory Routing Problem (IRP).
Proposed solution approach
To solve this problem, this thesis proposes a novel solution approach that consists of three phases that are executed on a rolling horizon:
1. Container selection, where containers that are expected to be relevant within the pre-determined planning horizon are selected.
2. Day assignment, where the selected containers are assigned to days of the planning horizon. 3. Route construction, where routes are constructed to collect all assigned containers.
The main focus of this research on the second phase, where a novel method is proposed to consider both the time and space dimensions of the IRP. These dimensions are important to consider simultaneously, as decisions in one dimension influence and restrict the possible decisions in the other dimension.
2
Experiment results
To evaluate the performance of the proposed solution approach, a simulation model is implemented that models the Zuidoost-district of Amsterdam. During the numerical experiments, the proposed solution approach is adjusted to suit the characteristics of Amsterdam Zuidoost using several experimental factors that influence planning decisions taken in the proposed solution approach. The numerical experiments show that considerable improvements are possible if a dynamic planning approach is adopted. Moreover, the experiments show the potential benefits of installing fill level sensors in containers. Figure 1 shows the possible range of performance without and with installing sensors, compared to the performance of the current planning methodology of Amsterdam. The results show that a travel distance reduction of 12% is possible without installing sensors, and 21%
with sensors, without reducing the service level offered to Amsterdam’s inhabitants.
Recommendations
Based on the results of the experiments we formulate four recommendations for the municipality of Amsterdam:
• Implement the proposed solution approach using one of the preferred configurations, • Implement sensors into all or part of all containers,
• Improve the quality of data collection to enable better fill level predictions, • Initiate further research into the benefits of adding additional dynamicity.
Discussion and further research
[image:3.595.116.482.243.494.2]We believe that this thesis introduces a novel solution approach to the IRP in the way the time and space dimensions are considered simultaneously. Moreover, the solution is generalizable and can be applied to waste collection problems of other cities and probably even other IRPs. Further research should be done to confirm these presumptions. Moreover, the cost approximation methods, i.e., the cluster fitness approximation method and timing penalty costs, should be subject to more research as these approximations are currently merely very rough approximations of the costs associated with decisions taken in the IRP. It is believed that more accurate approximations of these costs can considerably improve the solution quality of the proposed solution approach.
3
Preface
The thesis before you is the result of my Master’s assignment, which I conducted to receive my degree
in Industrial Engineering and Management at the University of Twente. My assignment, as offered by DAT.Mobility and Goudappel Coffeng, was to improve the current planning methodology used by the municipality of Amsterdam for their waste collection. This proved to be quite a challenge, during which I have learned a lot.
I would like to thank André Oldenburger for providing me with the opportunity to work on this project
and for actively involving me in the ‘project team’ to gain some real insight and experience of working
on such large projects. Furthermore, I want to thank Henri Palm for all his feedback, which was always positive, but above all constructive. It was a pleasure working at DAT.Mobility where there was always a positive and open atmosphere.
During this project, I was also advised by my supervisors from the University of Twente, Martijn Mes and Eduardo Lalla, whom I would also like to thank. Their critical feedback on the previous versions has undoubtedly greatly improved the quality and clarity of this thesis.
Wouter Heijnen
4
Table of contents
Management summary ... 1
Introduction ... 1
Waste collection in Amsterdam ... 1
Proposed solution approach ... 1
Experiment results ... 2
Recommendations ... 2
Discussion and further research ... 2
Preface ... 3
Table of contents ... 4
List of definitions ... 6
Chapter 1 - Introduction ... 7
1.1 - Research context ... 7
1.2 - Problem description ... 7
1.3 - Research objective ... 8
1.4 - Research questions ... 9
1.5 - Problem solving approach ... 10
Chapter 2 - Current state of waste collection in Amsterdam ... 11
2.1 - Waste collection in Amsterdam ... 11
2.2 - Logistical chain ... 12
2.3 - Available collection vehicles ... 13
2.4 - Waste collection processes ... 14
2.5 - Current planning ... 15
2.6 - Choosing performance indicators ... 16
2.7 - Current performance ... 17
2.8 - Conclusion ... 18
Chapter 3 - Literature review ... 19
3.1 - Introduction to routing problems ... 19
3.2 - Introduction to solution techniques ... 23
3.3 - Inventory Routing Problems ... 24
3.4 - Waste collection planning ... 30
3.5 - Modeling approaches ... 30
3.6 - Conclusion ... 31
Chapter 4 - Solution approach ... 33
4.1 - Problem description ... 33
5
4.3 - Proposed solution approach ... 34
Chapter 5 - Simulation model ... 44
5.1 - Description of the simulation model ... 44
5.2 - Verification and validation ... 46
5.3 - Design of experiments ... 46
5.4 - Replication and deletion approach ... 48
5.5 – Conclusion ... 49
Chapter 6 - Numerical experiments ... 50
6.1 - Current performance of Amsterdam ... 50
6.2 - Inventory routing ... 50
6.3 - Dealing with stochasticity ... 56
6.4 - Planning horizon ... 59
6.5 - Conclusion ... 61
Chapter 7 – Conclusion and recommendations ... 63
7.1 - Conclusion ... 63
7.2 - Recommendations ... 64
7.3 - Discussion ... 65
List of abbreviations ... 67
References ... 68
Appendix 1 - Problem cluster ... 72
Appendix 2 - Distribution of generated waste per waste fraction ... 73
Appendix 3 - Waste collection related complaints in Amsterdam ... 73
Appendix 4 - Classification schemes from current literature reviews ... 74
Appendix 5 - Supplementary algorithms ... 75
Algorithm 2.1 - Cluster overflowed containers algorithm ... 75
Appendix 6 - Assumptions and simplifications simulation model ... 77
Assumptions ... 77
Simplifications ... 77
Changes of functionality waste processing facility ... 77
Appendix 7 - Replication deletion approach calculations... 78
Warmup period ... 78
Number of replications ... 78
Appendix 8 - Implementation of the Amsterdam’s current planning methodology ... 79
Appendix 9 - Cost function timing penalty costs ... 80
6
List of definitions
To prevent ambiguity we start by listing some definitions that are used throughout this thesis. Subsequently, a list of all abbreviations is given.
Tour A tour is a sequential list of containers that are subsequently visited that starts at a wharf or disposal facility and ends at a disposal facility.
Route: A route is a sequential list of tours that are subsequently executed by a vehicle. A route consists of one or multiple tours.
Scheduling/schedule Scheduling encompasses the operational decisions that are taken to make the schedule. A schedule is a collection of routes, which vehicles should perform which routes, and when.
Planning: Planning denotes decisions of a higher hierarchical level than scheduling and is used to comprise all decisions taken by the waste management department to plan the waste collection.
Container/vehicle fill level The fill level of both containers and vehicles indicates the amount of waste that is deposited and is currently stored in said container or vehicle. The fill level is often displayed as a percentage of the total capacity of the container or vehicle.
7
Chapter 1 - Introduction
This chapter introduces the research and the problem that initiates it. Firstly, we discuss relevant background information about the affiliated organizations and their connections to this research (Section 1.1). Secondly, the problem description is given, outlining the core problem this research aims to solve (Section 1.2). Thirdly, the research design is discussed in two sections: the research objectives and the research questions (respectively in Section 1.3 and 1.4). Lastly, the problem solving approach and thesis structure is outlined (Section 1.5).
1.1 - Research context
This research takes place at the Goudappel Group, a collaboration of companies that work together to offer their customers integral solutions to mobility issues. The offices of Goudappel Group are located in several cities across the Netherlands. This research is conducted from the headquarters, located in Deventer. The two most prominent parts of the Goudappel Group are Goudappel Coffeng and DAT.Mobility. The largest, Goudappel Coffeng, is mainly focused on consulting in mobility issues. Whereas DAT.Mobility supports Goudappel Coffeng, as well as its own customers, with data analysis and the development of ICT solutions. Both companies take part in this research. In the remainder of this report, the Goudappel Group is referred to as Goudappel.
Recently, Goudappel started to expand, from their traditional position as advisors in mobility, into the field of logistics. The ambition is to combine their pre-existing knowledge and experience in traffic modeling with a transport planning application. The desired end result is a dynamic planning platform that is usable in a broad range of logistic applications and scenarios. This research is the first step towards developing this dynamic model. The first practical application to present itself to Goudappel is the waste collection planning of Amsterdam. Therefore, while this theoretical research is conducted at Goudappel, it is part of a practical project initiated by the municipality of Amsterdam to improve its waste collection planning.
Amsterdam is the capital and the largest city of the Netherlands and has more than 854 thousand inhabitants (Municipality of Amsterdam, 2018b). The municipality of Amsterdam is responsible for the collection of all the waste produced in Amsterdam. Waste collection is one of the most complex and visible services offered by municipalities and involves large expenditures. In recent years, municipalities are therefore increasingly reconsidering their waste management due to costs and environmental concerns (Nuortio et al., 2006) (Jewel, 2017), as is now the case in Amsterdam. The problem of planning the collection of waste in Amsterdam is particularly complex because of the large number of densely packed containers and narrow, congested streets. Moreover, the addition of multiple satellite facilities, waste processors, and wharfs, which are elaborated upon in Section 2.2, complicates the planning problem.
1.2 - Problem description
Amsterdam’s main motivation for initiating the project is its ambition to improve the performance of
its waste collection planning. The main targets of Amsterdam are to reduce the total cost of collection and to minimize the number of required vehicle movements. Concretely, the municipality wants to reduce the cost of waste collection from €43 million to €40 million per year (Municipality of Amsterdam, 2018c). The targets are motivated by three performance indicators on which the municipality of Amsterdam perceives itself to be underperforming: the costs of waste collection, the service to its inhabitants, and the emission of greenhouse gases. These targets are set for the entirety
8 research chooses to focus solely on the collection from waste containers, as this collection method is believed to have the highest potential for improvement.
To find the core problem that causes the underperformance of the waste collection planning, a problem cluster is drawn, as described by Heerkens and van Winden (2012). This is used to analyze the surrounding problems and deduce their causal relationships. In the problem cluster, which can be found in Appendix 1, two main themes can be identified: the non-optimal timing of emptying containers and the inefficient collection routes.
The first theme, the non-optimal emptying time of containers refers to containers being emptied either too early or too late. The main reason for this is the static nature of the planning methods used by Amsterdam. Containers are emptied with predetermined frequencies that do not consider an up-to-date forecast. Because the schedule is made to effectively collect waste under all circumstances, the schedule and corresponding container emptying frequencies are determined to be as robust as possible. However, this causes inefficiencies as the content of containers is stochastic, changes over time, and is subject to the effects of seasonality. The combination of these factors and the static planning it can, for example, occur that a container is emptied when relatively empty because it is a less busy period of the year, or containers overflow because of an increase in residents in the neighborhood. Both these situations are undesirable as overfull containers inconvenience inhabitants and signify a bad service level, while containers that are emptied too early cause unnecessary vehicles kilometers and emissions.
The second theme, the inefficiency of the routes between containers can be attributed to two factors: the decentral planning and a failure to respond to new incoming information, such as traffic data or calling inhabitants. Firstly, Amsterdam’s waste collection planning is decentralized, this means that
each municipal district has the responsibility for its own waste collection. Consequently, containers are designated to the district in which they are located and planned in routes executed by that district, even though it could fit more efficiently in a route of another district. This causes detours and unnecessary additional driven kilometers. Secondly, the current routes do not consider predicted or real-time traffic data. Especially in densely populated areas such as Amsterdam, where traffic congestion is a recurring phenomenon, this data should be used to avoid such congestions. The inability to avoid traffic congestion threatens the feasibility of the schedule and causes additional CO2 emissions.
To summarize, the two main problem themes are caused by, in the first case, static scheduling, and in the second case, static routing. This static scheduling and routing policy, in combination with the changing waste collection setting in Amsterdam, causes the underperformance of the planning. As a result, the core problem is formulated as follows:
Core problem:The current static collection schedules and routes are unsuitable for the stochastic, dynamic demand for waste collection.
1.3 - Research objective
9 the opportunity to improve the timing of emptying containers. Moreover, the new planning techniques can incorporate improvements on the other previous weakness as well, such as the inefficient routes and not considering traffic data.
Because developing an entire planning platform is unrealistic in the time allotted for this research, the scope is limited to the collection of waste from waste containers. This collection method is chosen as it is highly influential for the total waste collection performance, easily separable from the other planning functions, and not subject to as many legislative restrictions. Moreover, the forecasting of container content is such a complex problem that it is considered largely outside the scope of this research. It is briefly discussed as an input variable for the planning, but a complete, thorough analysis of all the complexities involved is not conducted. Lastly, developing an interface and implementing the planning application are also omitted from the research scope.
At the moment, neither Goudappel nor Amsterdam have the necessary experience or knowledge to develop the required planning methods. Therefore, the goal of this research is to identify and develop a planning methodology that improves upon the current waste collection planning in Amsterdam. More specifically, the new planning method should improve upon the current cost, emission, and service performance indicators.
1.4 - Research questions
From the previously described research objective we deduce the following research question:
Main research question:
In which way and to what degree can the waste collection planning of Amsterdam be improved by using dynamic scheduling algorithms?
To answer the main research question, we formulate several research questions. These research questions are formulated below and are elaborated upon further in Section 1.5.
Research question 1: What is the current state of the waste collection planning in Amsterdam?
a. What are the characteristics of the waste collection system in Amsterdam? b. How is the collection of waste currently planned?
c. What are the relevant performance indicators to evaluate the waste collection planning? d. What is the performance of the current waste collection planning in Amsterdam?
Research question 2: What relevant routing problems and corresponding solution approaches
are described in the literature?
a. What types of existing routing problems most closely resemble the problem faced during the waste collection planning in Amsterdam?
b. What types of solution approaches are described in literature to solve these types of problems?
10
Research question 3: How can a novel planning methodology be designed for the waste
collection in Amsterdam?
a. Which decisions are to be taken to schedule the collection of waste in Amsterdam and which boundary conditions apply to those decisions?
b. How can the decision process be decomposed into smaller decisions?
Research question 4: How should the waste collection system of Amsterdam be modeled to
allow for the evaluation of novel planning methodologies?
a. In what scope and level of detail should the planning methodologies be tested?
b. How should the appropriate values for the adjustable parameters of the proposed solution approach be established?
Research question 5: What is the expected outcome of the proposed planning methodology
for the waste collection of Amsterdam?
a. What are the effects of the defined adjustable parameters on the planning performance? b. How does the proposed solution approach deal with changing demand for waste collection?
1.5 - Problem solving approach
To solve the core problem and achieve the research objective, the research questions formulated in the previous section should be answered. This section outlines the problem solving approach that is adopted during this research to answer the main research question and in doing so gives an overview of the structure of this thesis.
The first research question is answered in Chapter 2, which gives an overview of the current situation
of Amsterdam’s waste collection system and its planning. To give this overview, the characteristics of
the waste management system in Amsterdam are discussed, as well as the current planning methodology. Subsequently, relevant performance indicators are chosen with which to evaluate the current planning performance using data supplied by the municipality of Amsterdam.
The second research question involves a review of the current literature relevant to the problem in Amsterdam. This literature review is given in Chapter 3 where we discuss literature on different routing problems, solution approaches, and waste collection planning. The applicability of the discussed literature to the context of Amsterdam is debated and finally, the contribution of this research to the current literature is discussed.
Based on the previous literature review, the third research question asks how a new planning methodology can be designed for the waste collection of Amsterdam. Chapter 4 starts by defining the problem faced by Amsterdam and continues by formulating our proposed solution approach. Several tunable experimental parameters are identified and introduced.
The fourth research question discusses how the proposed solution approach can be compared to the current planning methodology of Amsterdam. Moreover, how the effects of the experimental parameters can be evaluated. To answer this question, Chapter 5 describes the chosen modeling approach and the implemented model, including the chosen scope and level of detail.
11
Chapter 2 - Current state of waste collection in Amsterdam
This chapter describes the current state of the waste collection in Amsterdam in order to clarify the context in which the previously described problems occur. It starts by giving an introduction to some general characteristics of waste collection in Amsterdam (Section 2.1). After that, the logistical chain set up to handle the collection of waste (Section 2.2) and the available collection vehicle fleet (Section 2.3) are discussed. Following that, the waste collection process is discussed briefly (Section 2.4), as well as the current planning methodologies applied by Amsterdam (Section 2.5). This chapter continues by formulating the relevant performance indicators (Section 2.6) and evaluating the performance of the current planning methodology (Section 2.7). Finally, the research questions pertaining to this chapter are answered in a summarizing conclusion of this chapter (Section 2.8).
2.1 - Waste collection in Amsterdam
The waste collection of Amsterdam is the responsibility of its municipality. Annually, it facilitates the collection of more than 304 thousand tons of waste, which is done by around 300 full-time employees (Municipality of Amsterdam, 2015). In accordance with the scope of this research, we focus on the collection of waste from the more than 12.000 waste containers scattered in Amsterdam, see Figure 2.
[image:12.595.79.521.324.632.2]Amsterdam distinguishes six different types of waste, called waste fractions, that are collected and processed separately. Four of these waste fractions are wholly or partly collected in waste containers: household waste, glass, paper, and plastics. Household waste can also be described as residual or unsorted waste. On average, each inhabitant of Amsterdam dumps a total of 227 kilograms of waste in waste containers per year. 81% of that waste is thrown out as unsorted household waste. The remaining 19% is sorted into either the designated paper, glass, or plastics containers (Municipality of Amsterdam, 2015). Appendix 2 shows the distribution of the weight collected from containers per waste fraction, per year.
12
2.2 - Logistical chain
The logistical chain set up by Amsterdam to collect waste consists of four types of locations: waste containers, wharfs, and two types of disposal facilities: satellite facilities and waste processing facilities. Each location has its own functions (Municipality of Amsterdam, 2018c) and characteristics which are described in the following sections.
2.2.1 - Waste containers
Waste containers are used to collect and store waste. Inhabitants can throw away waste in the waste containers, in which it is then stored out-of-sight and without smell, improving the cityscape. The storage of containers can be located underground, as in the example in Figure 3, or above ground. Waste is collected from the containers, to ensure they do not overflow, by waste collection vehicles. Each container is dedicated to one waste fraction to enable the municipality to recycle the separate waste fractions. Containers have a limited waste storage capacity which is between 3m3 and 7m3.
2.2.2 - Wharfs
Wharfs are used as the base for all collection operations in a city district. Waste collection employees often have fixed designated wharfs where they start and end their working day. All waste collection routes also start and finish at a wharf. The wharfs then function as parking lots for all collection vehicles overnight. Because of the current decentralized way of planning, each of the seven districts has a wharf from which all waste of that district is collected.
2.2.3 - Waste disposal facilities
[image:13.595.85.511.265.562.2]There are two types of locations where collection vehicles are able to dump their collected waste: satellite facilities and waste processing facilities. The difference between the two locations is that the satellite facility is only used to temporarily store waste, which is later transported to a waste processor to be processed. The waste processors are the end of the logistical chain for all collected waste in
13
Figure 2: Locations of wharfs, satellite facilities, and waste processors in Amsterdam
Amsterdam, where the waste is separated and recycled or processed if possible. Whether to visit a satellite facility or waste processor is a planning decision. This decision is based on the proximity of the route to either of the disposal facilities.
There are currently two satellite facilities with plans to build a third. The two existing satellite facilities have a combined capacity to store the waste load of 55 full collection vehicles. Moreover, there are four waste processing facilities, each of which is dedicated to processing waste from one waste fraction.
2.2.4 - Geographical layout
The locations of the wharfs, satellite facilities, and waste processing facilities are shown in Figure 4. Note that the satellite facility planned for construction is already included in this figure, see the northern-most satellite facility, as its construction starts in 2019.
2.3 - Available collection vehicles
This section describes the collection vehicles that are available for waste collection in Amsterdam. Waste collection vehicles have several characteristics that dictate how they can be utilized. The most notable are their compatible waste fraction, capacity, and the capability to unload waste at satellite facilities.
14 Collection vehicles can be categorized as either dedicated or multipurpose vehicles. Dedicated collection vehicles are compatible with only one waste fraction, while multipurpose vehicles can be utilized to collect multiple different waste fractions. Multipurpose vehicles are not able to collect different waste fractions simultaneously, but only consecutively. To illustrate, a multipurpose collection vehicle can collect paper in the morning and household waste in the afternoon, as long as it is not on the same trip. Table 1 shows the number of available dedicated and multipurpose vehicles per waste fraction (Municipality of Amsterdam, 2018c). Note that multipurpose vehicles are counted for all waste fraction with which they are compatible.
Table 1: Available waste collection vehicles
Waste fraction Household
waste Glass Paper Plastics Total
Dedicated 35 1 2 4 42
Multipurpose 12 18 20 0 20
Total available for fraction 47 19 22 4 62
Furthermore, collection vehicles have a limited capacity to store and transport waste. Most collection vehicles have a weight capacity between 8 and 10 tons of waste. Several collection vehicles are also equipped with a storage tank-switch system. This system enables collection vehicles to switch their full storage tank with an empty tank at one of the satellite facilities. Collection vehicles can then resume collection waste without visiting a waste processor.
2.4 - Waste collection processes
To gain a better understanding of the waste collection in Amsterdam this section describes the associated processes. This is done using business process modeling as it facilitates the understanding and analyzing of processes (Aguilar-Savén, 2004). The process flow chart is shown in Figure 5 (Municipality of Amsterdam, 2018c).
At the start of each working day, which are Monday to Friday, the waste collection routes start from the different wharfs. Each employee ordinarily works from the same wharf every day. The wharfs also serve as an overnight storage location for waste collection vehicles. A typical working day consists of 8.5 hours, of which, after subtracting time for activities such as preparation and lunch, 6.25 hours are available to execute the planned collection routes.
15 During the execution of the collection routes, there is a decision moment every time a container is emptied. During this moment, it is considered if it is possible for the collection vehicle to continue according to the predetermined schedule. This decision is based on the fill level of the collection vehicle, if a capacity threshold is reached, the vehicle is considered too full to continue to empty
another container. If that is the case, an online decision is taken to either dump the collection vehicles’
load at a satellite facility or waste processor. This online decision is necessary because the actual fill level of containers is uncertain and they may have higher fill levels than anticipated, resulting in infeasible routes.
During the execution of the collection routes, there is a decision moment after each emptied container. The decision is based on the fill level of the vehicle; if the vehicle is too full to empty another container it should decide to empty its storage at either a waste processor or satellite facility. If the vehicle is not too full, the normal schedule can be followed which is either: collect waste from the next container or go to either the waste processor or satellite facility. A waste collection vehicle can, for example, have a higher fill level than anticipated because of higher fill levels of the collected waste containers. When an employee is finished with his/her collection route, the collection vehicle can be retired to the wharf and the working day is finished. Occasionally, the waste that is aggregated at the satellite facilities is transported to the corresponding waste processor.
2.5 - Current planning
The current schedules are static and fixed, this means that the same schedules are executed in a cyclic manner. Moreover, the routes between waste containers in these schedules are also rarely subject to changes (Municipality of Amsterdam, 2018c). The schedules are currently based on a predetermined emptying frequency per container, e.g., once per week, twice per week, once per two weeks. These frequencies are based on slightly exaggerated estimations of container deposit rates to ensure the frequencies can be used year-round.
The static nature of the schedules means that planners are mostly occupied with the operational issues, such as adjusting the planning when containers are defect or when inhabitants complain about uncollected waste. Inhabitants are able to notify the municipality using a public notification portal. Amsterdam strives to handle all complaints within three days. In reality, this is managed for 80% of the complaints (Municipality of Amsterdam, 2016). Appendix 3 shows the five most common complaints and notifications concerning waste collection the municipality of Amsterdam received in 2014 (Municipality of Amsterdam, 2015). When a complaint is made, an addition has to be made to
the collection planning, this is currently done manually by Amsterdam’s planners. Next to the operational planning of the schedules, the planner is also responsible for the personnel and vehicle planning.
16
2.6 - Choosing performance indicators
This section starts by determining the key performance indicators (KPIs) on which the waste collection planning should be evaluated. These KPIs are chosen based on a combination of wishes from the municipality and suggestions from literature. Because multiple KPIs are identified, we also discuss how alternatives can be evaluated based on multiple, possibly conflicting, KPIs.
2.6.1 - Choosing key performance indicators
The three main targets for Amsterdam in their pursuit for an improved waste collection planning methodology are: to reduce the total costs and vehicle movements and to improve the service to its inhabitants (Municipality of Amsterdam, 2018c). In addition to these main KPIs, the municipality also formulates several secondary objectives: total CO2 emission, time spent collecting, average fill level of containers upon emptying, and fill level collection vehicles upon unloading. The three main KPIs are defined and quantified as follows:
• Influenceable collection costs / ton of waste collected: consisting the sum of the vehicle, fuel, and wage costs;
• Number of kilometers driven / ton of waste collected;
• Service level: the percentage of waste that is collected on-time.
2.6.2 - Multiple criteria decision making
Evaluating alternatives given a set of criteria, or KPIs as named in this research, is defined by Stewart (1992) as Multiple Criteria Decision Making (MCDM). The aim of MCDM is to assist the decision maker to find the most desirable alternative and provide justification for that decision (Stewart, 1992).
[image:17.595.147.451.545.754.2]To evaluate different planning methodologies, we use the concept of Pareto optimality. Pareto optimality is used to evaluate alternatives in multiple papers on multi-objective general routing (Huang, Fery, Xue, & Wang, 2008), as well as waste collection routing (Xue & Cao, 2016) (Samanlioglu, 2013). Due to the often conflicting natures of the objectives, oftentimes, no one solution is objectively better than all other solutions. Alternatives are called Pareto optimal if an improvement in one objective has to be at the expense of another objective (Huang et al., 2008). The set of all Pareto optimal points is called the Pareto curve or front, an example is shown in Figure 6. This front gives insight into the shape of the trade-off between the objectives and can be used during the decision making.
17 To allow for a straightforward evaluation of alternatives and to reduce the number of Pareto optimal point to consider, we choose to select two criteria on which to evaluate all alternatives. More criteria would complicate the analysis and selection of promising alternatives, as two-dimensional visualization is then made impossible. The two KPIs used for the multi-objective decision making are the number of kilometers driven per ton of waste collected and the service level. These two criteria represent both sides of the most important trade-off: emptying early and often versus emptying late and infrequent. In the remainder of this thesis, the Pareto front is called the efficiency frontier.
2.7 - Current performance
This section discusses the performance of the current waste collection planning on both the primary and secondary KPIs identified by Amsterdam, with the exception of the service level. This KPI is excluded because the municipality currently does not have the ability to accurately measure it. Moreover, the municipality of Amsterdam has only gathered the performance of the planning of the household, paper, and glass waste fractions. Because the plastic fraction represents such a marginal part of the total collected waste, i.e., less than 1% (Municipality of Amsterdam, 2015), we presume that the other fractions give an accurate depiction of the current planning performance. The performance data relates to the waste container collection performance of 2017.
2.7.1 - Influenceable collection costs
The influenceable collection costs consist of four factors: the cost per vehicle, personnel costs, cost per kilometer, and satellite facility costs. The contribution of each cost factor is shown in Table 2 (Municipality of Amsterdam, 2018a).
Table 2: Influenceable costs incurred by Amsterdam in 2017 for the collection of household, paper, and glass from containers
Cost factor Amount Costs % of costs
Required number of collection vehicles 67 € 6.375.000 50,1% Hours spent collecting 137.152 € 5.486.090 43,1% Number of kilometres driven 940.735 € 658.514 5,2 % Containers via satellite facilities 8.256 € 643.930 5,1 %
Influenceable collection costs - € 12.721.507 100 %
The highest incurred costs are the fixed costs of the collection vehicles. On average maintaining and depreciating the vehicle fleet costs approximately €95.000 per vehicle, per year. The personnel cost, or the time spent collecting, is a close second in terms of impact on the total costs. In 2017, collection employees worked a total of 137.152 hours for an average cost to the municipality of €40. The latter two have a significantly less pronounced impact on the total costs, cumulatively around 10%, and are calculated using fuel costs of €0,70/km and satellite facility costs of €78/container.
18 caused by the respective densities of the waste fractions, the collecting cost per ton of paper and per cubic meter of glass are significantly higher than average.
Table 3: Costs per ton and cubic meter of waste collected
Waste fraction Household Paper Glass Average
Cost per ton of waste € 55,15 € 120,29 € 55,79 € 60,79
Cost per m3 of waste € 5,52 € 8,42 € 16,74 € 6,14
2.7.2 - Average fill levels of containers and collection vehicles
The fill level is the percentage of the total volume capacity that is filled with waste. The moments at which the container is emptied and the collection vehicle dumps its waste at a disposal facility are used to measure the average fill levels. Table 4 shows the fill levels of both containers and vehicles for the collection of different waste fractions, as well as the average fill levels.
Table 4: Average fill levels of containers and vehicles upon emptying
Waste fraction Household Paper Glass Average
Average fill level of containers 39,3 % 39,6 % 20,3 % 38,1 %
Average fill level of vehicles 79,1 % 74,0 % 75,4 % 77,9 %
It can be seen that the average fill level of containers is especially low, as previously discussed in Chapter 1. Notably, the average fill level of glass containers is almost half that of the other waste fractions. This is caused by the fact that the fill level of containers is calculated based on weight. As the volume capacities for the average container are comparable, the high density of glass means that glass containers have a very high weight capacity. Therefore, while paper containers are emptied twice as much with a comparable amount of waste, the fill level of glass containers is approximately twice as low.
2.8 - Conclusion
This chapter gives an overview of the current state of waste collection and its planning in Amsterdam. In doing so, it answers research question 1: What is the current state of waste collection planning in Amsterdam?
A distinctive characteristic of the waste collection logistical chain in Amsterdam is the presence of satellite facilities. Satellite facilities can be used to offload full collection vehicles, allowing them to collect more waste. The current collection planning is predominantly fixed and cyclic. Changes in the planning that do occur are caused by inhabitant complaints or defective equipment. To evaluate the current planning and to be able to compare it to new proposed planning methodologies, we formulate four KPIs by consulting the municipality and literature: influenceable collection costs, number of overfull containers, and the average fill levels of both containers and vehicles. Notably, by far the most costs are spent on the fixed costs of vehicles (47%) and the hourly wages of collectors (43%). Another noteworthy finding is the low average fill level at which containers are emptied (38%).
The next chapter outlines a literature review which places Amsterdam’s problem in the existing
19
Chapter 3 - Literature review
This chapter reviews the relevant literature to solve the knowledge problems formulated in the research questions. Firstly, an introduction to the basic concepts surrounding routing problems is given, together with two examples that closely resemble the situation in Amsterdam (Section 3.1). Secondly, different solution approaches to routing problems are examined to give an overview of the possible approaches (Section 3.2). Subsequently, the Inventory Routing Problem (IRP) is discussed more extensively (Section 3.3) as this is the routing problem that most closely resembles the situation in Amsterdam. After that, the literature specifically researching the improvement of waste collection planning is studied (Section 3.4). To be able to evaluate different planning methodologies, we study different modeling approaches that can be used to model the waste collection system of Amsterdam (Section 3.5). Finally, the findings of the literature review are summarized in a conclusion and the contribution of this thesis to the existing literature is noted (Section 3.7).
3.1 - Introduction to routing problems
This section aims to give a general introduction to several concepts surrounding routing problems and their practical applications. We start by discussing an important input factor to all routing problems: shortest path routing. After that, a general classification of routing problems is discussed with practical examples. Subsequently, two specific routing problems are introduced: the Vehicle Routing Problem (VRP) and Inventory Routing Problem (IRP).
3.1.1 - Shortest path routing
One of the prerequisites for solving routing problems is being able to compute the shortest path between all locations that are considered in the routing problem in question. Shortest path routing is used to generate cost matrices, often based on distance, time, or a combination of the two, between locations (Ticha et al., 2017). One of the leading uses of shortest path routing is in transportation, but it also has applications in artificial intelligence, operations research, and computer science (Tommiska & Skytta, 2001) (Huang, Wu, & Zhan, 2007), making it a popular research topic.
A classic approach to solve the shortest path problem is Dijkstra’s algorithm (Dijkstra, 1959). However, since its publication in 1959, the performance of shortest path algorithms has improved drastically,
leading to algorithms that are up to three million times faster than Dijkstra’s original algorithm (Delling et al., 2009). Other well-known algorithms include the A* search (Goldberg, Kaplan, & Werneck, 2006)
and Bellman’s algorithm (Bellman, 1958).
Traditionally, most literature focuses on a single-objective shortest path. However, Tarapata (2007) argues that in many practical applications, multicriteria shortest path problems are more suitable. This is also the case in Amsterdam, where the municipality prescribes three criteria of importance: costs, emission, and nuisance.
3.1.2 - General types of routing problems
20 A commonplace example of a node routing problem is the Travelling Salesman Problem (TSP). The general TSP can be formulated as follows: A salesman wants to find the shortest route in which to visit all customers and return back home (Lenstra & Kan, 1975). A generalization of the TSP is the VRP, which was first introduced by Dantzig and Ramser (1959). The VRP is a combinatorial optimization problem that is used to determine the optimal route to deliver a given set of orders to a given set of customers from one or multiple depots (Kumar & Panneerselvam, 2012). The VRP is discussed further in the next section.
Most research into arc routing problems is done on the specific case of the Capacitated Arc Routing Problem (CARP). This problem arises when streets have to be traversed, for example for maintenance, snow removal, or road gritting. Each road (i.e., arc) has to be serviced by exactly one vehicle and all vehicles have a limited capacity (Hertz, Laporte, & Mittaz, 2000).
Despite the difference between node and arc routing problems, they are of the same complexity. As for each arc routing problem, there exists an equivalent node routing problem and vice versa (Oppen & Løkketangen, 2006). Nevertheless, research into solving node routing problems is much more prevalent. Because of this, there exist several problems for which the computational results of the node routing version outperform their arc routing counterparts, for example, the Capacitated VRP (Baldacci & Maniezzo, 2004). Therefore, especially transformation techniques from arc to node routing problems have gotten some attention in literature (Pearn, Assad, & Golden, 1987) (Baldacci & Maniezzo, 2004).
Nevertheless, there are also instances where arc routing techniques are used in a node routing environment to reduce the problem size. Oppen and Løkketangen (2006) show that the problem size decreases and solution quality increases when customers are aggregated into clusters, represented by arcs. However, they also note that it is only applicable in specific cases where there are a high number of customers on so-called road segments, such as is the case with house-to-house waste collection or mail delivery.
The problem faced in Amsterdam can be classified as a node routing problem. The demands occur at the containers which do not adhere to the required characteristics of arcs in an arc routing problem. Therefore, the remainder of this section focuses on two specific node routing problems that most closely resemble the situation in Amsterdam: the VRP and IRP.
21
3.1.3 - Vehicle Routing Problem
The VRP was first introduced by Dantzig and Ramser (1959), who named it the “truck dispatching problem”. The VRP is a generalization of the TSP, which adds the condition that dictates specific deliveries to be made to specific locations (Dantzig & Ramser, 1959). The most general formulation of the VRP concerns itself with constructing optimal routes between one depot and a number of customers that have a known demand (Laporte, 1992).
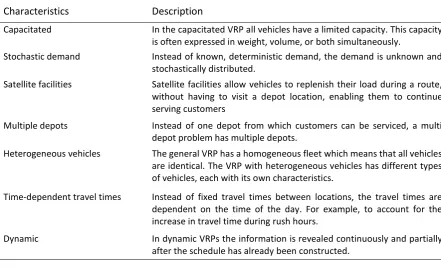
[image:22.595.74.516.300.569.2]Since its inception in 1959, the VRP has become one of the most extensively studied combinatorial optimization problems (Cordeau et al., 2002). Due to this popularity, the original VRP has been extended by adding real-life characteristics to the problem (Braekers, Ramaekers, & van Nieuwenhuyse, 2016). However, most literature is limited to studying one additional characteristic at a time, disregarding that real-life cases should often adhere to a wide range of characteristics simultaneously (Braekers, Ramaekers, & van Nieuwenhuyse, 2016). Some variants with relevance to the problems faced in Amsterdam are listed and elaborated briefly below in Table 5.
Table 5: Variants of the Vehicle Routing Problem (adapted from Braekers, Ramaekers, & van Nieuwenhuyse (2016))
Characteristics Description
Capacitated In the capacitated VRP all vehicles have a limited capacity. This capacity is often expressed in weight, volume, or both simultaneously.
Stochastic demand Instead of known, deterministic demand, the demand is unknown and stochastically distributed.
Satellite facilities Satellite facilities allow vehicles to replenish their load during a route, without having to visit a depot location, enabling them to continue serving customers
Multiple depots Instead of one depot from which customers can be serviced, a multi depot problem has multiple depots.
Heterogeneous vehicles The general VRP has a homogeneous fleet which means that all vehicles are identical. The VRP with heterogeneous vehicles has different types of vehicles, each with its own characteristics.
Time-dependent travel times Instead of fixed travel times between locations, the travel times are dependent on the time of the day. For example, to account for the increase in travel time during rush hours.
Dynamic In dynamic VRPs the information is revealed continuously and partially after the schedule has already been constructed.
3.1.4 - Inventory Routing Problem
The IRP is an important and one of the most challenging extensions of the VRP (Bertazzi, Savelsbergh, & Speranza, 2008). Its pioneering paper was written by Bell et al. (1983) who focus on the efficient distribution of industrial gases to customers. This is an early example of a common practical situation in which the IRP arises, vendor managed inventory (VMI) (Coelho, Cordeau, & Laporte, 2014). VMI is a modern supply chain strategy in which the supplier, or vendor, becomes responsible for the inventory management of its customers (Sari, 2007). This means that the supplier is able to schedule deliveries to its customers itself, instead of being directed by the customer’s order. This allows the
22 The IRP combines two theoretical fields: inventory management and routing. During the IRP, inventory management decisions are taken such as: when should we serve each customer and how much should we deliver each customer, simultaneous with routing decisions such as: how should the chosen customers be combined in vehicle routes (Coelho, Cordeau, & Laporte, 2014). This connotes that the decisions should be taken in two dimensions: the time and space dimensions. This creates an extra level of complexity in comparison to traditional routing problems, where the decision maker is only concerned with the space dimension.
The integration of these decisions is important, as the results of one field influence the possibilities in the other. For example, timing decisions such as the inventory allocation dictates which customers are served on the same day, restricting the routing decision which is related to the space dimension of the IRP. The objective of the IRP is to minimize the delivery costs while ensuring no customer experiences stock-outs (Bard et al., 1998). A more general formulation of the IRP is given by Campbell et al. (1998):
“The IRP is concerned with the repeated distribution of a single product from a single facility to a set
of 𝑁 customers over a given planning horizon of length 𝑇, possibly infinity. […] The objective is to minimize the average distribution costs during the planning period without causing stockouts at any
of the customers”.
In addition to the earlier mentioned fields of inventory management and routing, Baita et al. (1998) introduce another aspect of the IRP: dynamicity. This refers to the dynamic framework in which the inventory and routing decisions are taken; decisions are taken at different times, where earlier decisions significantly impact later decisions (Baita et al., 1998). This is repeated by Moin and Salhi (2007), who describe the IRP as a medium-term problem, in contrast to the short-term character of the VRP. For example, the decision to postpone serving a customer may seem beneficial in the short term, but this customer cannot be postponed indefinitely. One of the most important challenges posed by the IRP is finding the optimal timing of deliveries considering both the time and space dimensions.
From this, the similarity between the IRP and the waste collection planning of Amsterdam is clear. In Amsterdam, the municipality is responsible for determining the emptying time of each container, which are the customers in this analogy with the IRP. Moreover, the municipality objective is to minimize collection costs, while ensuring a high service level, identical to the objectives of a general IRP. Because containers are visited not to distribute something, as in the general IRP, but to collect something, the problem is known as the reverse IRP (Mes, Schutten, & Rivera, 2014).
The IRP is an 𝑁𝑃-hard problem because it can be reduced to the classical VRP (Coelho, Cordeau, & Laporte, 2014). This means that there is no known algorithm that can solve the IRP in polynomial time, but only in nondeterministic polynomial time (Papadimitriou, 2003). This makes solving the problem to optimality computationally infeasible as the problem size increases (Woeginger, 2003).
23
3.2 - Introduction to solution techniques
Finding solutions for these types of routing problems has been the focus of an abundance of literature. This section aims to give a short overview of the possible techniques that are used. We use the classification of Coelho, Cordeau, and Laporte (2014) who classify solution techniques for the IRP into three categories: exact methods, heuristics, and metaheuristics.
3.2.1 - Exact methods
The aim of exact methods or algorithms is to solve the problem to proven optimality. However, as the IRP is 𝑁𝑃-hard this becomes infeasible even for fairly smaller instances. Nevertheless, exact techniques are occasionally used to solve at least parts of the IRP. Two techniques that are used more frequently are described by Woeginger (2003): dynamic programming and branch-and-bound algorithms.
Dynamic programming involves dividing large complex problems into smaller subproblems that are more easily solvable. By using the solutions to these subproblems, dynamic programming is able to solve the larger, complete problem (Woeginger, 2003).
A more commonly used exact approach in the IRP literature are branch-and-bound or branch-and-cut algorithms. Both approaches are based on search trees, where the solution space is partitioned into smaller subsets for which all feasible possibilities, represented by ‘branches’, are evaluated
(Woeginger, 2003). The branches for which it can be proven that they cannot result in an optimal solution, even before the complete solution space is filled, can be ‘pruned’. This branch is then
discarded and not explored further, reducing the computation time.
3.2.2 - Heuristics
Because solving a problem to optimality using exact methods is not always feasible, as is the case with the IRP, a lot of research focuses on approaching the optimum using approximation heuristics that result in acceptable solutions with less computation time (Nilsson, 2003). Blum and Roli (2003) distinguish two basic categories of heuristics: constructive methods and local search methods.
Constructive methods are designed to create a feasible solution from scratch. They are typically fast, but also provide relatively poor solutions (Blum & Roli, 2003). Examples of construction heuristics used for routing problems are the: Nearest Neighbor, Greedy, and Christofides heuristics (Nilsson, 2003).
Local search methods start with a feasible solution and attempt to iteratively improve that solution (Blum & Roli, 2003). These methods are called local search because the improvements are sought in
‘neighboring’ solutions in the solution space. An example of such a heuristic for routing problems is the k-opt algorithm (Nilsson, 2003).
3.2.3 - Metaheuristics
24
3.3 - Inventory Routing Problems
To systematically review the current literature on the IRP, a classification matrix is drafted. Using a classification matrix ensures that the literature review is performed in a concept-centric manner, i.e., structured around concepts instead of individual authors (Webster & Watson, 2002).
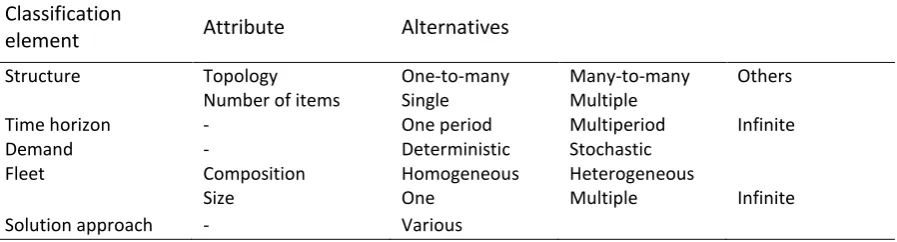
[image:25.595.75.524.316.437.2]Several classification schemes from existing literature reviews covering the IRP are studied to identify relevant concepts that can be used to characterize IRP papers. Moin and Salhi (2007) categorize papers according to the modeled time horizon: single period, multiperiod, and infinite models. Stochastic models are discussed separately as a relatively newer area of research. However, most reviews classify IRP papers based on their practical characteristics. Examples are the reviews of Baita et al. (1998), Andersson et al. (2010), Bertazzi and Speranza (2012), and Coelho, Cordeau, and Laporte (2014). A complete overview of their classification schemes can be found in Appendix 4. Based on the classification elements used in these papers in combination with relevant aspects relevant from the context of Amsterdam we formulate the following classification structure, see Table 6.
Table 6: Classification structure based on Baita et al. (1998), Andersson et al. (2010), Bertazzi and Speranza (2012), and Coelho, Cordeau, and Laporte (2014)
Classification
element Attribute Alternatives
Structure Topology One-to-many Many-to-many Others
Number of items Single Multiple
Time horizon - One period Multiperiod Infinite
Demand - Deterministic Stochastic
Fleet Composition Homogeneous Heterogeneous
Size One Multiple Infinite
Solution approach - Various
25
Table 7: Classification matrix of the Inventory Routing Problem
Paper1 Problem structure Time
horizon Demand
Fleet
Solution approach2 Additional notes Topology No. of
items Composition Size
[1]
One-to-many Single
Single
period Stochastic
Homo-geneous Multiple Decomposition and MIP
Treat IRP as variant of VRP
[2]
One-to-many Single
Multi-period Deterministic
Homo-geneous Multiple Various
Comparison of computational algorithms [3]
One-to-many Single
Multi-period Stochastic
Homo-geneous Multiple
Decomposition: (i) clustering, (ii) routing
Rolling horizon, satellite facilities
[4]
One-to-many Multiple
Multi-period Stochastic - One
Bi-level iteration heuristic with IP and
TSP
Proof of lower bound calculations
[5]
One-to-many Single
Multi-period Stochastic
Homo-geneous Multiple
Dynamic programming approximation methods
IRP as Markov decision process, direct
deliveries
[6]
One-to-many Single
Multi-period Deterministic
Homo-geneous Multiple
Decomposition to (i) IP for high level plan and
(ii) heuristics for detailed plan
Rolling horizon, decomposition in the
time dimension
[7]
One-to-many Single
Multi-period Deterministic
Homo-geneous Multiple
Decomposition to (i) Inventory Allocation, (ii)
TSP, and (iii) VRP
Variable lead times due to traffic congestion
[8] ?-to-many Single
Multi-period Deterministic
Homo-geneous Infinite
Hybrid heuristic combining Tabu search
and SA
Solution method tested using simulation, adds variable depot locations [9]
One-to-many Single
Multi-period Deterministic - One
MILP relaxation, branch-and-cut
algorithm
First exact algorithm, based on valid
inequalities [10]
Many-to-many Single
Multi-period Deterministic
Homo-geneous Multiple
Integer Programming and local search
heuristic
Specific attention for problem size reduction
[11]
One-to-many Single
Multi-period Deterministic - One
ALNS algorithm and
network flow algorithm IRP with transshipment
[12]
Many-to-many Multiple
Multi-period Deterministic
Homo-geneous Multiple MILP model
Tested on both 4 randomly generated as
1 real-life case [13]
One-to-many Multiple
Multi-period Deterministic
Homo-geneous Multiple
Exact solution with branch-and-cut
algorithm
Feasible up to medium size instances of several
problem classes [14]
One-to-many Single
Infinite
(cyclic) Deterministic
Homo-geneous Infinite ALNS algorithm Periodic IRP
[15]
One-to-many Multiple
Multi-period Deterministic
Homo-geneous Multiple
Three phase heuristic: (i) replenishment plan,
(ii) sequencing, (iii) planning and routing
with MILP
Includes Lagrangian-based heuristic in first
26
Table 7: Concept matrix of the Inventory Routing Problem (continued)
Paper1 Problem structure Time
horizon Demand
Fleet
Solution approach2 Additional notes Topology No. of
items Composition Size
[16]
One-to-many Multiple
Multi-period Deterministic
Homo-geneous Infinite
Hybrid GA based on decomposition to (i) allocation and (ii)
routing
Accounting for carbon emission regulations
[17]
One-to-many Single
Infinite
(cyclic) Deterministic
Homo-geneous Multiple
Decomposition to (i) routing and (ii)
scheduling
Proposes Vehicle Decrease Heuristic
[18]
One-to-many Single
Multi-period Deterministic
Hetero-geneous Multiple
Branch-and-cut algorithm
Introduces green-IRP. Analyses impact of heterogeneous vehicles [19]
One-to-many Multiple
Multi-period Deterministic
Homo-geneous Multiple Hybrid RVND
Case study with planned transshipment
This thesis
One-to-many Single
Multi-period Stochastic
Homo-geneous Infinite
Decomposition to (i) selection, (ii) day
assignment, (iii) routing, see Chapter 4
Satellite facilities, integrated decision on
time and space dimension 1 With: [1] Federgruen & Zipkin (1984) , [2] Dror, Ball, & Golden (1985), [3] Bard, Huang, Jaillet, & Dror (1998), [4] Qu,
Bookbinder, & Iyogun (1999), [5] Kleywegt, Nori, & Savelsberg (2002), [6] Campbell & Savelsbergh (2004), [7] Chiou (2005), [8] Liu & Lin (2005), [9] Archetti, Bertazzi, Laporte, & Speranza (2007), [10] Savelsbergh & Song (2008), [11] Coelho, Cordeau, & Laporte (2012), [12] Ramkumar, Subramanian, Narendran, & Ganesh (2012), [13] Coelho & Laporte (2013), [14] Aksen, Kaya, Salman, & Tüncel (2014), [15] Cordeau, Laganà, Musmanno, & Vocaturo (2015), [16] Cheng, Qi, Wang, & Zhang (2016), [17] Chitsaz, Divsalar, & Vansteenwegen (2016), [18] Cheng, Yang, Qi, & Rousseau (2017), and [19] Peres, Repolho, Martinelli, & Monteiro (2017).
2 MIP = Mixed Integer Programming, IP = Inventory Problem, SA = Simulated Annealing, MILP = Mixed Integer Linear
Programming, ALNS = Adaptive Large Neighborhood Search, RVND = Randomized Variable Neighborhood Descent.
3.3.1 - Problem structure
The majority of reviewed IRP literature considers networks with a one-to-many topology supplying a single product. A one-to-many topology occurs in the case where a single, often central, facility or depot services a set of customers (Andersson et al., 2010). Savelsbergh and Song (2008) note that, even when multiple depots are considered, customers are almost always assigned to a single depot, decomposing the problem into multiple one-to-many problems. It is argued that, because of real-life complexities, such as insufficient production capacity at the supplier, this approach is not always feasible to solve real-life problems. To overcome the limitations presented by the regular one-to-many IRP, Savelsbergh and Song (2008) propose the IRP with continuous moves, IRP-CM, that allows for multi-day routes. A different type of topology is presented by the Combined Location Routing and Inventory Problem (CLRIP). In this problem class, the location of the depots are not given, but present additional decision variables. Liu & Lin (2005) propose a decomposition heuristic for the CLRIP that first solves the depot location-allocation problem and subsequently solves the IRP.
27 assigning customers to days and then solving the resulting VRP with satellite facilities (VRPSF) for all days. Several heuristics for the VRPSF are considered: a revised Clark & Wright (C&W) algorithm, a revised sweep algorithm, and a GRASP heuristic. The effectiveness of these solutions is tested on randomly generated problem instances, showing the C&W algorithm outperforming the other algorithms slightly (Bard et al., 1998). Coelho, Cordeau, and Laporte (2012) introduce the IRP with transshipment (IRPT), where products can be transported either from supplier to customer or from customer to customer. An ALNS heuristic, in combination with a network flow algorithm, is proposed to solve the IRPT (Coelho, Cordeau, & Laporte, 2012).
While most literature considers the distribution of a single product, Coelho and Laporte (2012) and Cordeau et al. (2015) extend this to a multi-product, multi-vehicle IRP (MMIRP). Although both papers attempt to solve the same problem, widely different solution approaches are used. Coelho and Laporte (2013) devised a branch-and-cut algorithm to give the exact solution. Whereas Cordeau et al. (2015) take a three-step decomposition approach: (1) constructing delivery plans, (2) determining delivery sequences, and (3) a re-optimization phase that used a MILP model to improve the solution. Ramkumar et al. (2012) combine a many-to-many topology with multiple different products and propose a MILP for the problem. Their solution is tested on four randomly generated datasets and one real-life case study which resulted in a cost reduction of more than 7% to the total current costs.
3.3.2 - Time horizon
The modeled time horizon dictates over which period of time the problem is optimized. Single period models solely focus on minimizing the costs over one period, while multi-period models consider the costs over a longer horizon (Moin & Salhi, 2007). While single period models are less complex than their multi-period counterparts, they often offer worse solutions. This is caused by the short-term
approaches’ tendency to postpone as many deliveries as possible, which is beneficial in the short term,
but has negative effects on the long-term planning (Campbell et al., 1998) (Moin & Salhi, 2007). Because of this, contemporary literature has a clear inclination towards multi-period models.
However, especially earlier contributions towards IRP literature still consider the single-period IRP, such as Federgruen and Zipkin (1984), one of the first papers to combine routing and inventory decisions. Federgruen and Zipkin (1984) attempt to minimize the combined transportation, holding, and shortage cost for one single period. Because just one period is considered, this problem can be seen as an extension of the VRP, which causes Federgruen and Zipkin (1984) to utilize many techniques also used in the VRP. The results of the combined approach were however much better than those acquired using regular VRP techniques: 6-7% cost reduction and 20% reduction of vehicles required (Federgruen & Zipkin, 1984).