http://wrap.warwick.ac.uk
Original citation:
Lockley, Robert, Ladds, Graham and Bretschneider, Till. (2014) Image based validation
of dynamical models for cell reorientation. Cytometry. doi 10.1002/cyto.a.22600
Permanent WRAP url:
http://wrap.warwick.ac.uk/67757
Copyright and reuse:
The Warwick Research Archive Portal (WRAP) makes this work of researchers of the
University of Warwick available open access under the following conditions.
This article is made available under the Creative Commons Attribution-NonCommercial
3.0 (CC BY-NC 3.0) license and may be reused according to the conditions of the
license. For more details see:
http://creativecommons.org/licenses/by-nc/3.0/
A note on versions:
The version presented in WRAP is the published version, or, version of record, and may
be cited as it appears here.
Image Based Validation of Dynamical Models
for Cell Reorientation
Robert Lockley,
1Graham Ladds,
2Till Bretschneider
1*
! Abstract
A key feature of directed cell movement is the ability of cells to reorient quickly in response to changes in the direction of an extracellular stimulus. Mathematical models have suggested quite different regulatory mechanisms to explain reorientation, raising the question of how we can validate these models in a rigorous way. In this study, we fit three reaction–diffusion models to experimental data ofDictyosteliumamoebae reorient-ing in response to alternatreorient-ing gradients of mechanical shear flow. The experimental read-outs we use to fit are spatio-temporal distributions of a fluorescent reporter for cortical F-actin labeling the cell front. Experiments performed under different conditions are fit-ted simultaneously to challenge the models with different types of cellular dynamics. Although the model proposed by Otsuji is unable to provide a satisfactory fit, those sug-gested by Meinhardt and Levchenko fit equally well. Further, we show that reduction of the three-variable Meinhardt model to a two-variable model also provides an excellent fit, but has the advantage of all parameters being uniquely identifiable. Our work demon-strates that model selection and identifiability analysis, commonly applied to temporal dynamics problems in systems biology, can be a powerful tool when extended to spatio-temporal imaging data. VC2014 The Authors. Published by Wiley Periodicals, Inc.
! Key terms
cell reorientation; Dictyostelium; actin; image based model fitting; spatio-temporal pattern formation; fluorescence microscopy; identifiability analysis
D
IRECTED cell motion is based on three functional modules (i) the formation of cellular protrusions driven by polymerization of actin, (ii) a mechanism to sense extracellular signals, for example, a gradient of chemoattractant, and direct protru-sions to the cell front, and (iii) polarization, which is the establishment of a front-rear axis, whereby myosin-II mediates retraction of the cell front-rear (1–3). The modular design of cell motility has resulted in it becoming a paradigm of systems biology. In particular, how these modules are integrated to allow cells to navigate in rapidly changing environments has become a focus of theoretical and computational research.Most models employ a Turing-like (4) local-excitation global-inhibition mecha-nism, whereby the stronger stimulation of the up-gradient cell end results in local autocatalytic activation of the cell front. At the same time, a fast propagating inhibi-tory mechanism renders the cell rear unresponsive to stimulation. The theory of reaction–diffusion models is well established and Meinhardt first implemented a model for cell reorientation on a circular domain to study how cells could regain sen-sitivity at the rear and thus are able to respond to changes in direction of a signaling gradient (5). Most recently, several groups have coupled the Meinhardt model with biophysical models of deformable contours to simulate the deformation and move-ment of cells in response to a signal gradient (6–8). Other models have been pro-posed to address specific questions of signal amplification, sensitivity, and adaptation (9–13).
1Warwick Systems Biology Centre, Senate House, University of Warwick, Coventry, CV4 7AL, United Kingdom 2Division of Biomedical Cell Biology,
Warwick Medical School, University of Warwick, Coventry, CV4 7AL, United Kingdom
Received 15 June 2014; Revised 2 October 2014; Accepted 6 November 2014 Grant sponsor: EPSRC through the Warwick Systems Biology Doctoral Training Centre; Grant sponsor: BBSRC; Grant number: BB/G01227X/1; Grant sponsor: Birmingham Science City Research Alliance; Grant sponsor: Wellcome Trust; Grant number: WT094131MA; Grant sponsor: Royal Society Research Grant.
Additional Supporting Information may be found in the online version of this article. *Correspondence to: Till Bretschneider, Warwick Systems Biology Centre, Senate House, University of Warwick, Coventry, CV4 7AL, United Kingdom.
E-mail: [email protected] Published online 00 Month 2014 in Wiley Online Library (wileyonlinelibrary.com) DOI: 10.1002/cyto.a.22600
VC2014 The Authors. Published by Wiley Periodicals, Inc. on behalf of The International Society for Advancement of Cytometry. This is an open access article under the terms of the Creative Commons Attribution NonCommercial License, which permits use, distribution and reproduction in any medium, provided the original work is properly cited and is not used for com-mercial purposes.
Here, we want to compare three representative models for cell reorientation, each of which employs a different regu-latory mechanism. The original model by Meinhardt (5), a model by Levchenko and Iglesias (13), and one by Otsuji et al. (12). We are more focused on the problem of model selection, so for their internal workings and their derivation, we refer the reader to an excellent review by Jilkine and Edlestein-Keshet which discusses, among others, all three models in detail (11).
In brief, the Levchenko model has been engineered to achieve perfect adaptation to spatially uniform stimuli, which result in a transient response only, before a new steady-state is achieved. In a gradient, persistent stimulation of a cell front is possible, without the need to temporarily break-down the pat-tern as in the Meinhardt model. The rationale behind the model by Otsuji et al. (12) is that many signaling components involved in gradient sensing, such as small GTPases of the Rho family are known to exist in an either active or inactive state. Whereas in the models by Meinhardt and Levchenko an increase in signal always causes a stronger response, mass con-servation in the Otsuji model takes into account that the total amount of signaling molecules is limited. Specific features of this model are the formation of a strong unique axis of cell polarization and an increased sensitivity at the cell front. The motivation for selecting these models was simply to investi-gate how more modern models compare to their ancestor, the Meinhardt model. As we wanted to use the same fitting approach for each model we limited ourselves to continuum reaction–diffusion equations, all of which, however, display quite distinct features in their behavior.
In all three models, some of the regulatory mechanisms can be loosely mapped to known biochemical signaling pathways, but all employ a minimal set of regulatory feedback loops, and therefore have a comparatively small number of parameters. This is an important requirement in terms of quantitative modeling that prevents over-fitting and enables selection of structurally identifiable models with unique solutions (14).
Here, we build on our previous work on quantifying actin dynamics in the cortex of moving cells using active con-tour based methods for cell segmentation and tracking (15–17). Using fluorescent reporters for polymerized actin as a proxy for cell front activation, we ask: (i) Can we validate different reaction–diffusion models by directly fitting models to time series image data of moving cells? (ii) Will we be able to identify unique sets of parameters?
M
ATERIALSA
NDM
ETHODSGeneral Laboratory Reagents
HL5 growth media containing 75 mM glucose was obtained from ForMediumTM (Hunstanton, UK). All other general reagents were purchased from Sigma-Aldrich (St Louis, MO) unless stated.
Experimental Data. The experimental data are fluorescence distributions of a reporter for F-actin (LimED-GFP) in the cortex ofDictyostelium(JH10) cells reorienting in alternating
gradients of shear flow as described in (18). Previously, we have shown that the response to shear stress is very similar to that toward a chemoattractant with cells producing a front against the flow. Cells were segmented and tracked using QuimP software [http://go.warwick.ac.uk] (15,19) and fluo-rescence sampled at 20 equidistant points along the cell cor-tex. All fluorescence data presented are normalized by dividing through the mean fluorescence in the cell body to account for differences in expression levels, fluctuations in laser intensity and bleaching. Details on microscopy are described in Dalous et al. (18).
Random Motility Experiments. Wild-type Dictyostelium
(AX2) cells expressing LimED-RFP were cultured at room temperature in HL5 media containing 75 mM glucose with appropriate antibiotics. Cells were washed twice with KK2 buffer and transferred to glass-bottomed imaging culture plates (Fisher Scientific UK, Loughborough, UK). Actin was visualized using a Personal DeltaVision microscope (Applied Precision, Issaquah, WA) comprising an Olympus UPlanSApo 1003, NA 1.4, oil immersion objective and a Photometric CoolSNAP HQ camera (Roper Scientific, Martinsried, Ger-many). Captured images were processed by iterative con-strained deconvolution using SoftWoRx (Applied Precession) and analyzed using ImageJ (20).
Long Duration Flow Experiments
Wild-typeDictyostelium (AX2) cells expressing ABP120-GFP as a marker for F-actin were cultured in HL5 media con-taining 75 mM glucose. Cells were washed with KK2 and after 1 h in shaking culture seeded into flow chambers (L3W3H 503530.2 mm3), with flow of buffer driven by an air pres-sure pump system (IB-10902, Ibidi, Martinsried, Germany). A 1 Pa shear flow was applied for 600 s, followed by a 120 s period of no flow. This cycle was repeated once. ABP120-GFP was imaged using a True Confocal Scanner Leica TCS SP5 microscope (Leica Microsystems, Milton Keynes, UK).
Model Fitting
Model fitting and analysis were performed in Potters-Wheel (21), a Matlab toolbox that offers advanced tools for identifiability analyses. The spatial reaction–diffusion models under investigation are systems of coupled, partial differential equations (PDE) with two or three variables. Using a finite difference approximation of the diffusion operator @2C=@x2# ðC
i2122Ci1Ci11Þ=ðDxÞ2, where Ci, Ci21 and Ci11denote fluorescence intensities at pointiand to the left
and right of it, with 1&i&N, andN520 being the number of grid points,Dxthe physical spacing between them, the sys-tem of PDEs can be transformed into a syssys-tem of N3V
coupled ordinary differential equations (ODEs),V being the number of variables. The problem is solved on a circular 1D domain with periodic boundary conditions by lettingC05CN
andCN115C1.
be adapted to sampling at arbitrary positions, then requiring interpolation between intensity values at previous time points. We simulate a spatial profile of shear flow input (source term) using s5ðdycosð2pðn21Þ=NÞÞ where dy is initially treated as a free parameter which describes the strength of the signal. Later,dyis replaced by an explicit polynomial function
dyðPÞ in terms of the absolute shear stress P. Node i5n
denotes the up-gradient position on the cell cortex. In the absence of a signaldyis set to zero.
Parameters are fitted by nonlinear least-square minimiza-tion using PottersWheel’s built-in Trust Region optimizaminimiza-tion, fitting in logarithmic parameter space (22,23). To avoid get-ting caught in local minima, models were fitted 10–25 times from different starting points. Where indicated, we fitted to different experimental conditions simultaneously, obtaining a combinedv2value.
Parameter Profile Likelihood Estimation
To determine the sensitivity and identifiability of param-eters, we used PottersWheel’s parameter profile likelihood estimation (PLE) tool (24). By iteratively varying a parameter
pi about its optimum value and refitting the remaining
parameters av2profile of the likelihood forp
ican be
gener-ated. Where this profile crosses a threshold, v2ða;dfÞ, lower
or upper limits for the confidence interval ofpican be found,
here at levela568%. If both limits exist, the parameter is con-sidered identifiable. A value ofdf51 yields point-wise confi-dence intervals, whereas for simultaneous confidence intervals, df equals the number of parameters. The latter is used to determine identifiability.
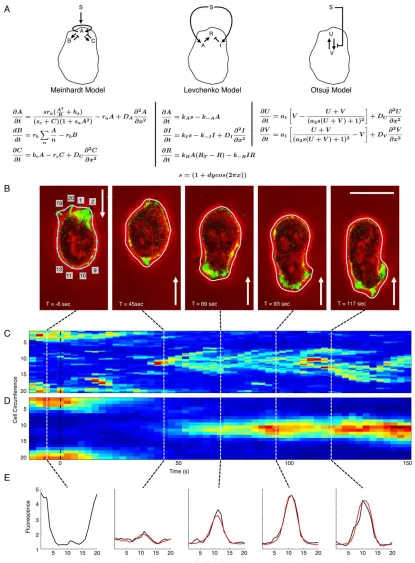
R
ESULTSOur goal is to validate commonly used reaction–diffusion models for cell reorientation by fitting them to time-series image data of cells under well-controlled experimental condi-tions. The reaction networks of the different models under investigation are depicted in Figure 1A with Sdenoting the extracellular signal (experimentally we use a gradient of shear flow (18)). Meinhardt’s model is based on one autocatalytic activator,A, that produces two inhibitors,B andC(5). The second inhibitor, C, was proposed as an extension to a two-variable model, consisting of onlyAandB, in order to achieve permanent sensitivity. In the Levchenko model, Spromotes simultaneous production of activatorAand inhibitorI, which act on a response elementR(13). The Otsuji model considers mass conservation of a signaling component, which can be either in an activated form, U, or inactivated, V, whereby S
promotes formation ofU(12).
Ultimately, activation of a cell front in response to an extracellular stimulus results in formation of a F-actin rich protrusion, which is why we consider F-actin as a reliable readout for front activation. TheDictyosteliumcell shown in Figure 1B responds toward shear flow of 2.1 Pa, with the F-actin label clearly marking the front facing the flow. Shear flow as signal input can be easily reversed, and the cell can be seen to reorient after changing the flow direction at t50 s.
The old front is rapidly degraded, while the new front facing the flow appears at'40 s after flow reversal.
Space-time plots of the cortical fluorescence sampled at 20 nodes allow capturing the entire dynamics in one plot (Fig. 1C). Normalizing the data with respect to the cell circumference has the advantage that data of multiple cells can be averaged, after synchronizing sequences with respect to the time of flow reversal. As illustrated in Figure 1D the population mean ofN
514 cells responding to 18 flow reversals, provides a clearer indication of F-actin disassembly and reassembly when com-pared to noisy single cell data. Later, we show that it is possible to fit single cell data, but for our initial model fitting we pro-ceed with population averages. Fitting to single cell data can become computationally demanding when fitting to many cells simultaneously. Figure 1E gives an example of how the fluores-cence profile of the averaged cell data along the normalized cell outline is fitted for selected time points using Meinhardt’s model. The fitting procedure starts with the flow reversal att5 0 s (For details on fitting see Materials and Methods).
The Meinhardt and Levchenko Model Both Fit the Shear-Flow Reorientation Data Well
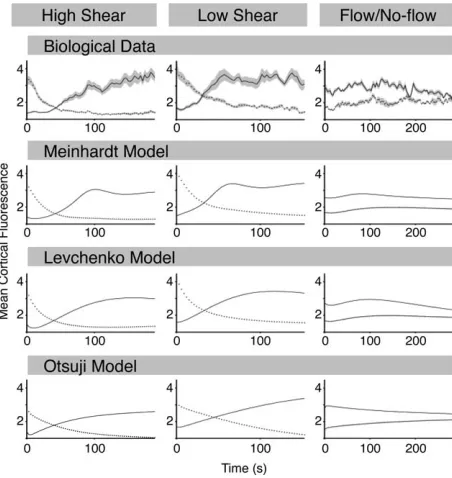
Having demonstrated how we extract experimental data in form of spatio-temporal maps of F-actin fluorescence and fit them to dynamical models we proceed to compare how each of the three different models could fit to three experi-mental conditions: reorientation of cells in response to high shear stress of 2.1 Pa; to low shear stress (0.9 Pa); and flow/ no-flow experiments where cells were first oriented under 2.1 Pa, with the flow subsequently being switched off resulting in slow depolarization of cells. These values were chosen since below 0.9 Pa cells respond by making U-turns instead of reversing their orientation and above 2.1 Pa they have difficul-ties remaining attached to the substratum. We fitted the data using the entire spatial fluorescence profile as shown in Figure 1E, but we summarize the data (Fig. 2) by only plotting the mean fluorescence of the two cell halves (up-gradient and down-gradient). Parameter values and initial conditions are given in Supporting Information Tables S1 and S2. It is appa-rent that disassembly of F-actin at the old front follows a sim-ple exponential decay under 2.1 and 0.9 Pa with half-lives of
T1/2538 s and 59 s, respectively; assembly of F-actin at the new front is faster under low shear stress of 0.9 Pa where it plateaus after 60 s (Fig. 2). Under the shear stress of 2.1 Pa there is a marked delay of about 30 s before actin polymeriza-tion begins leveling around 3 min. The flow/no-flow experi-ments show slow loss of orientation on the timescale of minutes, but initially there is a slight increase in F-actin after removal of the stimulus. Thus shear flow clearly promotes F-actin assembly, but interestingly, at the same time, a higher shear stress slows F-actin assembly. This could be either due to increased mechanical load on the F-actin network at higher shear stresses, or negative feedback in the biochemical signal transduction pathway.
Shear flow affects the time-scales of loss and gain of fluo-rescence in intricate ways. Initially, we avoided dealing with absolute values of shear stresses as signal input, and let the
external signal strength dy be an unknown function of P, determiningdy(P) forP50.9 Pa andP52.1 Pa when data fitting. All models were fitted to the three different experi-ments simultaneously to increase the selective pressure on each model. Both the Meinhardt and Levchenko models were able to capture the loss of fluorescence at the old cell front but both provided better fits for the large shear stress (T1/2536 s for P52.1 Pa,T1/2545 s forP50.9 Pa), with the Otsuji
model having problems to capture the fast decrease (T1/2 5
83 s forP52.1 Pa,T1/25110 s for P50.9 Pa). The same
was true for the gain of fluorescence at the newly activated front, where the Meinhardt and Levchenko models outper-formed the Otsuji model. A similar trend was also observed when analysing the flow/no-flow experiments. The overall goodness of fit was summarized byv2values of 178, 156, and
361 for the Meinhardt, Levchenko, and Otsuji models, respec-tively. Given the deficiencies of the Otsuji model to fit the reorientation data our further investigations concentrate only on the Meinhardt and Levchenko model.
Identifiability Analysis
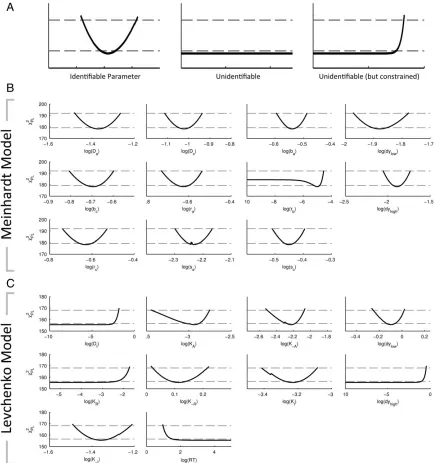
The model fitting described previously provides parame-ters that maximize the goodness of fit, however, it is important to consider if these are the only combination of parameters that can explain the data. To address this, we have used profile likeli-hood estimations, where values for one particular parameter are changed over a defined region and the model is repeatedly refitted to compute how changing the parameter affects the goodness of fit. Identifiable parameters are characterized by a parabolicv2profile which indicates a unique, optimal
parame-ter value (Fig. 3A). Unidentifiable parameparame-ters do not affect the quality of the fit, and consequently have a flat profile; they might however be constrained by an upper or a lower limit. Unidentifiability can be linked either to the structure of a model, requiring changes to the model itself or a lack of quality experimental data causing practical unidentifiabilities. The pro-file likelihoods for the Meinhardt model show that all but one parameter were identifiable withrbpractically non identifiable.
In the Levchenko model four out of ten parameters were practi-cally unidentifiable.
A Simplified Two-Variable Version of the Meinhardt Model is Uniquely Identifiable
As shown previously, both, the models by Meinhardt and Levchenko were not fully identifiable. Different approaches exist to make models identifiable, changing either the model or the experimental design (24). In the Meinhardt model, we observed that the first inhibitor,B, remained close to 1, thus we first con-sidered reducing the model to two variables, setting@B=@t to zero. Ideally, it would still capture the same dynamics ofAbut become identifiable as the previously unidentifiable parameterrb
was dropped. However, we were unable to find a single value for
Baround 1, nor a simple linear expression in terms of the exter-nal shear stressP, which fitted all three experimental conditions simultaneously. We, therefore, determined optimum values ofB
for each condition and fitted a quadratic, BðPÞ511
b0ðP21b1PÞ, in terms ofP, which made it possible to simplifydy
tody(0)50, anddyðPÞ5const50:0128. Contrary to the origi-nal three-variable Meinhardt model, the reduced model has the advantage that it depends explicitly on the external shear stress. In principle, the exact nature of B(P) could be tested through fit-ting additional experiments with different shear stressesP, which however is beyond the scope of the current study.
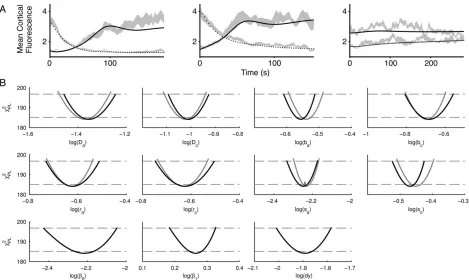
We next performed profile likelihood estimations (Fig. 4A) for multi-experiment fits of the two-variable model to the same three experimental conditions as in Figure 2. The two-variable model generated a similar good fit (v25184
com-pared tov25178 for the three-variable model, half-lives for
the loss of F-actin at the old front are almost identical). More-over the parameter sets obtained when fitting were also similar between the two and three-variable model (Supporting Infor-mation Table S1 and Fig. 4B).
Using the Models to Make Predictions About the Persistence of Front Activation
[image:6.612.66.292.85.324.2]Both, the Meinhardt and the Levchenko models fitted shear flow reversals reasonably well. We wanted to test whether we would be able to predict the outcome of a new experiment
Figure 2. Actin relocalization data enables comparison of three
proposed models of cell polarity: to provide a comparison of repolarization cells were split into two halves such that the front (solid line) was determined using the average cortical fluores-cence obtained from the nodes 6–15 as illustrated in Figure 1B. The average cortical fluorescence for the back half of the cell (dot-ted line) was determined from nodes 1–5 and 16–20. Biological data was obtained as described in (18) for a high shear stress (P5 2.1 Pa), a low shear stress (P50.9 Pa) and cessation of flow. Mean data for the high shear stress was obtained from 18 responses from 14 cells, for the low shear stress 10 responses from 5 cells was analyzed, while 13 responses from 9 cells are shown in the cessation data set. For all data the shaded area rep-resents standard error of the mean. Models as defined in Figure 1 were simultaneously fitted to all biological data sets using Pot-tersWheel (see Methods). All parameters were conserved between data sets with the exception ofdy, the asymmetry of the external stimulus. The goodness of fit,v2, is 178, 155, and 361 for
the Meinhardt, Levchenko, and Otsuji models, respectively.
using the sets of parameters obtained previously. We exposed a cell to two cycles of flow-induced (1 Pa) polarization and observed a persistent migration of the cell toward the flow source (Fig. 5A). Cessation of the flow for 2 min caused a loss of polarity. We performed simulations where we first wanted to qualitatively reproduce the persistent activation of the cell front as seen by the steady migration of the example cell for 10 min (Fig. 5B). These were initialized with uniform conditions and the system equilibrated, before replicating the signal behavior
detailed above. Using the parameter set obtained in Figure 3, the Levchenko model failed to produce a stable front. To obtain a stable front a rather drastic change to the model was required, for example, increasing D1 by four orders of magnitude and k2A by a factor of 10. (Supporting Information Table S1 and
[image:7.612.89.523.84.547.2]Fig. 5C). Using the parameter set obtained in Figure 4 for the modified Meinhardt model, a single front was obtained but it rapidly split into three. A single persistent front could be obtained by reducing diffusion of the inhibitorCby 20% (Fig.
Figure 3. Profile likehood estimates for the Meinhardt and Levchenko models of cell polarity: (A) representative plots of profile likelihood
estimation (PLE) analysis for example parameters demonstrating identifiable, unidentifiable and unidentifiable (but constrained) as defined by (24). PLE (v2values) together with the point wise (dashed lower horizontal line) and simultaneous confidence levels (dashed
upper horizontal line). The intersection where the PLE crosses the simultaneous confidence levels yields the lower and upper boundary for the simultaneous confidence intervals. A parameter is identifiable if both confidence intervals are finite as illustrated; (B) PLE analysis of Meinhardt model as defined in Figure 1. All parameters with the exception ofrbare identifiable; and (C) PLE analysis of Levchenko
5D). This new constraint does not compromise the goodness of fit for the original repolarization data of Figure 4 (newv25182
compared tov25184 before).
Fitting Spontaneous Front Activation in Randomly Migrating Cells
Previously, we aggregated and synchronized data from multiple cells to obtain averaged data where noise is signifi-cantly reduced. Next, we attempted to simultaneously fit sin-gle cell data of randomly migrating Dictyostelium cells to determine how the models performed on more complex and noisy data (Figs. 6A and 6B). We fitted our biological data using both the Meinhardt and Levchenko models. Whereas the models are deterministic, the observed random patterns are clearly driven by noise. By treating the initial activator concentrations as free parameters, we only account for noise at the start of the time series.
We observed that for the Meinhardt model four parame-ters were an order of magnitude lower when compared to parameters obtained in Figure 5 (Supporting Information Table S1), three were of the same order andDC could
essen-tially be set to zero. Parameters in the Levchenko model also vary greatly between reorientation and random motility experiments (Supporting Information Table S1).
Both models captured some of the intrinsic dynamics surprisingly well (Figs. 6A, and 6B): (i) a front which abruptly
disappears, (ii) a front which splits into two, and (iii) a broader low intensity F-actin crescent at the cell rear. Regions IV and VI of a second cell (Fig. 6B) again resemble front split-ting, while region V denotes the merger of two fronts. Fitting reaction-diffusion models to image data has been successfully applied in image enhancement in many areas (25), Our exam-ple shows that the same concepts, usually applied to single images, can be extended in a straight-forward manner to fil-tering time series image data, thus aiding the model-based analysis of complex stochastic time-series data.
D
ISCUSSIONA number of sophisticated mathematical models that cou-ple models for cell orientation to cell deformation have recently been published (6–8). Interestingly, they all employ the original model for cell orientation by Meinhardt (5), which as we have shown demonstrates good agreement with experimental data of
Dictyosteliumcells responding to three different experimental conditions (18). Significantly, the model is able to make reason-able predictions of cortical F-actin dynamics during cell reor-ientation for up to 2 min, which is remarkable given that the turnover of the entire F-actin system inDictyosteliumis on the timescale of seconds (26,27).
[image:8.612.72.541.83.363.2]Chemotactic receptors have been very well characterized but only recently has light been shed on putative mechanosen-sors, in particular PKD2 Ca21 channels (28). Previously we
Figure 4. A fully identifiable reduced Meinhardt model replicates actin repolarization behavior: (A) fitting of a reduced Meinhardt model
to the biological data described in Figure 2. Model has been reduced as described in the text and was simultaneously fitted to all biological data sets using PottersWheel (v25184) and (B) PLE analysis of the reduced Meinhardt model from (A). PLE analysis was performed as
described in Figure 3 where solid lines represents the PLE and the thresholds are marked by dashed lines. Shown in gray are the con-served parameters between the reduced Meinhardt model and the one analyzed in Figure 3. Values from Figure 3 have been modified through the addition ofDv255:833 to facilitate a direct comparison.
have shown that inDictyosteliumcells reversal of cell polarity in response to a shear flow reversal is very similar to the response seen when reversing a chemotactic gradient. This suggests that both sensor systems might be linked to one common pathway regulating actin polymerization and cell polarization (18). It is interesting to note that the models originally developed to investigate chemotaxis are equally applicable to mechanotaxis.
The estimation of model parameters from image data and identifiability analysis in the context of diffusion processes is an emerging area of research (29). We have reduced the Mein-hardt model to a two-variable model, which is uniquely identi-fiable. Although there is no direct correspondence with known
biochemical pathways, the activator variable in the model cap-tures, remarkably well, the dynamics of F-actin assembly. The parameters we determined yield biochemically realistic time-scales of cell front activation and repolarization, which will be appreciated by modelers trying to build more complex models that integrate actin dynamics and protrusive behavior.
[image:9.612.116.500.84.485.2]The behavior of the reduced two-variable Meinhardt model is almost identical to the three-variable model. Although the second inhibitor in the Meinhardt model is often regarded as an improved extension of a model with only one inhibitor, adding permanent sensitivity, its local action can completely replace the first global inhibitor. In line with
Figure 5. Simulated responses to long duration stimulation: (A) image sequence of wild-type (AX2) cells expressing ABP120-GFP (green).
Cells were imaged for a total period of 1,560 s. Following an initial rest period (120 s) cells were exposed to a continuous flow for a dura-tion of 600 s. The cycle was then repeated for a further 720 s. Arrows indicate presence and the direcdura-tion of a shear stressP51 Pa; (B) Position of the cell front (relative to the bottom of the image) throughout the time course. Asterisks denote times of the five individual images shown. Scale bar, 10lm; (C) simulations of the biological data in (A) using the Levechenko model. The arrow denotes the position where the external signal is the strongest. Adjustment of model parametersDIandk–Ain the Levchenko model allows a persistent front to
that we found that the first inhibitor remained constant over time, justifying its removal as an independent variable. Simi-larly the Levchenko model achieves the same behavior using only one inhibitor, and also captures many aspects of F-actin dynamics during reorientation and random motility.
We have shown that care is needed when trying to make predictions as initially we were unable to achieve long-term persistence of front activation. Both the Meinhardt and Lev-chenko models required changes in their parameters. Signifi-cantly, this helped to constrain the models further; indeed the Meinhardt model was still able to fit our original set of data under the new constraint.
[image:10.612.140.472.81.522.2]Randomly migrating cells display several competing fronts, which aids the probing of their environment by increasing the sampling frequency. The presence of a strongly orientating stimulus such as a chemotactic agent or shear flow requires cells to enter a different state where only a single front survives. Thus, it is expected that this new state is reflected by changes in parameters. In theory, going from several fronts to a single one is equivalent to increasing the wavelength of the pattern, which can be achieved by increasing activator diffusion. Here we con-firm, for the Meinhardt model, that the diffusion of the activa-tor in randomly migrating cells is by a facactiva-tor of 20 lower, when compared to the shear flow experiments. The rate of inhibitor
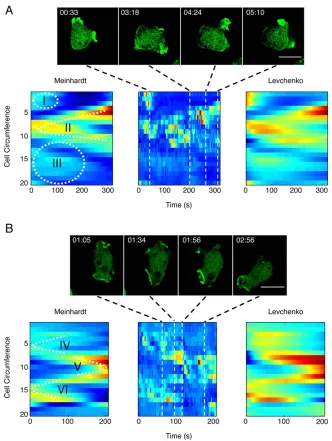
Figure 6. Comparison of the reduced Meinhardt and Levchenko models in simulating actin localization of unstimulated cells: two image
sequences of representative cells (AandB) in the absence of an external signal. Filamentous actin was visualized in wild-type (AX2) cells expressing LimED-RFP (green). QuimP 11b analysis performed as described in Figure 1 was used to generate cell cortex fluorescence data (central time–space plot) that was used for fitting both the reduced Meinhardt (v251485) and Levchenko (v251399) models. Regions of
interest, highlighted by roman numerals, illustrate the ability of each model to capture biological phenomena. Scale bar, 10lm. [Color fig-ure can be viewed in the online issue, which is available at wileyonlinelibrary.com.]
diffusion becomes essentially negligible, suggesting a qualitative change in the model such that there is no lateral inhibition of activated peaks any more. This lack of lateral inhibition results in patterns of activation which are not evenly spaced, which is in fact a notable feature of random migration. Therefore, the changes in fitted diffusion rates are in agreement with the experimental observations. At the same time, fronts in ran-domly migrating cells are less stable, which explains why some of the kinetic parameters are also required to change. Interpre-tation of the exact changes is however difficult. Although the rates of production and decay of the local inhibitorCare, for example, reduced by a factor of 4, its local concentration can still increase rapidly, because it does not diffuse. This might contribute to the observed shorter lifetime of activated fronts in randomly migrating cells. Recently, membrane tension has been discussed as an inhibitory mechanism restricting the growth of protruding fronts, which because of its physical nature could explain very fast diffusive spreading (30,31). Therefore, one possibility supported by the change in model parameters could be that cells globally increase membrane ten-sion when switching from random migration to a strongly polarized mode of movement.
Similarly to our example of modeling cell orientation, inverse modeling of spatio-temporal cellular dynamics has been employed in the context of photobleaching or photoactivation experiments to study the mobility, mass transport, or binding of cellular constituents (32–34). Perturbing the intrinsic dynamics by photobleaching or activation could nicely complement our approach, thereby trying to match diffusion in the model with the mobility of molecular players known to be involved in sig-naling to the actin cytoskeleton. More detailed biological models exist for receptor/G-protein networks, and signaling to the downstream modules controling polarity/myosin-II contractility and actin reorganization (35). Recently, Skoge et al. (36) have developed a model for Ras activation in chemotaxing Dictyoste-liumcells which includes memory effects to explain why cells do not reverse direction in the wake of a wave of chemoattractant. The model consists of seven equations with 24 parameters and has been successfully fitted to activated Ras levels measured at the front and the back of cells. We believe that our proposed framework will be a valuable tool to compare this and other recent models in the future. For example, to learn what degree of complexity is required to explain particular experimental findings which cannot be easily explained by the very simple models discussed in the current paper.
A
CKNOWLEDGMENTSWe thank Ingrid Tigges (Warwick Systems Biology) for providing the experimental data in Figure 5 and Jeremie Dalous for performing the shear flow experiments and valua-ble discussions.
L
ITERATUREC
ITED1. Kay RR, Langridge P, Traynor D, Hoeller O. Changing directions in the study of che-motaxis. Nat Rev Mol Cell Biol 2008;9:455–463.
2. Insall RH. Understanding eukaryotic chemotaxis: A pseudopod-centred view. Nat Rev Mol Cell Biol 2010;11:453–458.
3. Ridley AJ. Life at the leading edge. Cell 2011;145:1012–1022.
4. Turing AM. The chemical basis of morphogenesis. Philos Trans R Soc Lond B Biol Sci 1952;237:37–62.
5. Meinhardt H. Orientation of chemotactic cells and growth cones: Models and mech-anisms. J Cell Sci 1999;112:2867–2874.
6. Neilson MO, Veltman DM, van Haastert PJ, Webb SD, Mackenzie JA, Insall RH. Chemotaxis: A feeback-based computational model robustly predicts multiple aspects of real cell behavior. PLoS Biol 2011;9:e1000618.
7. Elliott CM, Stinner B, Venkataraman C. Modelling cell motility and chemotaxis with evolving surface finite elements. J R Soc Interface 2012;9:3027–3044.
8. Tweedy L, Meier B, Stephan J, Heinrich D, Endres RG. Distinct shapes determine accurate chemotaxis. Sci Rep 2013;3:2606.
9. Shi C, Huang CH, Devreotes PN, Iglesias PA. Interaction of motility, directional sensing, and polarity modules recreates the behaviors of chemotaxing cells. PLoS Comput Biol 2013;9:e1003122.
10. Shibata T, Nishikawa M, Matsuoka S, Ueda M. Intracellular encoding of spatiotem-poral guidance cues in a self-organizing signaling system for chemotaxis in Dictyoste-liumcells. Biophys J 2013;105:2199–2209.
11. Jilkine A, Edelstein-Keshet L. A comparison of mathematical models for polarization of single eukaryotic cells in response to guided cues. PLoS Comput Biol 2011;7: e1001121.
12. Otsuji M, Ishihara S, Co C, Kaiguchi K, Mochizuki A, Kuroda S. A mass conserved reaction–diffusion system captures properties of cell polarity. PLoS Comput Biol 2007; 3:e108.
13. Levchenko A, Iglesias PA. Models of eukaryotic gradient sensing: application to che-motaxis of amoebae and neutrophils. Biophys J 2002;82:50–63.
14. Chis OT, Banga JR, Balsa-Canto E. Structural identifiability of systems biology mod-els: A critical comparison of methods. PLoS One 2011;6:e27755.
15. Dorman D, Libotte T, Weijer CJ, Bretschneider T. Simultaneous quantification of cell motility and protein–membrane-association using active contours. Cell Motil Cyto-skeleton 2002;52:221–230.
16. Etzrodt M, Ishikawa HC, Dalous J, M€uller-Taubenberger A, Bretschneider T, Derisch G. Time-resolved responses to chemoattractant, characteristic of the front and tail of Dictyosteliumcells. FEBS Lett 2006;580:6707–6713.
17. Bosgraaf L, van Haastert PJ, Bretschneider T. Analysis of cell movement by simulta-neous quantification of local membrane displacement and fluorescent intensities using Quimp2. Cell Motil Cytoskeleton 2009;66:156–165.
18. Dalous J, Burghardt E, Muller-Taubenberger A, Bruckert F, Gerisch G, Bretschneider€ T. Reversal of cell polarity and actin–myosin cytoskeleton reorganization under mechanical and chemical stimulation. Biophys J 2008;94:1063–1074.
19. Tyson RA, Epstein DBA, Anderson KI, Bretschneider T. High resolution tracking of cell membrane dynamics in moving cells: An electrifying approach. Math Model Nat Phenom 2010;5:34–55.
20. Rasband WS. Image J, U. S. National Institutes of Health, Bethesda, Maryland, USA, http://imagej.nih.gov/ij/, 1997–2014.
21. Maiwald T, Eberhardt O, Blumberg J. Mathemtical modeling of biochemical systems with PottersWheel. Methods Mol Biol 2012;880:119–138.
22. Coleman TF, Li Y. An interior trust region approach for nonlinear minimization sub-ject to bounds. SIAM J Optim 1996;6:418–445.
23. Coleman TF, Verma A. A preconditioned conjugate gradient approach to linear equality constrained minimization. Comput Optim Appl 2001;20:61–72. 24. Raue A, Kreutz C, Maiwald T, Bachmann J, Schilling M, Klingm€uller U, Timmer J.
Structural and practical identifiability analysis of partially observed dynamical mod-els by exploiting the profile likelihood. Bioinformatics 2009;25:1923–1929. 25. Weickert J. Anisotropic diffusion in image processing. Germany: Teubner Stuttgart;
1998.
26. Diez S, Gerisch G, Anderson K, M€uller-Taubenberger A, Bretschneider T. Subsecond reorganization of the actin network in cell motility and chemotaxis. Proc Natl Acad Sci USA 2005;102:7601–7606.
27. Bretschneider T, Diez S, Anderson K, Heuser J, Clarke M, M€uller-Taubenberger A, K€ohler J, Gerisch G. Dynamic actin patterns and Arp2/3 assembly at the substrate-attached surface of motile cells. Curr Biol 2004;14:1–10.
28. Lima WC, Vinet A, Pieters J, Cosson P. Role of PKD2 in rheotaxis inDictyostelium. PLoS One. 2014;9(2):e88682.
29. Hock S, Hasenauer J, Theis FJ. Modeling of 2D diffusion processes based on micros-copy data: Parameter estimation and practical identifiability analysis. BMC Bioinfor-mat. 2013;14 Suppl 10:S7.
30. Graziano BR, Weiner OD. Self-organization of protrusions and polarity during eukaryotic chemotaxis. Curr Opin Cell Biol 2014;30:60–67.
31. Tyson RA, Zatulovskiy E, Kay RR, Bretschneider T. How blebs and pseudopods cooperate during chemotaxis. Proc Natl Acad Sci USA. 2014;111(32):11703–11708. 32. Sadegh-Zadeh K, Montas HJ, Shirmohammadi A. Identification of biomolecule
mass transport and binding rate parameters in living cells by inverse modeling. Theor Biol Med Model 2006;3:36.
33. Ulrich M, Kappel C, Beaudouin J, Hezel S, Ulrich J, Eils R. Tropical – Parameter esti-mation and simulation of reaction–diffusion models based on spatio-temporal microscopy images. Bioinformatics 2006;22:2709–2710.
34. Tardy Y, McGrath JL, Hartwig JH, Dewey CF. Interpreting photoactivated fluorescence microscopy measurements of steady-state actin dynamics. Biophys J 1995;69:1674–1682. 35. Artemenko Y, Lampert TJ, Devreotes PN. Moving towards a paradigm: Common
mechanisms of chemotactic signaling inDIctyosteliumand mammalian leukocytes. Cell Mol Life Sci 2014;71:3711–3747.