Original citation:
Eickhoff, Simon B., Nichols, Thomas E., Laird, Angela R., Hoffstaedter, Felix, Amunts, Katrin, Fox, Peter T., Bzdok, Danilo and Eickhoff, Claudia R.. (2016) Behavior, sensitivity, and power of activation likelihood estimation characterized by massive empirical simulation.
NeuroImage, 137. pp. 70-85.
Permanent WRAP URL:
http://wrap.warwick.ac.uk/81170
Copyright and reuse:
The Warwick Research Archive Portal (WRAP) makes this work by researchers of the University of Warwick available open access under the following conditions. Copyright © and all moral rights to the version of the paper presented here belong to the individual author(s) and/or other copyright owners. To the extent reasonable and practicable the material made available in WRAP has been checked for eligibility before being made available.
Copies of full items can be used for personal research or study, educational, or not-for-profit purposes without prior permission or charge. Provided that the authors, title and full bibliographic details are credited, a hyperlink and/or URL is given for the original metadata page and the content is not changed in any way.
Publisher’s statement:
© 2016, Elsevier. Licensed under the Creative Commons Attribution-NonCommercial-NoDerivatives 4.0 International http://creativecommons.org/licenses/by-nc-nd/4.0/
A note on versions:
The version presented here may differ from the published version or, version of record, if you wish to cite this item you are advised to consult the publisher’s version. Please see the ‘permanent WRAP URL’ above for details on accessing the published version and note that access may require a subscription.
Behavior, Sensitivity, and power of activation likelihood
estimation characterized by massive empirical simulation
Simon B. Eickhoff
1,2, Thomas E. Nichols
3, Angela R. Laird
4, Felix Hoffstaedter
1,2,
Katrin Amunts
1,5, Peter T. Fox
6, Danilo Bzdok
7,8,9,*,Claudia R. Eickhoff
1,7,*1 Institute for Neuroscience and Medicine (INM-1), Research Center Jülich, Germany
2 Institute of Clinical Neuroscience and Medical Psychology, Heinrich-Heine University
Düsseldorf, Germany
3
Department of Statistics and Warwick Manufacturing Group, University of Warwick,
Coventry, UK
4 Department of Physics, Florida International University, USA
5 C & O Vogt Institute for Brain Research, Heinrich-Heine University Düsseldorf, Germany
6 Research Imaging Institute, University of Texas Health Science Center at San Antonio, USA
7 Department of Psychiatry, Psychotherapy and Psychosomatics, RWTH Aachen University
Hospital, Germany
8
JARA, Translational Brain Medicine, Aachen
9
Parietal team, INRIA, Neurospin, bat 145, CEA Saclay, 91191 Gif-sur-Yvette, France
* equal contributions
*6. ManuscriptAbstract
Introduction
For more than two decades, functional imaging using Positron-Emission Tomography (PET) and in particular functional Magnetic Resonance Imaging (fMRI) have provided ample information about the location of cognitive, sensory and motor processes in the human brain (Bandettini, 2012; Poldrack, 2012; Rosen and Savoy, 2012). Neuroimaging clinical populations have yielded unprecedented insight into the localization of structural and functional aberrations within the brains of patients with all kinds of neurological and psychiatric disorders (Bullmore, 2012). In spite of its undisputed success, neuroimaging findings carry several important limitations (Weinberger and Radulescu, 2015). The number of participants sampled by neuroimaging experiments have substantially increased since the late 1990’s when fewer than a dozen participants were the norm, but are still comparably small relative to other fields of biological and medical sciences (Button et al., 2013). Hence, results from small-data studies are likely to be highly variable. Additionally, the measured signals are indirect hemodynamic proxies rather than direct measures of neuronal activity (Logothetis and Wandell, 2004). Furthermore, the substantial analytic flexibility of neuroimaging pipelines also leads to low reliability and reproducibility of neuroimaging findings (Carp, 2012b; Glatard et al., 2015; Wager et al., 2009). The logistic expenses of neuroimaging studies usually discourage the performance of confirmatory or supplementary experiments. This results in publication of isolated findings, further aggravating the problem of low reproducibility and false positive findings. Finally, most current neuroimaging studies, more specifically their discussion, may be considered overgeneralizations of context-specific findings. Each investigation into the neuronal correlates of psychological phenomena or pathological states requires operationalization of the experiment, involving choices on the nature of psychological task, the displayed stimuli, the timing and arrangement of individual trials, their modeling in the statistical analysis and the assessed contrast (Carp, 2012a; Rottschy et al., 2012). As an important consequence, the ensuing coordinates of significant effects are conditioned by a large number of subjective selections by the investigator. Yet, they are discussed and cited as neuronal correlates representative of general psychological domains (e.g., working memory) or pathophysiological mechanisms (e.g., dysfunctional working memory in schizophrenia). It may hence come as no surprise that brain regions reported to be associated with a given psychological process may be found almost anywhere in the brain (Cieslik et al., 2015; Nee et al., 2007).
Activation likelihood estimation (ALE) has originally been introduced more than a decade ago (Turkeltaub et al., 2002). It is among the most commonly used algorithms for coordinate-based meta-analyses and it is part of the BrainMap software suite (Laird et al., 2011a; Laird et al., 2009) (http://brainmap.org/ale). The key idea behind ALE is to not treat activation foci reported in neuroimaging studies as dimensionless points but as spatial probability distributions centered at given coordinates. This approach thus accommodates the spatial uncertainty associated with neuroimaging findings by using the reported coordinates as the best point estimator but at the same time employing a (Gaussian) spatial variance model (Eickhoff et al., 2009b). ALE maps are then obtained by computing the union of activation probabilities across experiments for each voxel (Turkeltaub et al., 2012). Finally, true convergence of foci is distinguished from random clustering of foci (i.e., noise) by testing against the null-hypothesis of random spatial association between experiments (Eickhoff et al., 2012; Turkeltaub et al., 2002).
In addition to previously frequent but now generally discouraged reports of uncorrected p-values, it is possible to account for multiple comparisons in the whole-brain setting by three approaches:
a) Family-wise error correction on the voxel level controls the chance of observing a given Z-value if foci were randomly distributed (Eickhoff et al., 2012).
b) Cluster-level family-wise error correction involves the use of an uncorrected cluster-forming threshold and employing a cluster-extent threshold that controls the chance of observing a cluster of that size if foci were randomly distributed (Eickhoff et al., 2012; Woo et al., 2014).
c) Correction for multiple comparisons using the false-discovery rate (Laird et al., 2005; Wager et al., 2007) has also been frequently employed, although this method may be less appropriate for neuroimaging data (Chumbley and Friston, 2009).
Another question that frequently comes up when planning, discussing or reviewing meta-analysis projects pertains to the necessary sample size, i.e., number of experiments that is needed to perform robust meta-analyses. In our view, this question may be investigated along two different aspects: First, is there a lower bound such that meta-analyses involving fewer experiments may not be considered valid? Second, can we provide power-calculations for ALE meta-analyses?
The present investigation addresses these questions by means of massive simulations of ALE analyses. These systematically vary the overall number of experiments and that of experiments
activating the simulated “true” location. Four types of significance testing are then performed on the more than 120,000 simulated ALE analyses: voxel-level family-wise error correction [FWE]; cluster-level family-wise error correction [cFWE]; voxel-level false discovery rate correction [FDR]; and uncorrected thresholding at p<0.001 with an additional extent threshold of 200 mm3. This allowed us to extend the scope of this work to a comparison of the influence of these methods on sensitivity, ensuing cluster sizes, the number of incidental clusters and statistical power.
In summary, the presented empirical simulations should provide a comprehensive overview on the behavior of ALE meta-analyses in addition to answering the key question, i.e., “how many experiments
Methods & Results
Experimental and conceptual setting
To avoid the ambiguous word “study”, there is a preference for the terms “paper” for an entire published scientific work and “experiment” for the individual comparisons reported therein. Even though the present simulation does not rely on the paper unit but on sets of distinct experiments to be assessed for convergence, we retain the general terminology for the sake of clarity.
For all performed simulations, we selected the ground-truth location (i.e., the hypothetical “true”
location of the effect of interest) to be at MNI coordinates -42 / 32 / 26, situated in the posterior part of the left middle frontal gyrus, without any particular motivation. Each simulation then entailed a variable number of experiments among the total numbers of experiments in that particular simulation, which activated at a location around this coordinate. That is, each simulation contained a certain number of experiments that featured activation foci in the target region, but importantly, these activation foci were not all located precisely at the target-location but rather randomly spread through the vicinity of this coordinate. This spatial spread captures the random variations of reported neuroimaging activation findings on a particular topic around a supposed true location of the underlying effect. For each
combination of “total number of experiments” and “experiments activating the target-location”, we
generated 500 simulations using empirically derived spread parameters as outlined next.
convergence obtained from ALE analyses of the different datasets as the best estimators of the true effect and quantified the spatial spread around these.
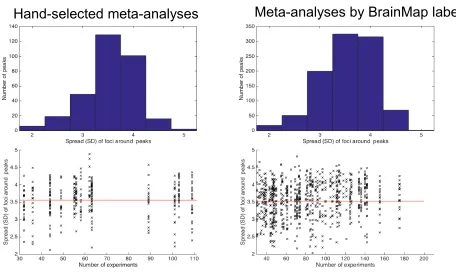
As illustrated in Figure 1, the average of the standard deviation sigma reflecting the spread of contributing foci to a peak location was just over 3.5 mm, corresponding to a FWHM of ~9.5 mm. In spite of the differences between both pools of datasets, our assessment furthermore showed that for the vast majority of peaks from both hand-coded and automatically generated meta-analyses, the contributing experiments feature a spread between 3 and 4 mm. Small numbers of peaks showed spreads up to 2 and 5 mm, respectively. Importantly, these findings seem independent of the number of experiments that constitute the respective meta-analyses. Consequently, we configured the 500 simulations for each combination of “total number of experiments” and “experiments activating the
[image:7.612.63.519.320.594.2]target-location” to used spreads (i.e., sigma parameter of the generated Gaussian distributions) of 2 mm (50 times), 3 mm (200 times), 4 mm (200 times) and 5 mm (50 times) around the true location of the synthetic activation blobs. In this context, we would like to acknowledge, that both the computation of the spatial spread as well as the generation of the simulations are based on the assumption of stationary Gaussian distributions, i.e., the same assumptions that also underlie ALE. This is not only a strong assumption but necessary in the absence of voxel- wise empirical data on spatial uncertainty, but may also yield to somewhat optimistic estimates of sensitivity and power.
Figure 1: Evaluation of the activation spread to be used in the simulations. We assessed 15 hand-coded datasets for topic-based ALE meta-analyses (left side) as well as 105 datasets defined by combinations of the Behavioral Domain and Paradigm class meta-data from BrainMap (right side). After identifying the principal significant peaks in the ALE meta-analysis map, we computed the standard deviation of foci that contributed to that peak. In spite of the differences between both sets of meta-analyses with respect, they show homogeneity with the contributing experiments with a similar concentration (3-4 mm standard deviation) in each case (upper panels). Importantly, this spread seems independent of the number of experiments that constitute the respective meta-analyses (lower panels). Based on these data, the 500 simulations used spreads of 2 mm (50 times), 3 mm (200 times), 4 mm (200 times) and 5 mm (50 times) around the true location of the simulated effect.
Experimental details of the simulations
In this study, we performed ALE analyses on simulated datasets containing between 5 and 30 total experiments. Among these, between 1 and the minimum of 10 and the total number of experiments were randomly chosen to feature activation at the target-location. This yielded 245 distinct combinations of “total number of experiments” and “experiments activating the target-location”, i.e., distinct cases of meta-analyses. For each of these cases, we then generated 500 random datasets, yielding in total 122,500 datasets that provided the basis for the systematic assessment of the behavior of the ALE algorithm and the different methods for statistical thresholding.
To create artificial datasets that are as realistic as possible, we used the BrainMap database to provide a distribution of the properties, in particular, the number of subjects as well as the number and location of foci, based on the current neuroimaging literature (www.brainmap.org). Importantly, this distribution was solely based on those experiments in BrainMap that report foci from healthy adults (i.e., studies with pathological populations or children were excluded) and were coded as “normal mapping studies” (i.e., intervention studies and group comparisons were excluded). Moreover, we
restricted the analysis to peaks reflecting task-based activations, and discarded deactivations from the analysis. This resulted in approximately 7,200 eligible experiments at the time of analysis. For each
experiment in each of the simulation datasets, we first determined the “number of subjects” by
randomly drawing this parameter from the aforementioned 7,200 experiments. Independent of sampling the empirical subject numbers, we drew the “number of reported foci” for each experiment, again based on the distribution of this parameter among the normal mapping experiments in BrainMap (Laird et al., 2011a; Laird et al., 2009). Finally, for each experiment and independently from the other steps, the respective foci from the empirical distribution thereof in the BrainMap database were drawn. That is, for each experiment the number of subjects, the number of reported foci and the spatial distribution of foci in the simulation all corresponded to the distribution of neuroimaging literature stored in BrainMap, but were randomly reassembled by independent draws.
Critically, for those experiments that were supposed to feature a “true” activation of the target-location, we replaced one of the foci by a coordinate that was located at -42 / 32 / 26 (the coordinates of the simulated effect of interest) with a random Gaussian displacement corresponding to the spread as described above.
We than conducted state-of-the-art ALE analyses on the ensuing 122,500 datasets and performed statistical inference on significant convergence using voxel- and cluster-level FWE corrected at p<0.05 (Eickhoff et al., 2012), voxel-level FDR corrected at p<0.05 (Laird et al., 2005) and uncorrected p<0.001 with an additional extent-threshold of 200 mm3.
Behavior of ALE and p-values
Figure 2 depicts the behavior of the ALE-scores and p-values at the local peak around the target-location (4 mm search radius around the true target-location) in the 245 cases assessed in the current simulation, i.e., the distinct combinations of “total number of experiments” and “experiments activating
the target-location”. ALE scores quantify the convergence of foci given the associated spatial uncertainty, while the p-values quantify, how likely such convergence is under the hull-hypothesis of random spatial association. Several important, reassuring observations on the obtained ALE scores and p-values may be noted.
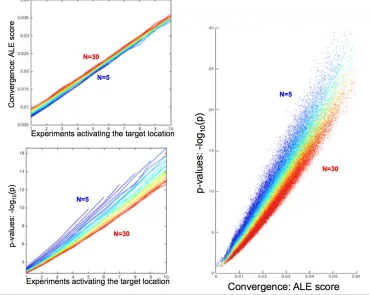
Figure 2: Characteristic behavior of the ALE scores and the corresponding p-values under the different simulation conditions as observed across 122,500 simulated ALE analyses. The total number of experiments in the respective simulated ALE is coded in a spectral sequence from 5 experiments (dark blue) to 30 experiments (dark red). The top left panel shows the average ALE-score (across simulations) at the simulated location (again
using the highest local maximum within 4 voxels of the “true” location). ALE scores increase with number of experiments due to additional contribution of noise from other unrelated foci. The bottom left panel shows the average p-value (across simulations) at the simulated location (using the highest local maximum within 4 voxels
of the “true” location). It shows that given the same number of experiments activating at a particular location, lower total numbers of experiments (i.e., greater prevalence of activated experiments) yield lower p-values. The right panel demonstrates the inverse relationships evident from the left panels by plotting ALE scores vs.
p-values for the simulated location (again using the highest local maximum within 4 voxels of the “true” location) for
[image:9.612.82.454.195.490.2]As the number of experiments activating the target-location increases, the average ALE score (across simulations) increases almost linearly. In this context it should be reiterated that the ALE values are the union (rather than sum) of the respective probabilities for the individual experiments (Turkeltaub et al., 2002). Yet, in the considered range of values these are virtually identical. The ALE values also increased slightly but consistently as a function of the total number of experiments, independently of the number of experiments activating the target-location. This effect is most likely attributable to interference (superposition) of unrelated foci, which probabilistically increases as the number of experiments is increased when averaging across the 500 distinct simulations of each case.
As expected, the p-value of the local peak at the target-location is also strongly dependent on the
number of experiments featuring “true” activation at the target location. However, it decreases when the total number of experiments is increased. That is, given the same number of true activations, a higher amount of experiments that do not feature activation in the target location increases the p-value of the observed convergence, even though the ALE score is on average slightly increased due to random superposition. This behavior reflects the shift in the null-distribution, i.e., the distribution of ALE scores under the null-hypothesis of random spatial association, to higher values if the total number of experiments is increased.
Plotting the peak ALE-score at the target-location against their p-values across all 122,500 simulations summarizes the above observations (Fig. 2, right). While higher ALE scores yield lower p-values, this relationship is systematically shifted according to the total number of experiments included in the simulated meta-analysis. A higher total number of experiments lead to higher p-values for the same ALE scores or, conversely, requires higher ALE scores for the same p-value.
Excessive contribution of individual studies
Empirically, it has repeatedly been noted that significant effects may be largely driven by even a single experiment if the total number of experiments is relatively low (Bzdok et al., 2011; Raemaekers et al., 2007; Turkeltaub et al., 2012; Wager et al., 2007). This comes as no surprise. In a very small ALE analysis of, e.g., 6 experiments, ALE scores of a single experiment may already be close to significance relative to the overall null-distribution. This is especially the case with a higher number of subjects that result in a tighter Gaussian distributions and hence higher ALE scores (Eickhoff et al., 2009b). Consequently, even minimal overlap of a second MA map may yield ALE scores that become significant. This observation has prompted anecdotal recommendations that “at least 10-15
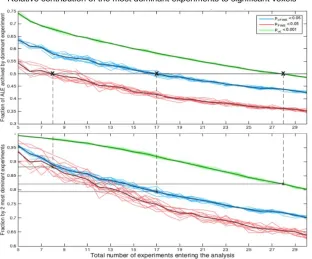
It may be noted, that for voxel-level FWE thresholding, 8 experiments are enough to ensure that on average the contribution of the most dominant experiment is lower than 50%, but the two most dominant experiments explain more than 90% of the total ALE score. In turn, using cluster-level FWE thresholding, 17 experiments ensure that on average the contribution of the most dominant experiments is less than 50% whereas the contribution of the two most dominant experiments is less than 80%. When using uncorrected thresholding at p<0.001 at the voxel level with an additional extent-threshold of 200 mm3, as commonly seen in ALE papers, 28 experiments are needed to restrict the average contribution of the most dominant experiment to <50%. Finally, as we will explain later in detail (cf. Figure 6), for FDR thresholding the number of the additional clusters is strongly dependent
on the number of experiments activating the “true” location. Consequently, FDR thresholding, which will figure least strongly in the following, is not included in the comparison.
In summary, these data suggest that cluster-level thresholding does a very good job of controlling excessive contribution of one experiment to the ensuing significant findings if 17 or more experiments are included in the ALE analysis. This number is lower for voxel-level thresholding, where 8 experiments ensure a contribution of <50% for the most dominant and 14 experiments a contribution of <80% of the two most dominant experiments. This, however, comes at a substantially reduced sensitivity as will be outlined in the next section.
Figure 3: To quantify the empirical observation that significant effects may be largely driven by a single experiment if the total number of experiments is relatively low and hence to provide quantitative guidelines on the minimal number of experiments needed for valid ALE analyses, we quantified the number of experiments contributing to the significant clusters under different thresholding methods. This analysis is not based on the
[image:11.612.66.378.353.612.2]panel) experiments. The light lines denote the average across the different number of experiments activating the
“true” location and illustrate the robustness of these findings.
It may be noted, that for voxel-level FWE thresholding, 8 experiments are enough to ensure that on average the contribution of the most dominant experiment is lower 50%, but the two most dominant experiments explain more than 90% of the total ALE score. Using cluster-level FWE thresholding, 17 experiments ensure a top-contribution of less than 50% and a top-contribution of the two most dominant experiments of less than 80%. Given that for FDR thresholding the number of the additional clusters was strongly dependent on the number of
experiments activating the “true” location as later seen in Figure 6, we did not consider FDR in this analysis. In
summary, this data suggests that cluster-level thresholding does a very good job of controlling excessive contribution of one experiment if 17 or more experiments are included in an ALE analysis.
Sensitivity
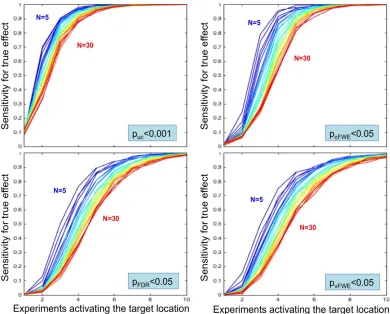
As a next step, we quantified the sensitivity of ALE meta-analyses under different conditions, i.e., systematically varying the number of experiments activating the target location and the total number of experiments, using the four different thresholding approaches. In this context, sensitivity was provided by the fraction of the 500 random realizations that yielded a statistically significant finding at the location of the simulated true activation site. As illustrated in figure 4, the sensitivity is strongly related to the number of experiments featuring activation in the target location in a roughly sigmoid fashion.
[image:12.612.72.462.347.661.2]chosen statistical thresholding method and sample size, sensitivity curves converge to 100% when a sufficiently
high number of experiments activates the “true” location. Third, cluster-level correction shows a higher sensitivity than voxel-level FDR and particularly voxel-level FWE thresholding.
Three key aspects that characterize the sensitivity of ALE analyses may be noted. First, a higher total number of experiments leads to a right-shift in the sensitivity curves. That is, given the same number of experiments activating the target location, the sensitivity to correctly detect this convergence decreases when the total number of experiments increases. This evidently mirrors the behavior of (local peak) p-values described above. Second, independently of the chosen statistical thresholding method and total number of experiments, sensitivity converges to almost perfect recovery once a sufficiently high number of experiments activate the “true” location. How quickly perfect detection rate is observed, however, depends on the total number of experiments, reflecting the aforementioned right-shift, and importantly also the thresholding method chosen. As a third observation, the quite marked differences in sensitivity between the four assessed thresholding methods. As expected, the uncorrected method is most sensitive. In particular, uncorrected voxel-level thresholding in combination with an (arbitrary) extent threshold of >200 mm3 has at least 80% power when 4 experiments activate the modeled true location (out of up to 30 experiments considered). Corrected inference methods have less power but differ considerably in the slope of the sensitivity curve. Cluster-level FWE correction represents the most sensitive approach, followed by voxel-level FDR correction. In turn, voxel-level FWE is the least sensitive approach, reaching 100% sensitivity only in cases where 10 experiments feature activation around the target location. This is consistent behavior in traditional brain imaging where cluster-level inference typically exhibits superior power to voxel-level inference (Friston et al., 1996), though this difference must be considered in light of cluster-inference’s
reduced spatial specificity relative to voxel-level inference.
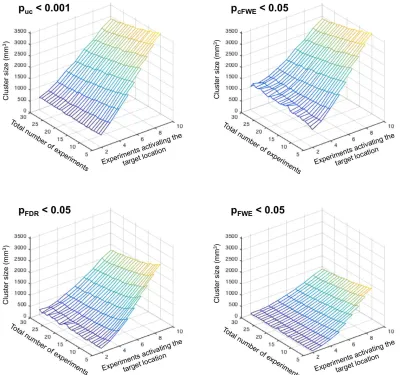
As shown in Figure 5, across all thresholding approaches the size of the excursion set strongly increases with the number of experiments activating around the target location. In turn, clusters become smaller when the total number of experiments increases given the same number of experiments activating at the target location. Strikingly, however, the ensuing clusters are much smaller when using voxel-level FWE or FDR correction as compared to cluster-level FWE correction, reflecting some combination of cluster-level’s greater power and voxel-level’s greater spatial
specificity. In addition to underlining the differences in sensitivity between the different approaches, this observation also leads to another important consideration. When using voxel-level FWE thresholding in an ALE study, it is quite likely that the ensuing significant clusters are of very small size. In this context, it is worth reiterating that even a single voxel may allow for a significant finding, given the voxel-wise correction for multiple comparisons across the whole brain. Nevertheless, such findings are often very difficult to display and interpret, and may require an arbitrary re-thresholding to more clearly demonstrate the area of activation.
Figure 5: Cluster-size of the super-threshold cluster at the “true” location, i.e., the target of the simulation, in
relationship to the total number of experiments and the number of experiments activating the target location. It
becomes apparent that the cluster size increases strongly with the number of experiments activating the “true”
location. In turn, clusters become smaller when the total number of experiments increases given the same number of experiments activating the target location. Finally, we note that FDR and in particular voxel-level FWE thresholding yields much smaller clusters than cluster-level FWE thresholding.
Susceptibility to spurious convergence
[image:14.612.63.463.70.445.2]current simulations thus reflect this bias, leading to incidental convergence outside the target location. Given that a similar structure should also be present in most real-world ALE analyses, as it most likely reflects task-set effects or epiphenomena of the neuroimaging setting, they should represent a very good approximation of how likely spurious findings are found. They would usually be considered false positives in usual neuroimaging settings. Yet, we would like to stress the distinction between false positive findings in the statistical sense and such incidental effects, which are true positives but conceptually spurious convergence. The advantage of the present set-up thus lies in the fact that the ground truth is known and by drawing resamples from the known BrainMap sample (which is itself a sample of the unknown population of neuroimaging studies) we can quantify the uncertainty (as interval estimates), which is conceptually similar to bootstrapping approaches (Efron and Tibshirani, 1994).
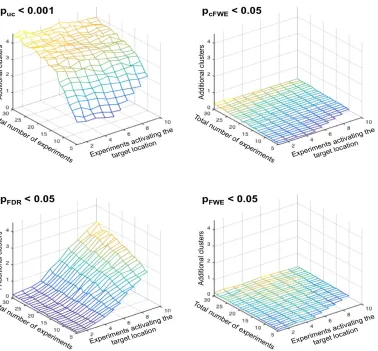
Figure 6: Average number of additional clusters of significant convergence outside of the “true”, i.e., target
location in relationship to the total number of experiments, and the number of experiments activating the target location and the significance thresholding. Given that the distribution of the entire BrainMap database is known, these analyses allow quantifying deviations from the ground truth, similar to false positive findings. As can be seen, both voxel- and cluster-level FWE correction yield very low numbers of additional clusters. In turn, two interesting and orthogonal patterns may be noted for uncorrected thresholds and voxel-level FDR correction.
When using the former (p<0.001 at the voxel level with k>200mm3) the number of additional clusters depends
primarily on the total number of experiments entering the ALE. This may be expected because the chance for additional overlap increases if more experiments are present. For voxel-level FDR correction, however, the
[image:15.612.71.449.226.577.2]target location, i.e., the “true” effect. This effect may be explained by figure 5, considering that a higher number
of significant voxels at the target location allow for more false positive voxels.
Reassuringly, both voxel- and cluster-level FWE correction yielded very low numbers of additional clusters independently of the number of experiments activating the target location and the total number of experiments (Figure 6). That is, controlling the FWE seems to be a very potent approach to limiting the likelihood of finding incidental convergence. In turn, when performing uncorrected thresholding (p<0.001 at the voxel level with an extent threshold of 200mm3) the number of additional clusters is not only substantially higher but also depends heavily on the total number of experiments entering the ALE. While this effect can be expected given that the chance for additional overlap increases if more experiments are present, it also indicates that uncorrected thresholding even with an additional (arbitrary) extent threshold does a very bad job in controlling for incidental findings. Consequently, most results based on uncorrected thresholds may be expected to contain additional, spuriously significant clusters. The more worrisome pattern, however, is found for FDR correction (Laird et al., 2005). Here the number of incidental clusters depends strongly on the number of
experiments activating the target location, i.e., the “true” effect. Again, this effect is actually to be expected. As evident in figure 5, the number of significant voxels in the target region strongly increases with the number of experiments activating here. In turn, a higher number of significant voxels at the target location allow for more false positive voxels when the false positive rate is controlled (Genovese et al., 2002). Given the spatial smoothness of ALE data, these false positive voxels are then usually aggregated to form spurious clusters. Our simulations are thus in line with previous considerations (Chumbley and Friston, 2009) regarding the inappropriateness of FDR for inference on fMRI data and underlines that FDR correction is also not appropriate for ALE meta-analyses.
Power analysis for inference on the underlying population of experiments
As noted above, the sensitivity of ALE to detect a true effect is positively related to the number of experiments activating the target location but at the same time negatively related to the total number of experiments. This may seem to contradict the idea that a higher number of experiments should result in greater power to detect subtle effects. Here we need to introduce a critical distinction between the sensitivity to detect convergence within a given sample of experiments and the power to reveal an effect present in the underlying population of experiments from which the analyzed ones are sampled. In the latter context, the “effect size” is given by the proportion of the experiments in the underlying
population showing activation at a given location. The analyzed experiments are then assumed to represent random samples from this underlying population. Fundamentally, the power to detect a given effect (with an effect size as denoted above) then depends on the probability that x out of N experiments in an ALE analysis show the effect and the sensitivity of the ALE to identify it. The former
probability can easily be derived from the “effect size” using a binomial distribution, the latter is
provided by the current simulation study. Whereas the simulation results above are computed for a fixed and known number of truly active studies, we can extend these results to a random and unknown number of truly active studies using a binomial distribution. If is the power for x truly active
where is the binomial probability of observing x out of N counts, each occurring with success probability p.
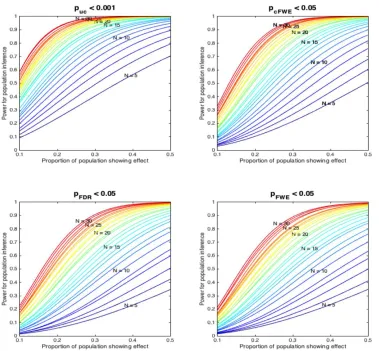
Figure 7: Power of inference on the underlying population of experiments assuming different “effect sizes”
(proportion of the experiments in the underlying population showing an effect at a given location). The power to
detect a given effect in the underlying population depends on the probability that x out of N experiments in an
ALE analysis (assumed to be random samples from the underlying population) show the effect and the sensitivity of the ALE to identify it (cf. Figure 4). The total number of experiments in the respective simulated ALE is again coded in a spectral sequence. In spite of the differences in power between the thresholding methods, two trends are noticed. ALE analyses with less than 10-50 experiments yield a low power to find consistent effects. Even ALE analyses with 30 experiments are not very highly powered to reveal rare effects. In addition, we note that voxel-level FDR thresholding combines a low sensitivity (cf. Figure 4) with a high potential for false positive or spurious findings especially when there is a strong true effect (cf. figure 6).
[image:17.612.64.443.153.504.2]than 10-50 experiments yield a low power to even find very consistent effects. In fact, even ALE analyses with 30 experiments are not very highly powered to reveal low effect-sizes, i.e., effects that are only present in a smaller proportion of the underlying population of experiments. Finally, we note that voxel-level FDR thresholding combines low sensitivity (cf. Figure 4) and hence power with a high potential for false positive or spurious findings when there is a strong true effect (cf. figure 6).
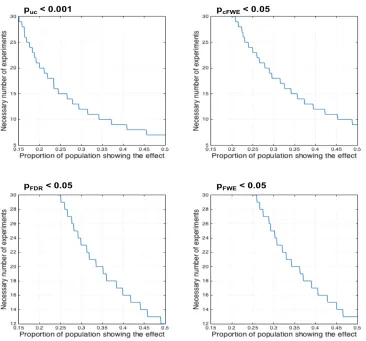
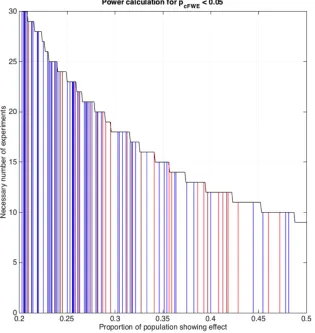
Figure 8: Sample size calculations for ALE meta-analyses assuming a desired power of 80% given different
“effect sizes” (proportion of the experiments in the underlying population showing an effect at a given location)
for each of the four assessed thresholding approaches.
The probably even more important consideration with respect to power is the question regarding the required number of experiments for an ALE analysis. Above we argued that in order to limit the influence of any single experiment on the ensuing results, i.e., to avoid clusters that are predominantly driven by an individual experiment, between 8 (voxel-level FWE) and 17 experiments (cluster-level FWE) are needed. The sample size calculations for ALE meta-analyses assuming a desired power of 80% given different “effect sizes” (proportion of the experiments in the underlying population showing
[image:18.612.61.427.135.476.2]in one out of five experiments, is only present when more than 30 experiments are included in the ALE analysis, given cluster-level FWE thresholding.
This evidently raises the question as to which effect sizes may reasonably be expected for ALE analyses. While this depends on the subject under investigation, we provide some first insight into this matter in figure 8 illustrating the “effect sizes” for the real-life ALE analyses. Here we used the same datasets as in Figure 1, and combined them with the sample-size calculations for cluster-level FWE inference. It may be noted, that strong effects such as 40% or more of a dataset showing a particular
effect are rare, while “effect sizes” of 0.2 - 0.25 are much more common.
Figure 9: Illustration of “effect sizes” (proportion of the experiments in the underlying population showing an
effect at a given location) found for real-life ALE analyses. Here we used the same datasets as in Figure 1 and combined them with the sample-size calculations for cluster-level FWE inference. Red lines correspond to peaks from the hand-coded datasets for topic-based ALE meta-analyses and blue lines to the datasets defined by combinations of the Behavioral Domain and Paradigm class meta-data in BrainMap. Note that strong effects
[image:19.612.62.377.196.529.2]Discussion
Conceptual considerations
The present empirical simulation study based on the BrainMap database provides a quantitative assessment of the statistical properties of ALE analyses. These parameters for the simulations, in
particular the assumed spatial spread around a “true” location were based on a large number of stored meta-analyses and moreover converged nicely between hand-coded and automatically generated datasets. Consequently, we feel confident, that the simulations reflect real-world situations that researchers will encounter when performing future ALE analyses in everyday research practice. In that context, we need to acknowledge, however, that the true spread around a hypothetical location of activation must remain unknown, as we can only provide estimates based on databased empirical
observations. Moreover, it may be discussed whether indeed something like “the” true location of an effect exists, given recent accounts of distributed coding and representation (Bzdok et al., 2015; Haxby, 2012; Kriegeskorte, 2009; Rissman and Wagner, 2012). It may additionally be argued that different variations of a behavioral task may recruit slightly different locations within a larger brain region, rendering the current estimates a mixture of systematic effects and random noise.
While important on the conceptual level, these considerations do not change the fact that such effects should be equally present in the (future) ALE analyses as they are in the simulations. This highlights the advantage of basing the simulations on empirical information, rendering them a faithful reflection of the phenomena under investigation. Moreover, by using a resampled dataset from the BrainMap database to construct the simulations, we ensured that all parameters that otherwise would have to be set manually reflect the distribution thereof in a large sample of published neuroimaging studies. This in particular pertains to the number of subjects and reported number of foci in each experiment as well
as the localization of the “noise” foci. We would thus argue, that our results should represent a realistic reflection of situations that are encountered when conducting meta-analyses and should therefore generalize to real-life settings.
Recommendations for statistical inference
From the observations that were made by assessing >120,000 realistically simulated analyses using the four commonly applied inference methods, several recommendations may be derived.
Cluster-level family-wise error (FWE) thresholding was observed to provide the best compromise between sensitivity and specificity and is hence recommended for inference on ALE analyses. In particular, our analysis showed that cluster-level FWE corrected inference is almost as sensitive to true effects as uncorrected thresholding and consequently provides substantially higher power than voxel-level FWE or FDR thresholding. Importantly, this high sensitivity is not offset by a higher susceptibility to incidental convergence. Here we would like to reiterate, that the latter may not
We would strongly discourage the use of voxel-wise false-discovery rate (FDR) thresholding in the context of ALE meta-analyses. As previously pointed out, voxel-wise FDR correction, the type considered here and almost exclusively used in ALE analysis is not appropriate for inference on topological features such as regions of significant convergence of a smooth dataset (Chumbley and Friston, 2009). The present investigation corroborates this notion by showing that voxel-level FDR correction entails both relatively low sensitivity and a high susceptibility to spurious, false positive findings. Moreover, it also highlights another negative property of FDR thresholding, namely dependence of the latter on the strength of true convergence in other parts of the brain. If there are regions in the image where a strong effect is present, other regions are most likely to be declared significant as well as compared to a situation where the former is not present (Genovese et al., 2002). This is inherently correct in the logic of the false discovery rate as the number of false positives will scale with the number of voxels declared significant which in turn will depend on the presence of true effects. It however implies whether a voxel, such as in the occipital lobe is declared significant or not may depend on the magnitude of convergence in the prefrontal cortex. In summary, FDR thresholding should thus be avoided for inference on ALE analyses.
With respect to uncorrected thresholding, our analyses confirmed previous expectations. Namely, uncorrected thresholding, even in combination with an additional extent threshold is very prone to reveal spurious findings. Moreover, results are extremely likely to be driven by only a single dominant experiment. Consequently, uncorrected inference is to be avoided.
Finally, voxel-level FWE corrected thresholding may be too conservative for most applications, apart from maybe those in which hundreds of experiments are analyzed and hence more stringent inference is desired. It does offer an excellent protection from declaring incidental overlap significant and also makes it very unlikely that significant results are predominantly driven by a single experiment. On the other hand, considering that cluster-level FWE thresholding performs similarly well in these aspects and at the same time offers higher sensitivity and, on a pragmatic perspective, also avoids very small and hence hardly interpretable clusters, we would argue that the latter should be preferred. In this context, however, we would like to stress the conceptual differences between cluster- and voxel-level thresholding. In particular, when applying the former, significance is achieved by the cluster as a whole through its spatial extent, which is evaluated against a non-parametric null-distribution thereof. When applying cluster-level correction, one can thus not make claims about any particular voxel within the cluster being (most) significant, even though peak coordinates are often -inappropriately - reported in such situation. This predicament becomes particularly obvious, when a significant cluster spans multiple anatomical areas. To illustrate this point, if a cluster covers both the anterior insula and the inferior frontal gyrus, one cannot necessarily infer that both regions show convergence but rather only that the entire super-threshold cluster covering both regions is larger than expected by chance. In turn, voxel-level correction allows to attribute significance to each voxel above the respective threshold and therefore a somewhat better allocation to a specific brain region.
How many experiments are needed for an ALE analysis?
current simulation study addressed both aspects based on a large dataset that should be well representative for situations encountered in current neuroimaging meta-analyses and yielded a rather clear answer to at least the first question.
Based on the obtained results, we would make a strong case for including at least 17 experiments into an ALE meta-analysis to control the influence of any individual experiment. This recommendation is based on the observation that, when controlling for multiple comparisons using cluster-level family wise error correction, from this size on, the average contribution of the most dominant experiment to any above-threshold cluster is less than half and the two most dominant experiments contribute on average less than 80%. While the absolute numbers, in particular the criterion of 50% contribution for the most dominant experiment, may be disputed, this recommendation is well in line with our empirical evidence across many ALE analyses on a large range of topics. In particular, in line with the data summarized in figure 3 we observed that in analyses involving less than 10 experiments, it becomes very likely that results are largely driven by a singly experiment. This is in particular the case if there is a marked heterogeneity in the number of subjects involved in the different experiments. More specifically, this is quite likely to happen if one experiment is based on a substantially larger N than the remaining ones and hence features a tighter Gaussian leading to higher voxel-wise probabilities around the reported foci (Eickhoff et al., 2009b). In this case, even a relatively minor contribution from a second experiment will almost certainly move the ensuing ALE scores above the significance threshold. From the current simulations, however, it became clear that previous recommendation “at
least 10-15 experiments should be included in an ALE meta-analyses” was still somewhat optimistic and needs to be adjusted upwardly closer to 20.
We acknowledge that a robust approach to ensure that results are not driven by any one experiment may be provided by the use of jackknife analyses, that is, re-computation of the ALE analysis while in turn leaving out each experiment from the dataset. There is no question that results obtained throughout all realizations of the jackknife procedure must be considered robustly present in the dataset and not dependent on any one experiment (Amanzio et al., 2013; Palaniyappan et al., 2012). There are, however, two downsides to using this statistical procedure as primary inferential tool, which became most apparent when considering the two extreme cases, i.e., meta-analyses involving very few and very many experiments. In the latter case, repeating the full analysis, including the calculation of the cluster-size null-distribution as many times as there are experiments will be extremely computationally expensive and hence impractical. Moreover, our simulations also indicated, that in these cases jackknife analyses will not really be necessary, given that already in the case of 30 experiments the influence of any one or two experiments becomes quite limited. The other case is conceptually more interesting, though. When only including, e.g., less than ten experiments, jackknife analyses may indeed establish that an effect is not driven by any individual study. However, such analyses will quickly turn out very conservative while on the other hand not offering any protection against results driven by two experiments, given that in the even smaller sample it becomes likely that the non-removed one may drive the results by itself. Finally, as discussed below, we would argue the idea of meta-analyses as a quantitative assessment of convergence in the current literature is undermined when only a handful of experiments may actually be integrated. One of the reasons is that such analyses would be really ill-powered, which brings us to the second aspect of the question of how many experiments are needed for an ALE meta-analyses.
The concept of statistical power is intimately linked to the notion of effect size given the two
finding a particular effect size”. The notion of effect-size, however, is somewhat tricky in ALE meta-analyses, as in contrast to classical behavioral meta-analyses neuroimaging meta-analyses assess spatial convergence (Eickhoff et al., 2009b; Kober and Wager, 2010; Radua and Mataix-Cols, 2012).
In fact, ALE is in stark contrast to behavioral “effect-size” meta-analyses by not considering the size of the reported effects (Cheung et al., 2012; Jones, 1995) but rather their location and associated spatial uncertainty. Nevertheless, there is a rather straightforward notion of effect-size in ALE meta-analyses, namely the fraction of experiments that activate at a particular location (or rather in that region, as the individual experiments will show some spread around the hypothetical true location). Here we present power-estimates for ALE meta-analyses based on this concept of effect-size for the first time.
We would like to point out, that in the context of power-calculations effect-size pertains to the (unknown) underlying population of experiments of which the included ones are considered a random sample. That is, the effect size is the proportion of experiments in the underlying population that show an effect at a given location. For any desired effect-size the power of an ALE analysis may then be computed as the likelihood of drawing x experiments that show the effect among N total experiments multiplied by the likelihood to find an effect present in x / N experiments, summed over all values of x. From the respective power-curves (Figure 7) and the ensuing sample-size calculations needed for 80% power (Figure 8), it becomes obvious, that samples sizes needed to control the influence of any individual experiment as discussed above only provide adequate power for rather strong effects, i.e., those present in about a third of all experiments. Even worse, ALE analyses with only <10 experiments only have good power to likely detect effects that are present in every second experiment. In other words, ALE meta-analyses including fewer than close to 20 experiments but in particular those based on less than ten run a high danger to obtain results that are driven by an individual experiment and only have sufficient power to detect effects that are extremely obvious.
Considering the sample-size calculations presented in figure 8, we would suspect that a majority of the present ALE literature may actually be underpowered, given that only sample sizes of more than 30 experiments yield sufficient power to detect an effect that is present in 1/5 of all experiments in the underlying population. Conversely, many published meta-analyses may have only been likely to detect very consistent effects. While this is clearly not a desirable situation, we would not consider the presence of low-powered ALE analyses by itself to be a major problem. Rather, we would argue that the combination of low power with the increased susceptibility to effects driven by a single experiment and the increased temptation to use less adequate thresholding (namely, uncorrected thresholds or voxel-level FDR) to be a potentially dangerous constellation leading to both false negative and false positive findings. Finally, returning to the original question of how many experiments are needed for ALE meta-analysis, we recommend that when using cluster-level FWE thresholding, approximately 20 experiments should be considered the lower bound for valid and decently powered analyses.
Are the results transferable to other approaches for coordinate-based meta-analyses?
While one of the most widely used methods for coordinate-based meta-analyses, ALE is by far not the only approach towards this goal. Rather, multi-level kernel density analysis (MKDA (Kober and Wager, 2010; Nee et al., 2007; Wager et al., 2009)) and signed difference map analysis (SDM (Palaniyappan et al., 2012; Radua and Mataix-Cols, 2012; Radua et al., 2010)) have likewise been frequently used to investigate convergence across functional and structural neuroimaging experiments.
those locations in the brain where the coordinates reported for a particular paradigm or comparison show an above-chance convergence, there are several distinctions in the implementation of this aim. Whereas ALE and SDM investigate where the location probabilities reflecting the spatial uncertainty associated with the foci overlap, MKDA tests how many foci are reported close to any individual voxel. All approaches avoid excessive summation through neighboring foci from a same experiment by limiting maximum values and involve some form of permutation / relocation procedure for establishing (corrected) significance, though the exact concepts and implementations vary considerably across methods. Moreover, MKDA and SDM allow emphasizing, i.e., up-weighting, foci derived from conservatively corrected analyses. This feature is not present in the probabilistic approach taken by ALE (Kober and Wager, 2010; Radua et al., 2010). A distinct feature of SDM relative to MKDA and ALE, finally, is the possibility to integrate positive and negative effects in a same map in order to cancel out regions in which both are present (Radua and Mataix-Cols, 2012). While cursory, this overview hopefully illustrates that the concepts and machinery differ considerably between ALE, MKDA and SDM. This is in spite of the fact that all three approaches are widely used and thoroughly validated methods for coordinate-based meta-analyses and often yields comparable results to each other and image-based meta-analyses (Salimi-Khorshidi et al., 2009).
Consequently, we would urge caution when trying to extrapolate the current observations on sensitivity and power for ALE meta-analyses to MKDA and SDM. This is in particular true for SDM: if statistical parametric maps rather than (only) foci are included or effect size maps are estimated from t-values reported in individual studies, behavior and power of such analyses should be fundamentally different from the case investigated here.
Nevertheless, we would consider the advice to strive for sufficiently high numbers of included experiments in any meta-analysis to be valid independently of the employed algorithm, based on two considerations. On the algorithmic level, meta-analyses based on a lower number of experiments
easily run into the problem that significant “convergence” may be strongly or even exclusively driven
by a single experiment. Perhaps even more importantly, however, on the conceptual level the value of a meta-analysis, as integration across a broader set of previous findings in order to identify robust convergence, may be driven ad absurdum when only a handful of experiments are assessed. However, we have no indication whether the estimated lower bound of ~20 experiments, the observation that the sensitivity of ALE is primarily related to the absolute number of converging foci in spite of the right-shift of this curve by the number of “noise” experiments also holds for MKDA and SDM. Likewise, the power-calculations for different proportions of true effects in the underlying (unknown) population of experiments, which directly depend on the sensitivity-curves, should be specific to ALE.
In summary, we would thus consider the recommendation of striving for sample sizes >20 experiments useful for all types of coordinate-based meta-analyses, even though we have no quantitative data to substantiate this claim with respect to MKDA and SDM.
Relevance for meta-analytic co-activation modeling
regions are co-active above chance given activation in a predefined region of interest as a marker of functional connectivity between them (Robinson et al., 2010; Rottschy et al., 2013). Practically, this is usually implemented by filtering a database such as BrainMap or Neurosynth (Yarkoni et al., 2011) to only retrieve experiments that feature at least one focus of activation in the seed region. In the next step, an (ALE) meta-analysis is then performed over the identified experiments to quantify across-experiment convergence. The highest convergence will probably be found in the seed region, but significant convergence outside the seed indicates significant co-activation. Meta-Analytic Co-Activation Modeling (MACM) thus provides a complementary aspect of long-range integration relative to measures such as resting-state functional connectivity or structural covariance (Clos et al., 2014; Hardwick et al., 2015).
It is important to stress that topic- and location-based meta-analyses use the same underlying algorithms to assess above-chance convergence between experiments and differ only with respect to the way that these are defined (either based on the experimental context that is assessed or the fact that they activate a particular region of interest). Consequently, we argue that the same considerations with respect to inference-approaches, sample-size and power should also hold for MACM studies. We would therefore amend the above recommendations only by two specific aspects. First, in the case of a small seed region and/or a seed that is located in a part of the brain that is not very densely covered by neuroimaging foci, it may be necessary to include a spatial fudge-factor. That is, rather than considering only those experiments that activate within the seed region, it may be advantageous to additionally include those that are within, e.g., 5 mm of the seed in order to obtain a sufficient number of experiments. In the opposite case, i.e., when dealing with a region of interest that yields a very high number of experiments, it may be helpful to use voxel-rather than cluster-level FWE in order to render the analyses more conservative and avoid over-powered inference.
Conclusions
Coordinate-based meta-analyses by means of activation likelihood estimation meta-analyses have enjoyed considerable success over the last decade. Particularly ALE has been applied to a wide range of different topics from cognitive (Chase et al., 2015; Molenberghs et al., 2012), affective (Kohn et al., 2014; Lamm et al., 2011) and motor (King et al., 2014; Yuan and Brown, 2015) neuroscience to the neurobiology of neurological (Herz et al., 2014; Rehme et al., 2012) and psychiatric (Bludau et al., 2015; Chan et al., 2011; Goodkind et al., 2015) disorders. Given the ever-growing expansion of ALE meta-analyses into smaller research areas in which the eligible literature is not as abundant as for, e.g., working memory or social cognitive tasks, the question regarding the number of experiments that is necessary to perform a valid ALE analyses has become increasingly important over the last years. Likewise, several different methods for statistical inference, including cluster- and voxel-level FWE correction, false-discovery rate thresholding and also uncorrected inference combined with extent thresholds, have been proposed and frequently used in the context of ALE analyses without informed recommendation on which one is most appropriate.