Patterns of Lesion Development in Multiple
Sclerosis: Longitudinal Observations with
T1-Weighted Spin-Echo and Magnetization
Transfer MR
Jan Hein T. M. van Waesberghe, Marianne A. A. van Walderveen, Jonas A. Castelijns, Philip Scheltens, Geert J. Lycklama a` Nijeholt, Chris H. Polman, and Frederik Barkhof
PURPOSE: We evaluated the appearance of enhancing multiple sclerosis (MS) lesions on unenhanced T1-weighted MR images and the natural course of enhancing MS lesions on serial unenhanced T1-weighted and magnetization transfer (MT) MR images.
METHODS:One hundred twenty-six enhancing lesions were followed up monthly for 6 to 12 months to determine their signal intensity on unenhanced T1-weighted and MT MR images. At the time of initial enhancement, the size of the lesion and the contrast ratio of enhancement were calculated for each enhancing lesion. During follow-up, the contrast ratio on the corre-sponding unenhanced T1-weighted image was measured, and an MT ratio (MTR) was calcu-lated.
RESULTS:Twenty-five enhancing lesions (20%) appeared isointense and 101 lesions (80%) appeared hypointense relative to normal-appearing white matter on unenhanced T1-weighted images. During 6 months of follow-up, four MR patterns of active lesions were detected: initially isointense lesions remained isointense (15%); initially isointense lesions became hypointense (5%, most of which reenhanced); initially hypointense lesions became isointense (44%); and initially hypointense lesions remained hypointense (36%). MTR was significantly lower for hypointense lesions as compared with isointense lesions at the time of initial enhancement. For lesions that changed from hypointense to isointense, MTR increased significantly during 6 months of follow-up. Multiple regression analysis showed that strongly decreased MTR at the time of initial enhancement and enhancement duration of more than one scan were predictive of a hypointense appearance on unenhanced T1-weighted images at 6 months’ follow-up. Ring enhancement was found to be the only (weak) predictor of persistently hypointense signal intensity.
CONCLUSION: Most enhancing lesions appear slightly to significantly hypointense on unenhanced T1-weighted images. Although most hypointensities are reversible, only those lesions that fail to recover on unenhanced T1-weighted and MT images may have considerable irreversible structural changes.
As compared with lesion load on conventional T2-weighted spin-echo images, an increase in hypoin-tense lesion load on T1-weighted spin-echo images
correlates more decisively with increased disability in patients with multiple sclerosis (MS) (1, 2). At au-topsy, hypointense lesions show hypocellularity and an absence of centrally located myelinated axons in the presence of reactive astrocytes with gliosis (3). The degree of hypointensity correlates histopatholog-ically with a decrease in axonal density and with matrix destruction; that is, with enlargement of the meshes of the neuropil (3). This indicates that hy-pointense lesions are the magnetic resonance (MR) equivalent of severe tissue destruction and may indi-cate a persistent deficit in MS patients. By using postmortem material to investigate hypointense le-sions, however, a selection bias occurs toward more
Received June 18, 1997; accepted after revision October 17. From the Departments of Radiology (J.H.T.M.v.W., M.A.A.v.W., J.A.C., G.J.L.N., F.B.) and Neurology (P.S., C.H.P.), MR Center for MS Research, Academic Hospital “Vrije Universiteit,” Amsterdam, the Netherlands.
Address reprint requests to J. H. T. M. van Waesberghe, MD, Department of Radiology, MR Center for MS Research, Academic Hospital “Vrije Universiteit,” De Boelelaan 1117, 1081 HV Am-sterdam, the Netherlands.
©American Society of Neuroradiology
chronic and severe MS lesions, although no informa-tion is available as to their initial development. In addition to these chronic hypointense lesions, lesion hypointensity has also been reported to occur acutely at the time of initial enhancement (4).
Contrast-enhanced MR imaging is a sensitive indi-cator of disease activity in MS patients. Pathologi-cally, contrast-enhancement marks the acute inflam-matory phase of lesion development (5, 6). On noncontrast T1-weighted spin-echo MR images, these enhancing lesions may appear either isointense or hypointense relative to surrounding normal-appear-ing white matter (4). The magnetization transfer ratio (MTR), which can be used to quantify the integrity of (myelinated) white matter (7, 8), is reported to be lower in enhancing lesions that were hypointense on noncontrast T1-weighted MR images as compared with enhancing lesions that had an isointense appear-ance on noncontrast T1-weighted images (4). These acute hypointense lesions may correspond to demy-elination, as MTR values are reported to decrease only slightly with edema but more strongly with se-vere demyelination and axonal loss (7, 8). In addition, serial MT imaging has shown that MTR values of enhancing lesions may have the potential to revert to normal on follow-up examinations (9–11), a process that is suggested to be related to remyelination. In these studies, however, no longitudinal observations were made of the hypointense appearance of the lesions; moreover, the number of lesions investigated in those longitudinal MT studies was small, ranging from eight to 15.
The purpose of this study was to evaluate the MR appearance of enhancing MS lesions on unenhanced T1-weighted images in a larger sample and to evalu-ate the natural course of active MS lesions on serial unenhanced T1-weighted and MT MR images.
Methods
Eleven patients (one man and 10 women, 18 to 38 years old) were recruited from the outpatient clinic of our hospital. All patients had clinically definite MS (eight with relapsing-remit-ting and three with secondary-progressive disease) with a du-ration ranging from 1 to 17 years. Expanded disability status scale (EDSS) scores for these patients ranged from 1.0 to 7.0. Informed consent was obtained from all patients, and the protocol was approved by the institutional review board.
MR Imaging Protocol
MR imaging was performed monthly during a 1-year period on a 1.5-T unit. After 6 months, our MR unit was upgraded, but the same field strength was maintained. On both units, MR imaging included the following pulse sequences: T2-weighted fast spin-echo (2850/19–95/1 [repetition time/echo time/excita-tions]), unenhanced T1-weighted spin-echo (500/15/2), and contrast-enhanced (0.1 mmol/kg; scan delay, 5 minutes) T1-weighted spin-echo (500/15/2). In addition, spoiled gradient-echo two-dimensional sequences (600/12/2) were performed with a flip angle of 20°, with and without a gaussian-shaped off-resonance (21.5 kHz) presaturation pulse. For all MR sequences, we used a section thickness of 5 mm, a pixel size of approximately 131 mm, and an interleaved scan mode with an intersection gap of 5 mm to obtain 2312 sections, resulting in
24 contiguous sections covering the whole brain. Accurate monthly repositioning was achieved by using internal land-marks. For angulation, the line connecting the inferior border of the pituitary gland and the fastigium of the fourth ventricle was used, and the Z center was aligned to the caudal border of the splenium of the corpus callosum. MTR maps were calcu-lated by using the expression (Mo2Ms)/Mo, where Mostands
for signal intensity from unprepared sequences and Ms for
signal intensity from MT-presaturated pulses. Because the de-sign of the MT pulse sequences was altered after the upgrade, 10 control subjects were imaged: during the first 6 months, duration was 12.8 milliseconds, bandwidth was 250 Hz, and flip angle off-resonance pulse was 1000°, as developed by Dousset et al (7); after the upgrade, duration was 7.6 milliseconds, bandwidth was 250 Hz, and flip angle was 500°, with the stan-dard MT option (no modification was possible). For the first 6 months, the mean MTR of white matter was 0.495 (SD, 0.004); after the upgrade, it was 0.306 (SD, 0.006). The calculated correction factor (1.62) was multiplied with the MTR values from the upgraded system to compensate for the MTR differ-ence between the sequdiffer-ences, assuming a linear relationship between both MTR values for white matter (12).
Image Analysis
In stage 1 of the image analysis, all enhancing lesions (here-after referred to as active lesions) were marked on the hard copy. In comparison with surrounding normal-appearing white matter, the appearance of active lesions on noncontrast T1-weighted spin-echo images was classified visually by two read-ers in consensus as isointense or hypointense. Active lesions were further divided into two groups on the basis of configu-ration of enhancement: nodular-enhancing lesions and ring-enhancing lesions. Ring-ring-enhancing lesions were defined as those with no enhancement in the center. In addition, lesions with an enhancement duration of at least two scans were followed up for changes in enhancement pattern (nodular or ring enhancing). For all active lesions, the corresponding T2-weighted images were analyzed as to whether a T2 lesion was present at the time of initial enhancement and 1 month before enhancement. All lesions with a follow-up of at least 6 months were classified according to change in appearance on unen-hanced T1-weighted images and change in MTR over time.
In stage 2, all active lesions with a follow-up of at least 6 months were selected for further computer-assisted analysis, which included calculation of the contrast ratio on enhanced images (enhanced-CR), size of enhancement, contrast ratio on unenhanced T1-weighted images (T1-CR), and MTR. En-hanced-CR and T1-CR were defined in relation to signal in-tensity (SI) of surrounding normal-appearing white matter. Enhanced-CR was defined as SI of the enhancing lesion di-vided by SI of the white matter. T1-CR was defined by the ratio SI of the corresponding area on an unenhanced T1-weighted image (either hypointense or isointense) divided by SI of the white matter. SI of an enhancing lesion was measured as the mean SI of all pixels within the borders of an enhancing lesion. SI of lesions for T1-CR was measured as the mean SI of all pixels within the border of the corresponding hypointense le-sion or corresponding white matter. SI of white matter was measured as the mean SI of two rectangular regions of interest neighboring the lesion, each having an area of at least 10 mm2.
Statistical Analysis
Differences in values of enhanced-CR, T1-CR, size, and MTR for appearance on unenhanced T1-weighted images were tested using a multifactorial analysis of variance (ANOVA) model (F is the variance ratio). Within subgroups, Wilcoxon’s matched-pairs signed-rank test (Z is the variance ratio) was used. Association of contrast parameters, size, and MTR at the time of initial enhancement were assessed using the two-tailed Spearman’s rank correlation coefficient (r). Multiple regres-sion analysis (forward and backward stepwise methods) was used to examine which MR parameters influence T1-CR at the time of initial enhancement and after 6 months of follow-up (dependent variables). At the time of initial enhancement, independent variables investigated were enhanced-CR, size of lesions, MTR, and pattern of enhancement. At 6 months’ follow-up, MTR, enhanced-CR, and size of lesions at the time of initial enhancement, as well as duration and pattern of enhancement, were investigated as independent variables. Lo-gistic regression analyses (forward and backward stepwise methods) were used to estimate the relative weight of MR parameters for persistence of the hypointense appearance of lesions (dependent variable) during 6 months of follow-up. Independent variables investigated were MTR, enhanced-CR, and size of lesions at the time of initial enhancement, as well as duration and pattern of enhancement.
Results
Findings at the Time of Initial Enhancement
In total, 231 active lesions were detected during the 12 months of follow-up. A follow-up period of at least 6 months was available for 126 active lesions. Of these 126 lesions, 91 were located in the white matter (of which 18 were adjacent to the ventricles), 32 were either touching (the majority) or completely within the cortex, and three were infratentorial. Twenty-five lesions (20%) appeared isointense and 101 lesions (80%) appeared hypointense. Enhanced-CR, size, T1-CR, and MTR values of the lesions at the time of initial enhancement, stratified for appearance on noncontrast T1-weighted images, are reported in Ta-ble 1. As compared with isointense lesions, hypoin-tense lesions had a significantly higher enhanced-CR and larger size, whereas MTR and T1-CR were sig-nificantly lower (Table 1). For isointense lesions, MTR was significantly lower relative to the corre-sponding area of normal-appearing white matter (mean, 0.473; range, 0.43 to 0.51) 1 month before enhancement (Z5 24.29; P,.01).
Twelve lesions (10%) showed ring enhancement and 114 (90%) showed nodular enhancement. All ring-enhancing lesions were hypointense. Compared with nodular-enhancing lesions, ring-enhancing le-sions had significantly lower MTR (0.39 versus 0.31,
F1,126530.24,P,.01), significantly greater enhance-ment (27.8 versus 15.2 mm2, F
1,1265 7.21,P,.01), and significantly lower T1-CR (0.83 versus 0.88, F1,126
5 4.57, P, .04). No distinction could be made be-tween isointense and hypointense appearance and location of active lesions in the brain.
For all 126 lesions, T1-CR correlated significantly (P , .01) with size of enhancing lesion (r 5 2.61), MTR (r5.61), and enhanced-CR (r5 2.34). MTR correlated significantly (P, .01) with size of lesion (r5 2.68) and with enhanced-CR (r5 2.35). As for MR parameters that predict a hypointense appear-ance on the initial MR examination, multiple regres-sion analysis yielded a model with a multipleR2of .53. The MR parameters included in the model were MTR (T57.54,P, .001) and size of enhancement (T5 22.67,P,.01). When MTR was left out of the equation, enhanced-CR (T5 22.18,P, .04) could be added to the model (R2 5 .33; size of enhance-ment, T 5 26.38; P , .01). All lesions with an enhancement size of more than 20 mm2(n534) were hypointense. In contrast, only 67 (73%) of 92 active lesions with a size equal to or less than 20 mm2were hypointense. In those lesions with an enhancement size of more than 20 mm2, MTR was significantly lower (F1,126 5 55.01,P , .01) than that of lesions with an enhancement size of less than 20 mm2.
Follow-up Findings and Relationship between Baseline and Follow-up Parameters
[image:3.587.54.534.85.126.2]For 78 lesions, enhancement was visible on only one scan, for 38 lesions it was visible on two consec-utive scans, for five lesions on three scans, for three lesions on four scans, for one lesion on five scans, and for one lesion on six scans. During 6 months of follow-up, 19 of 25 initially isointense lesions remained isoin-tense (six lesions became hypoinisoin-tense, of which four showed reenhancement). Forty-five of 101 initially hypointense lesions remained hypointense, while 56 lesions became isointense, most (86%) after 1 or 2 months. For persistently isointense lesions and for lesions that changed from hypointense to isointense, MTR increased significantly (Z 5 22.59 and Z 5 25.63, respectively; bothPvalues,.01) (Figs 1 and 2). However, MTR was still significantly lower than the corresponding area of white matter at the MR examination 1 month before enhancement (Z 5 22.22,P,.03; and Z5 25.31,P,.01, respectively). No significant change in MTR was found during 6 months of follow-up for persistently hypointense
TABLE 1: Median (IQR) degree of hypointensity (T1-CR), level of enhancement (enhanced-CR), size of enhancement, and MTR of lesions at time of initial enhancement, stratified for pattern of appearance on unenhanced T1-weighted images
Signal Intensity No. of Lesions Enhanced-CR (range) Size, mm2(range) T
1-CR (range) MTR (range)
Isointense 25 1.13 (1.08–1.16) 6 (5–10) 0.96 (0.92–0.99) 0.43 (0.41–0.45)
Hypointense 101 1.19 (1.14–1.27) 12 (8–25) 0.88 (0.79–0.92) 0.38 (0.34–0.41)
Note.—IQR indicates interquartile (25% to 75%) range; enhanced-CR, enhanced contrast ratio; T1-CR, unenhanced contrast ratio; and MTR,
magnetization transfer ratio. Compared with isointense lesions, enhanced-CR (F1,126512.36) and size of enhancing lesions (F1,12659.37) were
lesions (Z5 21.61,P5.11) (Fig 1). For persistently hypointense lesions, size decreased significantly after 6 months’ follow-up as compared with size at initial time of enhancement (median interquartile): 19 mm2 (9.5 to 30.5 mm2) versus 11 mm2(6 to 18 mm2) (Z5
23.33,P,.01). For those lesions that changed from isointense to hypointense during follow-up, MTR was significantly lower after 6 months (0.42 versus 0.34, Z5 22.02,P5 .043).
For 115 lesions, follow-up was longer than 6 months (7 to 11 months). In this remaining time, only four lesions changed in appearance on unenhanced T1-weighted images. Three lesions became isointense after appearing hypointense at 6 months. One lesion became hypointense. No significant change in MTR was found after 7 to 11 months’ follow-up.
Mean MTR, enhanced-CR, T1-CR, and size at the time of initial enhancement (stratified for pattern of appearance during 6 months of follow-up on unen-hanced T1-weighted images) are given in Table 2. Using a logistic regression analysis, we included only the enhancement pattern in a model to predict per-sistence of hypointense appearance during 6 months of follow-up (Wald 5 4.34, P , .04). Seventy-five percent of the ring-enhancing lesions remained hy-pointense versus 41% of the nodular-enhancing lesions.
Findings at 6 Months’ Follow-up
After 6 months, 75 (60%) of the 126 active lesions were isointense and 51 (40%) appeared hypointense. As for the pattern of enhancement, MTR was signif-icantly lower in ring-enhancing hypointense lesions than in nodular-enhancing hypointense lesions (0.36 versus 0.41, F1,10159.62,P,.01). No distinction was apparent with regard to isointense or hypointense appearance for location of active lesions in the brain. To predict SI (isointensity or hypointensity) of ac-tive lesions at the 6-month follow-up, a model was found with anR2 of .13, including the following pa-rameters: MTR at the time of initial enhancement (T 5 3.30, P , .01) and duration of enhancement (T5 22.00,P,.05). After 6 months, 26 (48%) of 54 lesions with an MTR value lower than 0.39 at the time of initial enhancement had hypointense SI on non-contrast T1-weighted images. In non-contrast, 25 (35%) of 72 lesions with an MTR value higher than or equal to 0.39 had hypointense SI. After 6 months, 23 (48%) of 48 lesions with an enhancement duration of at least two scans showed hypointense SI on the noncontrast T1-weighted images. In contrast, 30 (38%) of 78 le-FIG1. MR patterns of appearance of MS lesions on
noncon-trast T1-weighted spin-echo MR images.1, pattern D: persis-tently hypointense (n545);2, pattern A: persistently isointense (n 5 19); 3, pattern C: temporarily hypointense, returning to isointense during 6-month follow-up period (n556);4, pattern B: temporarily isointense, becoming hypointense during 6-month follow-up (n56). No significant change in MTR was found during 6-month follow-up for persistently hypointense lesions (P 5 .11). For persistently isointense lesions and for temporarily hypointense lesions, MTR increased significantly (both P values , .01). For temporarily isointense lesions, of which four reenhanced during follow-up, MTR decreased signif-icantly (P5.043).
FIG2. MR patterns of active MS lesions on unenhanced
[image:4.587.58.279.63.221.2]T1-weighted images. During 6-month follow-up after initial en-hancement, lesions showed different patterns of appearance on unenhanced T1-weighted images: pattern A, initially isointense lesions remain isointense; pattern B, initially isointense lesions become hypointense; pattern C, initially hypointense lesions be-come isointense; and pattern D, initially hypointense lesions remain hypointense. In general, changes in appearance on un-enhanced T1-weighted images are followed by changes in MTR.
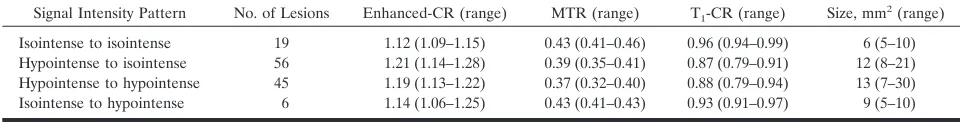
TABLE 2: Median (IQR) level of enhancement (enhanced-CR), MTR, degree of hypointensity (T1-CR), and size of enhancing lesions at time of initial enhancement distributed on the basis of pattern of appearance on unenhanced T1-weighted images during 6 months of follow-up
Signal Intensity Pattern No. of Lesions Enhanced-CR (range) MTR (range) T1-CR (range) Size, mm2(range)
Isointense to isointense 19 1.12 (1.09–1.15) 0.43 (0.41–0.46) 0.96 (0.94–0.99) 6 (5–10)
Hypointense to isointense 56 1.21 (1.14–1.28) 0.39 (0.35–0.41) 0.87 (0.79–0.91) 12 (8–21)
Hypointense to hypointense 45 1.19 (1.13–1.22) 0.37 (0.32–0.40) 0.88 (0.79–0.94) 13 (7–30)
Isointense to hypointense 6 1.14 (1.06–1.25) 0.43 (0.41–0.43) 0.93 (0.91–0.97) 9 (5–10)
Note.—IQR indicates quartiles (25% to 75%); enhanced-CR, enhanced contrast ratio; T1-CR, unenhanced contrast ratio; and MTR,
[image:4.587.54.284.363.530.2] [image:4.587.52.532.658.719.2]sions with an enhancement duration of only one scan showed hypointense SI. For those lesions with an enhancement duration of at least two scans, MTR was significantly lower at 6 months’ follow-up than that in lesions showing enhancement during only one scan (F1,1265 5.00,P,.03).
Appearance on T2-Weighted Images
Eight lesions (6%) had no visible hyperintense sig-nal on corresponding T2-weighted images at the time of initial enhancement. All of these lesions appeared isointense with surrounding white matter. Seventeen active lesions (13%) were not visible on the T2-weighted images at 6 months’ follow-up. Seven of these lesions remained isointense and 10 changed from hypointense to isointense during follow-up. Sev-enteen active lesions, of which four showed ring-enhancement, had visible hyperintense signal on T2-weighted images 1 month before enhancement.
Change in Enhancement Pattern during Follow-up
Thirty-eight lesions enhanced during at least two examinations. Ninety-two percent of these lesions oc-curred in three patients (one with relapsing-remitting disease and two with secondary-progressive disease) with EDSS scores above 4.0 (range, 4.5 to 7.0). Of these 38 lesions, 11 changed from nodular to ring enhancing in appearance during follow-up. After add-ing “secondary” radd-ing-enhancadd-ing lesions to the radd-ing- ring-enhancing lesions at the time of initial enhancement, the predictive value for persistence in hypointense appearance of the total group of ring-enhancing le-sions increased slightly and became more significant (Wald56.13,P5.013). Seventy-eight percent of this group of ring-enhancing lesions appeared hypoin-tense at 6 months’ follow-up. Two of 11 secondary ring-enhancing lesions were already visible as hyper-intense lesions on T2-weighted images 1 month be-fore enhancement.
Comparison of Patients with Relapsing-Remitting versus Secondary-Progressive MS
The percentage of active lesions that appeared hy-pointense on corresponding unenhanced T1-weighted images was almost equal for patients with secondary-progressive and relapsing-remitting MS (84% versus 79%, respectively). In patients with secondary-progressive disease, enhanced-CR was significantly higher (F1,233 5 11.55, P , .01) and T1-CR was significantly lower (F1,23355.56,P,.02) than that in patients with relapsing-remitting disease.
In relapsing-remitting MS, 61% of all initially hy-pointense lesions became isointense after 6 months, compared with only 48% in secondary-progressive MS (neither difference statistically significant). Twen-ty-two percent of all active lesions remained isoin-tense in patients with relapsing-remitting MS, as com-pared with 11% in those with secondary-progressive
MS. All lesions that changed from isointense to hy-pointense occurred in the secondary-progressive group of MS patients. Compared with patients with relapsing-remitting disease, duration of enhancement was significantly longer (F1,124527.12,P,.01) and T1-CR at 6 months was significantly lower (F1,1245 9.06,P, .01) in patients with secondary-progressive MS. At 6 months, 47% of all active lesions were hypointense in secondary-progressive MS, compared with 31% in relapsing-remitting MS.
Discussion
In this study, the majority of active lesions ap-peared slightly to significantly hypointense at the time of initial enhancement. Our results correspond indi-rectly with results of other studies (4, 13). Comparing MR enhancement patterns with both MTR and SI on unenhanced T1-weighted MR images, a mean MTR of 0.32 (range, 0.29 to 0.41) was found for homoge-neous enhancing lesions by Hiehle et al (4) (MTR of white matter not indicated). In another study (13), nodular-enhancing lesions were not assessed for hy-pointensity on unenhanced T1-weighted images; how-ever, mean MTR of nodular-enhancing lesions (0.30) was similar to that of slightly hypointense lesions (0.31) studied on noncontrast T1-weighted images. Regarding ring-enhancing lesions, earlier studies (4, 13) found strongly decreased MTR values and all lesions appeared hypointense on T1-weighted images, which is in accordance with our results. With regard to ring-enhancing lesions, it was suggested that they represented reactivated (older) MS lesions (13). We found a T2 lesion 1 month before enhancement in only 33% of ring-enhancing lesions and in 18% of the 11 secondary ring-enhancing lesions. This indicates that ring enhancement may be the first manifestation of new activity or may be a change in enhancement morphology over time, and that ring enhancement is not restricted to reactivation of older MS lesions alone.
follow-up of active lesions regarding SI on unen-hanced T1-weighted images, three studies have de-scribed serial MTRs in active lesions during 3 to 12 months of follow-up (9–11). In two of these studies (9, 11), all active lesions showed a rapid restoration of MTR values after a marked reduction in MTR at the time of initial enhancement, and it was suggested that this increase in MTR during follow-up may be related to remyelination. In our study, this pattern resembles pattern C, temporary hypointense lesions. In the other study (10), lesions with a moderate decrease in MTR returned to normal, and those lesions that showed a deep decrease in MTR did not return to normal, although MTR did increase. It was suggested that the first pattern was associated with inflamma-tion and slight demyelinating changes followed by
remyelination. The other pattern was associated with strong demyelination and incomplete remyelination. In comparison with these studies, we observed two additional patterns: that lesions with an initial deep decrease in MTR may show a rapid restoration in MTR and may return to a normal appearance on T1-weighted and MT images, or they do not recover at all (no increase in MTR values).
Recently, different patterns of lesional abnormali-ties have been distinguished in the formation of MS plaques, including demyelination with no or only mi-nor loss of oligodendrocytes, myelin destruction with concomitant and complete destruction of oligoden-drocytes, and severely destructive lesions with loss of myelin, oligodendrocytes, axons, and astrocytes (15). Although the histopathologic substrate of the MR FIG4. Contrast-enhanced T1-weighted (500/15/2) image (A) versus corresponding unenhanced T1-weighted (500/15/2) images at the
time of initial enhancement (B) and after 6 months (C). One enhancing lesion is visible onA, which appears severely hypointense at the time of initial enhancement (B), while after 6 months it has disappeared (C), resembling MR pattern C. In this lesion, MTR increased from 0.39 at the time of initial enhancement to 0.45 after 6 months.
parameters studied is still vague, we will attempt to interpret the development of new MS lesions on MR images in light of the above-mentioned histopatho-logic patterns.
In MR pattern A, probably only minor demyelina-tion occurs and may even be purely edematous or inflammatory in nature (16). These isointense lesions may represent the less aggressive lesions, as evi-denced by the significantly lower enhanced-CR and size than that of hypointense lesions. The fact that MTR was slightly lower than the MTR of a corre-sponding area of white matter before enhancement may be related to inflammatory infiltration accompa-nied by edema and only minor demyelination, which is in accordance with findings in experimental allergic encephalomyelitis (7). Furthermore, a recent study comparing spectroscopy with MTR suggested that small changes in MTR relative to MTR of white matter may reflect inflammatory changes and edema (17), which is also in accordance with our suggestion. In our study, MTR increased in isointense lesions after 6 months, which was probably due mainly to resolution of edema. Pattern B occurred quite infre-quently, and since 66% reenhanced during follow-up, we do not believe this pattern represents a separate entity.
In temporary hypointense lesions (MR pattern C), demyelination with no or only minor loss of oligoden-drocytes, accompanied by edema, may occur. In these lesions, MTR strongly increases during follow-up, which may be related to remyelination (11, 18–20) in the presence of preserved oligodendrocytes and to a lesser extent by resolution of edema. Interestingly, MTR of these lesions was still significantly lower than MTR in corresponding white matter 1 month before enhancement, which may be related to abnormal my-elin density after remymy-elination (18, 19). Persistently hypointense lesions (MR pattern D) may histopatho-logically reflect myelin destruction with concomitant destruction of oligodendrocytes or severely
destruc-tive lesions with loss of myelin, oligodendrocytes, ax-ons, and astrocytes. In these lesiax-ons, no change or even a further decrease in MTR was found. We spec-ulate that the loss of oligodendrocytes parallels a deficit in available repair mechanisms and leads to axonal loss and persistent functional loss. The pathol-ogy of such chronic black holes (3) supports the use of these lesions as surrogate markers of persistent defi-cits (2). Ring-enhancing lesions may represent the most destructive lesions, given the fact that 75% of them remained hypointense after 6 months’ follow-up (Fig 6) and that MTR was significantly lower in these lesions than in homogeneously enhancing lesions, which is in accordance with an earlier study (21).
Almost all enhancing lesions were accompanied by a hyperintense lesion on the corresponding T2-weighted images. After 6 months’ follow-up, some hyperintense lesions disappeared. Half of these le-sions changed from hypointense to isointense on un-enhanced T1-weighted images during the 6-month follow-up period. In line with an earlier speculation, remyelinated lesions may return to an isointense ap-pearance on T2-weighted images, indicating that in some cases remyelination may result in complete repair.
were MTR at the time of enhancement and duration of enhancement. Because we considered it more im-portant to detect MR parameters, which predict per-sistence of hypointense lesions, we also compared patterns C and D by logistic regression analysis. Only the pattern of enhancement was found to be a (weak) contributor: ring-enhancing lesions become persis-tently hypointense more often than nodular-enhanc-ing lesions do.
Although the number of MS patients studied was small, we looked at differences between those with relapsing-remitting and secondary-progressive dis-ease. In accordance with an earlier study, in which more T2 changes were accompanied by T1 changes in secondary-progressive MS than in relapsing-remitting MS (2), we found that more enhancing lesions remain hypointense after 6 months’ follow-up in secondary-progressive MS than in relapsing-remitting MS. This suggests that enhancing lesions are more destructive in secondary-progressive disease, as supported by the significantly higher enhanced-CR and lower T1-CR in these lesions.
A 6-month period for follow-up is arbitrary and perhaps short, but the majority of lesions that changed in appearance on unenhanced T1-weighted images did so in the first 2 months after enhancement.
Furthermore, only four lesions changed in appear-ance during 6 to 11 months of follow-up.
When the above assumptions are further sup-ported, differentiation in MR patterns of enhancing lesions on noncontrast T1-weighted images may well serve as a putative outcome parameter in future treat-ment trials. One could then study whether treattreat-ment efficacy is based on protection against blood-brain barrier disruption, prevention of demyelination, or induction of remyelination by comparing percentages in patterns of appearance on unenhanced T1-weighted images between the treated and untreated arms of the study. In a clinical setting, detection of large, persistent, ring-enhancing lesions in patients would be a poor prognostic sign.
Conclusion
We found that the majority of enhancing lesions appear slightly to significantly hypointense on unen-hanced T1-weighted images, and we observed two types of evolution regarding the hypointense appear-ance during follow-up: temporary and persistently (chronic) hypointense MS lesions. Furthermore, only ring enhancement is a predictive MR parameter (al-though weak) for persistence of hypointense lesions. FIG6. Contrast-enhanced T1-weighted
Acknowledgments
We thank B. Verbeeten Jr for his support at the MR scanner and T. Schweigmann for his help with scanning. Furthermore, we thank B. M. J. Uitdehaag for referring the patients, and H. J. Ade`r for his statistical assistance.
References
1. van Walderveen MAA, Barkhof F, Hommes OR, et al.Correlating MR imaging and clinical disease activity in multiple sclerosis: relevance of hypointense lesions on short TR/short TE (“T1-weighted”) spin-echo images.Neurology1995;45:1684–1690 2. Truyen L, van Waesberghe JHTM, Barkhof F, van Oosten BW,
Hommes OR, Polman CH. Accumulation of hypointense lesions (“black holes”) on T1-weighted images of multiple sclerosis pa-tients correlates with disease progression in secondary progressive MS patients.Neurology1996;47:1468–1476
3. van Walderveen MAA, Scheltens Ph, van Waesberghe JHTM, et al.
Hypointense lesions on T1-weighted SE MR images correlate with axonal loss in multiple sclerosis.Proc Soc Magn Reson1997;1:75 4. Hiehle JF, Grossman RJ, Ramer KN, et al.Magnetization transfer
effects in MR-detected multiple sclerosis lesions: comparison with gadolinium-enhanced spin-echo images and nonenhanced T1-weighted images.AJNR Am J Neuroradiol1995;16:69–77 5. Katz D, Taubenberger JK, Canella B, Mc Farlin DE, Raine CS, Mc
Farland HF. Correlation between magnetic resonance imaging findings and lesion development in chronic, active multiple sclero-sis.Ann Neurol1993;34:661–669
6. Nesbit GM, Forbes GS, Scheithauer BW, Okazaki H, Rodriguez M.
Multiple sclerosis: histopathologic and MR and/or CT correlation in 37 cases at biopsy and three cases at autopsy.Radiology1991; 180:467–474
7. Dousset V, Grossman RI, Ramer KN, et al.Experimental allergic encephalomyelitis and multiple sclerosis: lesion characterization with magnetization transfer imaging.Radiology1992;182:483–492 8. Dousset V, Brochet B, Vital A, et al.Lysolecithin-induced demy-elination in primates: preliminary in vivo study with MR and magnetization transfer.AJNR Am J Neuroradiol1995;16:225–231 9. Rovira A, Alonso J, Cucurella G, et al.Serial magnetization
trans-fer and contrast-enhanced MR imaging in multiple sclerosis.
J Neuroimmunol1995;(Suppl I):49
10. Dousset V, Brochet B, Gayou A, et al.Magnetization transfer profile of demyelinating CNS lesions.Proc Soc Magn Reson1995; 1:114
11. Lai HM, Davie CA, Gass A, et al.Serial magnetization transfer ratios in gadolinium-enhancing lesions in multiple sclerosis.J Neu-rol1997;244:308–311
12. Berry I, Barker G, Barkhof F, et al.A multi-centre measurement of magnetization transfer ratio in normal white matter. Proc Soc Magn Reson1996;1:536
13. Petrella JR, Grossman RI, McGowan JC, Campbell G, Cohen JA.
Multiple sclerosis: relationship between MR enhancement pattern and magnetization transfer effect.AJNR Am J Neuroradiol1996; 17:1041–1049
14. Stone LA, Frank JA, Albert PS, et al.The effect of interferon-beta on blood-brain barrier disruptions demonstrated by contrast-en-hanced magnetic resonance imaging in relapsing-remitting multi-ple sclerosis.Ann Neurol1995;37:611–619
15. Lucchinetti CF, Bru¨ck W, Rodriguez M, Lassmann H.Distinct patterns of multiple sclerosis pathology indicates heterogeneity in pathogenesis.Brain Pathol1996;6:259–274
16. Rose LM, Richards TL, Petersen R, Perterson J, Hruby S, Alvord EC. Remitting-relapsing EAE in nonhuman primates: a valid model of multiple sclerosis.Clin Immunol Immunopathol1991;59: 1–15
17. Kimura H, Grossman RI, Lenkinski RE, Gonzalez-Scarano F. Pro-ton MR spectroscopy and magnetization transfer ratio in multiple sclerosis: correlative findings of active versus irreversible plaque disease.AJNR Am J Neuroradiol1996;17:1539–1547
18. Prineas JW, Barnard RO, Revesz T, Kwon EE, Sharer LR, Cho ES.
Multiple sclerosis: pathology of recurrent lesions.Brain1993;116: 681–693
19. Prineas JW, Barnard RO, Kwon EE, Sharer LR, Cho ES.Multiple sclerosis: remyelination of nascent lesions. Ann Neurol1993;33: 137–151
20. Compston A.Remyelination of the central nervous system.Multiple Sclerosis1996;1:388–392