J. exp. Biol. (1979). 8a, 299-301 2 8 9 JVith 10 figures
printed in Great Britain
METABOLIC SOURCES OF HEAT AND POWER
IN TUNA MUSCLES
I. MUSCLE FINE STRUCTURE
BY W. C. HULBERT, M. GUPPY, B. MURPHY AND P. W. HOCHACHKA
Department of Zoology, University of British Columbia, Vancouver, B.C., Canada V6T 1W5
(Received 26 October 1978)
SUMMARY
As part of an investigation into the generation of muscle heat in the tuna, the histochemistry and ultrastructure of the myotomal muscles were studied. Both red and white fibres are differentiated into two forms. The two forms of red muscle are very similar except for differential electron absorbance and different kinds of glycogen granules stored. In both forms, capillarity, mitochondrial numbers, and intracellular lipid droplets are abundant, implying the potential for a vigorous aerobic metabolism. During bursts of swimming, glycogen granules and intracellular lipid droplets are both largely depleted. The two types of white fibre differ in electron absorbance, pinocyotic activity, glycogen abundance, and insertion pattern, all of which are more pronounced in the 'dense' fibre form. Several features of tuna white muscle are unique or unusually developed. Thus, tuna muscle contains more glycogen than does red muscle. Glycogen granules may be randomly dispersed in myofibrillar or peripheral regions or may be sequestered in membrane-bound structures termed glycogen bodies. During short bursts of swimming, glycogen granules from all storage sites are mobilized. The white muscle has an ample capillary supply, small, but significant, amounts of intracellular lipid, and unusual numbers of mito-chondria.
INTRODUCTION
Although most fishes can raise their body temperature by only 1-2 °C above ambient, many tunas, both large and small, can warm their muscles. As was first shown by Carey & Teal (1966), this is partly achieved by the maintenance of large thermal gradients between tuna muscles and ambient water by a heat exchanger (or rete) positioned between muscles and gills (Carey et al. 1971).
290 W . C . HULBERT AND OTHERS
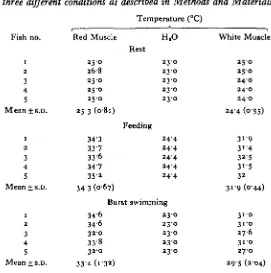
Table 1. Temperatures of deep red and deep white muscle taken under
three different conditions as described in Methods and Materials
Fish no. 1 2 3 4 5 Mean±s.D. 1 2 3 4 5 Mean±s.D. 1 2 3 4 5 Mean±s.D. Red Muscle
2 5 0
2 6 8
2 5 0 2 5 0 2 5 0 2 5 3 (081)
34-3 3 3 7 3 3 6 3 4 7 35'2 343 (067)
Temperature (°C) H,O Rest
2 3 0 2 3 0 2 3 0 2 3 0 2 3 0
Feeding 24-4 24-4 2 4 4 2 4 4 2 4 4
Burst swimming
3 4 6
34'6 3 2 0 33-8 3 2 0 33-4(i-32)
2 3 0 2 3 0 2 3 0 2 3 0 2 3 0
White Muscle
2 5 0 2 5 0 2 4 0 2 4 0 2 4 0
24-4 (055)
3 1 9 3 1 4 3 2 5 3i-5 32 31 9 (044)
3 1 0 3 1 0
2 7 6
3 1 0
2 7 0 295 (204)
'burst' swimming for 10 min periods, red muscle temperature can rise by up to nearly 10 °C above ambient, while white muscle temperature is usually about 5 °C above ambient. Whereas deep red muscle under these conditions is always uniformly warm, the temperature of white muscle increases with depth below the surface of the muscle, a feature also observed previously (see Carey et al. 1971; Stevens et al. 1974). Finally, during the highly activated feeding frenzies observed at sea both red and white muscle temperatures rise by similar amounts, sometimes by over 10 °C (Table 1).
These thermal gradients are similar to ones seen before (Carey et al. 1971; Stevens & Fry, 1971; Graham, 1975) and can tell us how much heat is generated to warm the muscles. To determine which metabolic processes generate the heat in red muscle and in white, we examine ultrastructure and histochemistry of the muscles in this paper, and in the subsequent paper (Guppy, Hulbert & Hochachka, 1979) we examine enzyme profiles, fuel utilization and end-product accumulation. A pre-liminary report has been published (Hochachka, Hulbert & Guppy, 1978).
METHODS AND MATERIALS Experimental animals
Heat and power in tuna muscle. I 291 faonolulu, Hawaii, or from local fishermen working out of Honolulu. Tissue samples Tor enzyme, metabolite, or ultrastructural studies were only taken from fish which
had been in captivity for less than 3 days.
Transmission electron microscopy
Muscle tissue was collected from fresh fish and fixed in 5% glutaraldehyde, 6% paraformaldehyde in ioomM sodium phosphate buffer, pH 7-4, for 1-5 h followed by washing with sodium phosphate buffer and post-fixation in 1-5 % osmium tetroxide. The muscle pieces were subsequently dehydrated in a graded ethanol series and embedded in Epon 812. Thin sections were cut using glass knives fitted to a Porter Blum MT-i ultramicrotome, negatively stained with uranyl acetate and lead citrate, and viewed with a Zeiss EM-10, as described elsewhere (Hulbert & Moon, 1978).
Light microscopy
For light microscopy, sections (about 1 -o fim) were cut from the same blocks that were used for EM studies. Slides were processed in 5% haemotoxylin-eosin and examined using a Zeiss light microscope.
Estimates of cell diameters, SR volume and mitochondrial frequency
Cell diameters were estimated from large field photographs of frozen and glutaralde-hyde-fixed, light microscopy sections taken from five fish. Sarcoplasmic reticulum volume was estimated from sections from two fish which were fixed in situ. Mito-chondrial cross-sectional areas were estimated on a weight basis from electron micrographs prepared from five fish.
Histochemistry
Muscle pieces for histochemical analyses were excised from fresh skipjack, immersed for 1 min in a bath of isopentane cooled with liquid nitrogen and then placed directly in liquid nitrogen. The tissue blocks were sectioned in a cryostat at - 2 0 °C (10 /im sections), picked up on glass slides and allowed to dry 2-3 min before staining with haemotoxylin-eosin or processing specifically for either LDH or SDH. The slides were then mounted in 15% gelatin.
Succinic dehydrogenase staining
Slides were incubated at room temperature in 0-05 M sodium phosphate buffer, pH 7-6, 0-05 M sodium succinate and 1 mg/ml Nitro blue tetrazolium in a final volume of 50 ml. Slides were then washed in saline (4% NaCl), fixed in 10% formalin saline for 10 min, washed in distilled water, taken through an ethanol series and mounted. The site of enzyme activity was evidenced by blue-purple diformazan deposits. Control slides were processed in the absence of succinate and showed no staining.
LDH staining
292 W. C. HULBERT AND OTHERS
sodium phosphate buffer. Slides were then rinsed in distilled water, taken
an ethanol series and mounted. Sites of enzyme activity were evidenced by the characteristic blue-purple diformazan deposits. Control slides were incubated in the absence of DL-lactate and produced no staining.
Temperature measurements
Temperature measurements were taken with Yellowsprings Instrument (YSI) temperature probes (22 gauge) which were linked to a YSI Telethermometer, accurate to o-i °C. Temperature measurements were taken within seconds after the fish were killed by spinalectomy at the level of the anterior edge of the dorsal fin. Temperature probes were inserted longitudinally down the fish in either the red or the white muscle. It is important to note that muscle temperature did not change during these manipulations nor for that matter for several minutes afterwards. Measurements were made in deep red muscle (next to the spinal cord) and in deep white muscle (halfway between the red muscle and the dorsal edge of the fish) unless otherwise stated. Muscle temperatures were compared in three different activity states (rest, 'burst' swimming, and feeding frenzy) as described in the companion paper (Guppy et al. 1979).
RESULTS AND DISCUSSION
General observations
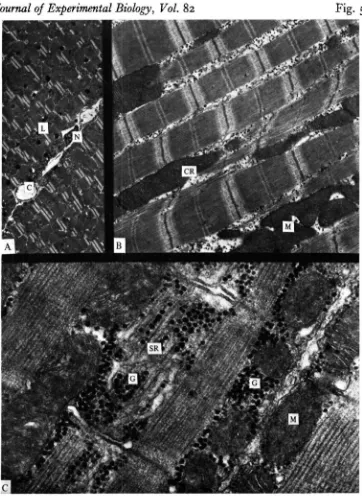
Journal of Experimental Biology, Vol. 82
Fig. 1
Fig, 1, For explanation see opposite.
Journal of Experimental Biology, Vol. 82
Fig. 2
& ',#
Fig. 2. A longitudinal overview ( x 15000) of red muscle showing greater electron absorbance in one type A fibre. This dark form typically displays larger quantities of glycogen (G) and the glycogen granules are of a larger size. Mitochondria (M) and lipid droplets (L) occur with similar frequency in both cell types. Triads (TR) are evidently well developed and are localized to Z-lines (Z). Subsarcoplasmic vesicles are sometimes evident but are usually difficult to locate because of the abundance of subsarcolemmal mitochondria. I, I band; A, A band; ML, M line; SR, sarcoplasmic reticulum.
Journal of Experimental Biology, Vol. 82
Fig- 3
B
Fig. 3. Higher magnification views (x 33 300) of the dark form of red muscle (Fig. 10A) and the light form (Fig. 10B). Both display abundant mitochondria (M) with numerous cristae (C); cristae in both are relatively electron transparent. Note the larger size of glycogen granules (LG) in dark compared to light forms of red fibres (SG), as well as the differential abundance. Lipid droplets (L) are abundant in both fibre forms.
Heat and power in tuna muscle. I 293
*Histochemistry
Staining for SDH results in red muscle staining very darkly and white muscle staining lightly. In both red and white muscles, the reaction is given by only one fibre type, and the bulk of the SDH activity appears in peripheral rather than in myofibrillar positions (Fig. iA). The same results are obtained for samples from anterior and posterior regions of the myotome, and from outer and inner regions.
Although lactate dehydrogenase activity normally may be taken as an index of anaerobic metabolism (Guppy & Hochachka, 1978), the enzyme-specific stain depends upon the back reaction (i.e. lactate oxidation to pyruvate); thus, as with SDH, the LDH stain reaction can be used as an indication of oxidative capacity. When applied to tuna myotome, only two staining patterns are observed, red muscle staining very darkly, white muscle staining lightly (Fig. 1B). The same results are obtained no matter where in the myotome the samples originate. If the lateral red muscle of the tuna were analogous to the intermediate fibres observed in other teleosts (Patterson, Johnston & Goldspink, 1975), the LDH staining pattern should have been either like white muscle or intermediate between red and white muscle.
These results, together with others discussed below, indicate that unlike the three fibre types found in mammalian skeletal muscles and in at least some teleosts (Davidson et al. 1976; Holloszy & Booth, 1976; Holloszy et al. 1978), only two major fibre types (termed red and white) form the tuna myotome. However, at the EM* level, subtle specializations of fine structure (and possible function) occur in both red and white muscle since two forms of each fibre type are distinguishable.
Two red fibre forms
The two types of red fibre are readily identifiable by differential electron absorbance (Fig. 2), 'dark' fibres absorbing electrons more strongly than 'light' fibres. Although the basis for the differential electron absorbance is not fully understood, altered contractile protein composition clearly cannot account for it, for in both ' dark' and 'light' fibre forms the actin/myosin ratio is a standard 6:1.
The two fibre forms can also be readily distinguished by the amount and the kind of glycogen granule stored. In dark fibres, glycogen granules are noticeably more abundant and larger than in light fibres (Figs. 2-4). The large glycogen granules
Fig. 1. (A) Specific stain for succinate dehydrogenase ( x 160), showing high activity (dark stain) in red muscle (RM) and low activity in white muscle (WM). Note that in white muscle, SDH activity is highly localized to the periphery. Fig. 8 A also shows how sharp the discontinuity between red and white muscle can be.
(B) Specific stain for the back reaction of lactate dehydrogenase ( x i6o), showing high acti-vity (dark stain) in red muscle and low actiacti-vity in white muscle; the reverse is seen for the forward reaction (Guppy & Hochachka, 1978).
(C) Sudan Black staining tor hpid ( x 160) in red and white muscle of skipjack tuna. Note the dark staining of the red muscle compared to the white, and the strong peripheral locali-zation of the staining of white fibres. The latter correlates with the peripheral localilocali-zation of SDH (Fig. 8A), LDH (Fig. 8B) and of mitochondria (Figs. 14-16). Note also the inter-digitating RM and WM boundary.
(D) Sudan Black staining of tuna red muscle (x 160), showing differential utilization or deposition of lipid in different fibers. Similar observations are made in electron microscopy studies (Fig. 12A).
294 W . C . HULBERT AND OTHERS
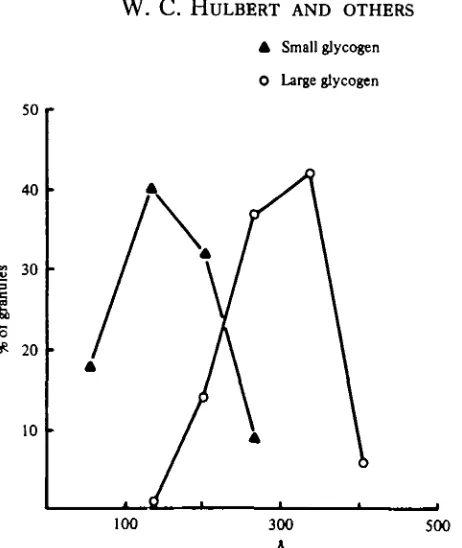
A Small glycogen
0 Large glycogen
50
40
30
20
10
100 300
A
[image:10.451.102.333.50.324.2]500
Fig. 4. A plot of frequency versus size of glycogen granules. It will be evident that only a modest overlap occurs in size of glycogen granules in light and dark fibre forms. Glycogen granules in light fibres are typical /^-particles, while the larger granules in dark fibers are intermediate in size between /9-particles and glycogen rosettes or cx-particles found, for example, in lungfijh white muscle (Hochachka & Hulbert, 1978). An indication of the granular structure of storage glycogen in dork fibres is evident in Fig. 12C.
are unlike typical monomeric /^-particles but are distinctly granular, appearing to be formed from smaller units. The large granules appear to be intermediate between typical /^-particles and the large a-particles found in lungfish muscle (Hochachka & Hulbert, 1978). Wide variation is found in glycogen deposition (or utilization), some fibres being almost devoid of glycogen and occurring immediately adjacent to ones that are glycogen loaded (Figs. 2, 3), a result possibly indicating differential utilization.
Another ultrastructural difference between the 'light' and 'dark' forms of red fibres is sometimes, but not always, seen in the ultrastructure of mitochondrial cristae. In 'light' fibres, mitochondrial cristae are often thickened, quite electron-dense structures (Fig. 5B); in 'dark' cells the cristae are rather electron transparent, often appearing in consequence as minute double membrane structures. Whereas the latter can be found in both kinds of red cells, the former are only found in ' light' cells.
Red muscle: fibre structure
Journal of Experimental Biology, Vol. 82
Fig- 5
Fig. 5. (A) A slightly tangential section (xzioo) of two adjacent red fibres, the upper one showing abundant lipid droplets (L), the lower one showing essentially complete depletion of such droplets. Scans of many micrographs indicate that the latter situation is typical of all fibres following even a short (10 min) burst of swimming. (C) capillary; N, nucleus.
(B) A lateral view of a light fibre form (x 15700) of tuna red muscle showing different types of mitochondria (M) (with more electron-dense cristae). Basket-weave patterns of Z-bands are clearly evident, as are the M and H zones. Note also the relative depletion of interfibrillar glycogen granules. CR, cristae.
(C) A lateral view of a dark fibre form of tuna red muscle (x 57300) showing the well-developed sarcoplasmic reticulum (SR) and the granular nature of the large type of glycogen granules (G) typifying this fibre form.
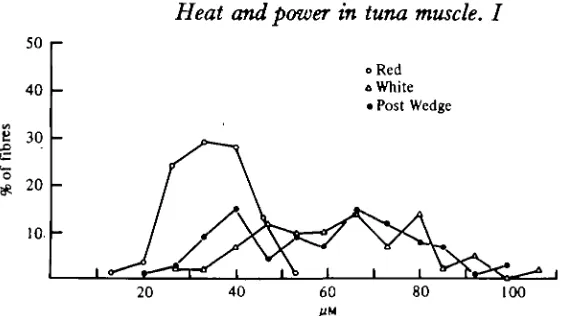
fibre s 0 50 40 30 20 10.
Heat
i-and power in
A ,
1 1 o 1
tuna muscle. I
oRed a White • Post Wedge
295
[image:13.451.69.354.71.229.2]20 40 60 80 100
Fig. 6. A plot of fibre diameters for red and white fibres versus frequency. Fibres were sampled from deep red muscle (O), deep white muscle (A), and from the lateral, posterior wedge ( # ) , which in the skipjack tuna appears to be typical white muscle. Note the large range of fibre diameters in white muscle.
found in teleost muscle (Knappeis & Carlsen, 1962). The H-zones encompassing the M-lines are likewise standard (Fig. 5 B). The sarcoplasmic reticulum is well developed (Fig. 5C), a characteristic of teleost red muscle (Goldspink, 1977; Patterson & Goldspink, 1972). In passing it should be mentioned that fibre insertion in both forms of red muscle is similar and comparable to that in other teleosts (Hulbert & Moon, 1978).
Red muscle mitochondria! abundance
Both 'dark' and 'light' fibres are extremely rich in mitochondria. About 35% of the cross-sectional area consists of mitochondria, a value that is higher than previously observed for any other teleost (see Hochachka et al. 1978). Low-magnifi-cation electron micrographs indicate that in both kinds of red muscle fibres, mito-chondria are found in both myofibrillar and peripheral regions. They are usually more abundant in peripheral regions adjacent to capillaries (Fig. 5 A).
In mammals, myofibrillar and peripheral mitochondria have become specialized for somewhat different functions, energy generation vs. transport (Palmer, Tandler & Hoppel, 1977), and there is a temptation to suggest a similar possibility in tuna red muscles. In particular the impressive mitochondrial mass that is regularly seen surrounding capillaries (Fig. 7) suggests that these are probably specialized for transport functions.
Red muscle capillarity
296 W . C . HULBERT AND OTHERS
Red muscle intracelhilar fat
The abundance of mitochondria plus the copious capillarity imply a highly O2
-dependent metabolism in tuna red muscle. Not surprisingly, both 'light' and 'dark' fibres of tuna red muscle also contain large amounts of intracellular triglyceride. These triglyceride droplets may be myofibrillar in position, usually located near mitochondria, or they may be found peripherally (Figs. 2, 3).
Although both glycogen and lipid droplets are abundant there is differential utilization (or deposition?) by different red muscle fibres. Often within the same electron micrograph there are fibres loaded with lipid droplets adjacent to fibres with the droplets totally depleted (Fig. 5 A). Such specific utilization of lipid is not restricted to either ' light' or ' dark' type fibres, but can occur in either.
Lipid staining with Sudan Black
The differential utilization (deposition?) by different red muscle fibres can also be demonstrated histochemically. Light-microscopic examination of Sudan Black stained sections of red muscle indicates apparently randomly distributed lightly and darkly stained fibres. Lipid rich fibres are uniformly stained, as would be expected from the electron microscopic observations showing relatively random distributions of myofibrillar lipid droplets (Fig. 1C, D).
Exercised red muscle
No ultrastructural changes were observed in red muscle fine structure following severe exercise ('burst' swimming). However, there was a large depletion of glycogen granules and of intracellular lipid droplets (W. C. Hulbert, unpublished data; see also Guppy et al. 1979). Such marked depletion of storage substrates correlates with other metabolite changes discussed in our companion paper (Guppy et al. 1979).
Two white fibre forms
As in red muscle the two fibre types in white muscle displayed marked differences in electron density (Fig. 8 A). The electron-dense fibres had a greater concentration of pinocytotic vesicles than the light fibres, which had a similar level to that of white muscle in other teleosts (Boddeke, Slijper & Van der Stelt, 1959; Mosse, 1978). The vesicles were similar in structure to those in capillaries. They were usually membrane-bound but occasionally opened directly into the interstitium. The ' dense' fibres also differed from ' light' fibres in having a more developed insertion pattern (Fig. 8C) and a higher concentration of glycogen (Fig. 8 A), both between the myofibrils and in the peripheral regions.
Journal of Experimental Biology, Vol. 82
Fig. 7
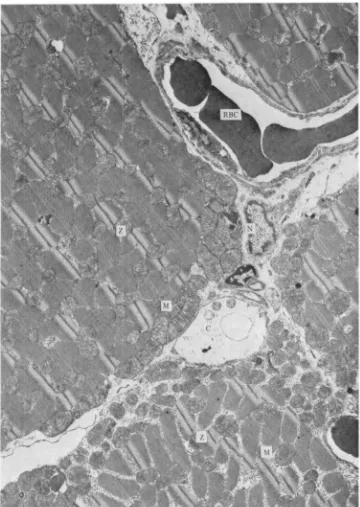
Fig. 7. A low-magnification, slightly tangential (X4600) of red muscle showing the relation-ship between capillary (C) supply and mitochondrial (M) abundance. Note capillary pino-cytosia as well as subsarcolemmal vesicles. RBC, red blood cell; N, nucleus; Z, Z-line.
Journal of Experimental Biology, Vol. 82
Fig. 8
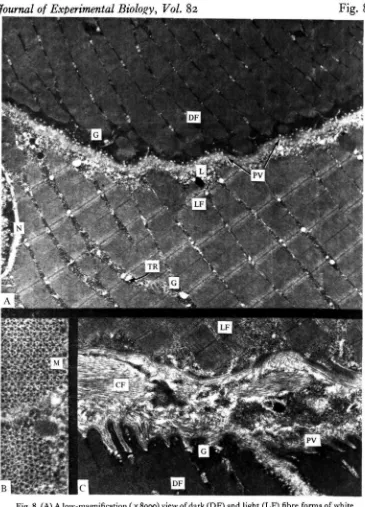
Fig. 8. (A) A low-magnification ( x 8900) view of dark (DF) and light (LF) fibre forms of white muscle in the skipjack tuna. The dark forms typically show extensive pinocytotic vesicles (PV) at their periphery, while these are not observed in the light fibre form. The dark fibre form also contains substantially more glycogen (G), particularly at the periphery. Lipid droplets (L) are periodically seen in either fibre form. Mitochondria are far less abundant than in red muscle and usually occur in peripheral regions. Diads and triads (TR) are evident in both forms. The nucleus (N) of the light fibre appears at the left. (B) A cross-section of tuna white muscle (x 59500) showing the typical 6 :i actin to myosin ratio. (C) Insertion of the light and dark fibre forms (x 11400), showing better development in the dark fibres. A lipid droplet and extensive pinocytosis are evident in the dark fibre form. CF, collagen fibres.
[image:16.451.53.418.36.543.2]Heat and power in tuna muscle. I 297
White muscle: fibre structure
Although in all of the above properties tuna white muscle seems unique, the basic 'contractile machinery' (i.e. the sarcomere fine structure) is similar to that of other teleosts. The ratio of actin/myosin is 6 (Fig. 8B) as typically observed elsewhere, and sarcomere length is I-6-I-J /im, well within the range of white muscle fibres in other teleosts (Hulbert & Moon, 1978). Compared to red fibres, white muscle fibres are large, and show a surprising range of diameters (Fig. 6). In electron micro-graphs of glycogen-depleted muscles, triads are clearly evident as is a highly complex sarcoplasmic reticulum (Figs. 8, 9). The Z-lines display the classical basket-weave pattern and were sometimes observed to be evidently continuous with the triads. The usual teleost pattern is also seen in the H-lines which are evident adjacent to the M-lines (Fig. 8). In none of these characteristics do the two kinds of fibre in tuna white muscle differ from each other.
White muscle lipid, mitochondria and capillarity
Tuna white muscle differs from that of other teleosts in some ultrastructural respects other than those above. For example, tuna white muscle contains relatively substantial amounts of intracellular lipid (Fig. 8 A). Even though such lipid droplets are rare in the white muscle (at least one/fibre) compared to the red muscle, they are far more abundant than in a tissue such as eel white muscle where lipid droplets are rarely if ever found (Hulbert, unpublished data). Histochemical studies show that by comparison with red muscle, tuna white muscle fibres do not stain strongly with Sudan Black, but some staining does occur and is particularly marked in peripheral regions (Fig. 1 C, D). That, too, is where the SDH-specific precipitate stains white muscle fibres most strongly (Fig. iA). These observations, implying a significant capacity for aerobic catabolism, correlate with a relatively high mitochondrial abun-dance. Electron microscopic scans indicate that about 2% of the cross-sectional area is occupied by mitochondria, compared to o-i % in eel white muscle (Hulbert & Moon, 1978) and I - I % in coalfish white muscle (Patterson & Goldspink, 1972). The mitochondria are predominantly peripheral, with myofibrillar mitochondria being observed far less frequently. Cristae are not abundant, but are notably electron-dense compared to mitochondrial cristae in red muscle (Fig. 9).
Capillaries in tuna white muscle approach 1 capillary/fibre (Hochachka et al. 1978), again a value that is relatively high by teleost white muscle standards (Boddeke, Slijper & Van der Stelt, 1959; Mosse, 1978). Although an effective O2 delivery
system is an absolute necessity if lipid is to be catabolized, and to be expected from the large number of mitochondria, our EM studies leave no doubt as to the far greater importance of glycogen as a carbon and energy source for tuna white muscle.
Glycogen storage in tuna white muscle
298 W. C. HULBERT AND OTHERS
Johnston & Goldspink, 1977). ^n ^act> t u n a w nite muscle clearly stores higher concentrations of glycogen than does red muscle, in this feature resembling the mammalian, rather than the teleost, condition. White muscle glycogen is stored either as typical /^-particles that are found both in myofibrillar and peripheral positions, or in distinct glycogen-membrane associations termed glycogen bodies (Fig. 10).
Glycogen bodies appear to be formed primarily in peripheral regions of white muscle fibres and clearly are associated with a complicated membrane system presumed to be specialized sarcolemma. Although the formation of glycogen bodies proceeds initially within the sarcolemma, glycogen bodies were sometimes observed to be 'fixed' in a process of transfer reminiscent of reversed pinocytosis (Fig. 10 D). In this way, glycogen bodies often seem to be removed into interstitial regions, where they are most usually found, frequently with intact mitochondria and a fully intact, bounding membrane (Fig. 10 B). The interstitial regions may occupy on average about 1/5 of the area of electron micrographs. The matrix of the glycogen bodies appears in electron micrographs as a diffuse material, weakly electron absorbing. Similar but less numerous glycogen bodies are also found in tuna red muscle (Hulbert, unpublished observations), and have been reported in heart and red muscle of Amazon air breathing fishes (Hochachka & Hulbert, 1978).
Glycogen depletion in exercise
The participation of glycogen in white muscle metabolism can be conveniently demonstrated by sampling muscle following bursts of swimming. Micrographs of such samples show that glycogen granules can be depleted from all identified storage sites. Thus, following severe exercise, interfibrillar glycogen granules are almost completely utilized, exposing the highly intricate and extensive sarcoplasmic reticulum that typifies white muscle (Fig. 9 A, B). Similarly, peripheral and interstitial glycogen granules are strongly depleted. And perhaps most intriguing of all, even glycogen bodies sustain a potent mobilization of glycogen, electron micrographs of white muscle after exercise showing glycogen bodies depleted of glycogen, leaving only the weakly absorbing matrix (Fig. 10 C).
Implications
Journal of Experimental Biology, Vol. 82
Fig. 9
D
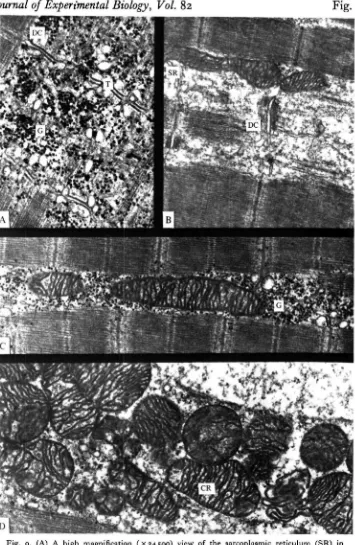
Fig. 9. (A) A high magnification (x 24500) view of the sarcoplasmic reticulum (SR) in tunu white muscle, showing extensive glycogen (G) deposition. T, T-tubules; DC, dilated cisternue. (B) A high magnification (x 23 000) view of the SR in white muscle following a 10 min burst of swimming. Note the dramatic depletion of glycogen granules and the striking appearance of the SR. (C) Interfibrillar mitochondria surrounded by ample glyco3en (G) in unexercised tuna white muscle ( X 21000). These vary in size, up to lengths equivalent to 7 sarcomeres. (D) Tuna white muscle peripheral mitochondria (X 23 400) following a 10 min burst of swimming. In white muscle mitochondria, the cristae (CR) are typically more electron dense than in red muscle mitochondria. Note the relative dearth of glycogen granules.
Journal of Experimental Biology, Vol. 82
Fig. 10
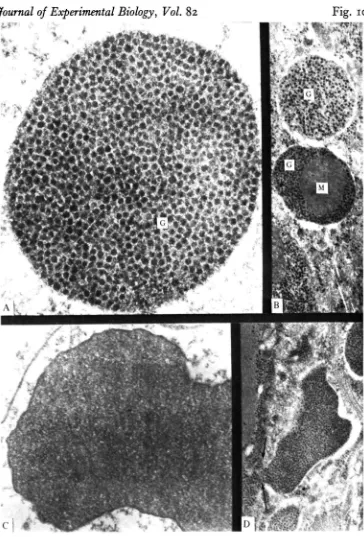
Fig. 10. (A) A high-magnification (x 68 700) view showing the structure of the glycogen body in an unexercised tuna. Note the regular organization of the glycogen (G) granules. (B) Two glycogen bodies in an interstitial region ( x 23 300), one containing a mitochondrion (M). (C) Glycogen body in white muscle ( X 40000) sampled after a 10 min burst of exercise. Note the diffuse electron absorbing matrix of the glycogen body and the absence of glycogen granules. (D) View of a glycogen body ( X 17700) that appears to be in the process of transfer from subsarcolemmal position into the interstitium. Arrows mark the remaining connexion between the glycogen body and the fibre.
Heat and power in tuna muscle. I 299
fcmuscle could be primed by glycogen or fat catabolism, while 'high gear' function of white muscle would depend upon glycogen. Our fine structure studies of tuna red muscle indicate a powerful aerobic metabolic machinery surrounded by ample lipid and glycogen. White muscle, by contrast, has far fewer mitochondria but is packed full of glycogen granules and moreover is well endowed with glycogen bodies; both sources of glycogen could be utilized for anaerobic metabolism. However, there are indications that such description oversimplifies the case in tuna. In the first place, recent electrophysiological studies of unanaesthetized skipjack show that white muscle contributes to sustained as well as to burst swimming (R. Brill and W. C. Hulbert, unpublished data). Secondly, there are metabolic reasons for assuming a more complex situation. If only a simple, two-gear system operated in the tuna myotome, the heat sources for red muscle could be combustion of carbohydrate and/or fat; either process could generate enough heat to account for the observed excess red muscle temperatures (Table 1). The major internal source of heat for white muscle, on the other hand, would have to be anaerobic glycogenolysis, and there is the rub. Since anaerobic glycolysis is energetically inefficient (see Guppy et al. 1979), it could not generate enough heat to account for excess muscle temperatures approaching 10 °C (Table 1). So in its simplest form, even if the two-gear system can possibly account for high swimming speeds, it cannot readily account for warm bodies.
The paradox is readily overcome if it is assumed that in tuna the simple two-gear system is augmented by an overlapping of red and white muscle functions. The overlap is viewed as being largely metabolic rather than mechanical: it requires that at least some (perhaps initial) white muscle work be supported by aerobic catabolism. If such an overlap occurred it (1) would explain the ultrastructural indications of a significant aerobic capacity in tuna white muscle, and (2) would be internally consistent with the high white muscle temperatures that can be achieved in this species.
Further evidence for this idea and attempts to identify major metabolic processes supporting white muscle contributions to different kinds of swimming are presented in our companion paper (Guppy et al. 1979).
This work was supported by an operating grant from the National Research Council of Canada (to P.W.H.). Especial thanks are due to Dr Andrew Dizon, Richard Brill, and other staff members of the National Marine Fisheries in Honolulu. Especial thanks are due the director, Dr R. Shomura, for broadly interpreting our experimental needs, particularly during Tuna-Tora-Tuna. A John Simon Guggenheim Fellowship was held (by P. W. H.) during a part of this study.
REFERENCES
BODDEKE, R., SLIJPER, E. J. & VAN DER STELT, A. (1959). Histological characteristics of the body musculature of fishes in connection with their mode of life. PTOC. Biol. Med. Set. C 6a, 576-589. BONE, Q. (1966). On the function of the two types of myotomal muscle fibers in elasmobranch fish.
300 W . C . HULBERT AND OTHERS
BONE, Q. (1978). Myotomal muscle fiber types in Scomber and Katsuvxmus. In The Physiological!
Ecology of Tuna (ed. G. Sharp and A. Dizon), pp. 183-205. Academic Press.
CAREY, F. G. & TEAL, J. M. (1966). Heat conservation in tuna fish muscle. Proc. natn. Acad. Sci.
U.S.A. 56, 1464-1469.
CAREY, F. G., TEAL, J. M., KANWISHER, J. W. & LAWSON, K. D. (1971). Warm bodied fish. Am.
Zoologist 11, 137-145.
DAVIDSON, W., GOLDSPINK, G. & JOHNSTON, I. A. (1976). The division of labour between fish myotomal muscles during swimming. J. Pkytiol., Lond. 363, 185-186.
GEORGE, J. C. (1962). A histophysiological study of the red and white muscles of the mackerel. Am.
Mid. Nat. 68, 487-494.
GEORGE, J. C. & STEVENS, E. D. (1978). Fine structure and metabolic adaptation of red and white muscles in tuna. Etw. Biol. Fish. 3, 185-191.
GOLDSPINK, G. (1977). Mechanics and energetics of muscle in animals of different sizes, with particular reference to the muscle fiber composition of vertebrate muscle. In Scale Effects in Animal Locomotion
of Vertebrate Muscle (ed. T. J. Pedley), Academic Press.
GRAHAM, J. B. (1975). Heat exchange in the yellowfin tuna and skipjack tuna and the adaptive sig-nificance of elevated temperatures in scombrid fishes. U.S. Fish. Bull. 73, 219-229.
GUPPY, M. & HOCHACHKA, P. W. (1978). Controlling the highest lactate dehydrogenase activity known in nature. Am. J. Physiol. 234 (3), R136-R140.
GUPPY, M., HULBERT, W. C. & HOCHACHKA, P. W. (1979). Metabolic sources of heat and power in tuna muscles. II. Enzyme and metabolite profiles. J. exp. Biol.
HOCHACHKA, P. W. & HULBERT, W. C. (1978). Glycogen 'seas', glycogen bodies, and glycogen granules in heart and skeletal muscle of two air breathing burrowing fishes. Can. J. Zool. 56 (2), 774-786. HOCHACHKA, P. W., HULBERT, W. C. & GUPPY, M. (1978). The tuna power plant and furnace. In
Physiological Ecology of Tuna (ed. G. Sharp and A. Dizon), pp. 153-174. Academic Press.
HOLLOSZY, J. O., WINDER, W. W., FITTS, R. H., RENNIE, M. J., HICHSON, R. C. & CANLEE, R. K.
(1978). Energy production during exercise. In Biochemistry of Exercise: Regulatory Mechanisms in
Metabolism During Exercise (F. Landry and W. A. R. Orban). Int. Congr. Physical Activity Sciences. • (In the Press.)
HOLLOSZY, J. O. & BOOTH, F. W. (1976). Biochemical adaptations to endurance exercise in muscle.
Ann. Rev. Physiol. 38, 273-391.
HULBERT, W. C. & MOON, T. W. (1978). The functional role of eel (Anguilla rostrata) red and white muscle: a histochemical, light, and electron microscopic examination. J. Fish. BioL 13, 527~533-JOHNSTON, I. A. & GOLDSPINK, G. (1977). Energy metabolism of carp swimming muscle. J. comp.
Physiol. 114, 206-316.
JOHNSTON, I. A., DAVISON, W. & GOLDSPINK, G. (1977). Energy metabolism of carp swimming muscle. J. comp. Physiol. 114, 206-215.
KNAPPEIS, G. G. & CARLSEN, F. (1962). The ultrastructure of the Z-disc in skeletal muscle. J. Cell.
Biol. 13, 323-337.
KRYVI, H. & TOTLAND, G. K. (1978). Fiber types in locomotory muscles of the cartilaginous fish
Chimaera montrosa. J. Fish Biol. ia, 257-265.
LIN, Y. DOBBS, G. H. & DEVRIES, A. L. (1974). Oxygen consumption and lipid content in red and white muscles of Antarctic fishes. J. exp. Zool. 189, 379—386.
MOSSE, P. R. L. & HUDSON, R. C. I. (1977). The functional roles of different muscle fiber types identified in the myotomes of marine teleosts: a behavioural, anatomical and histochemical study.
J. Fish Biol. n , 417-430.
MOSSE, P. R. L. (1978). The distribution of capillaries in the somatic musculature of five vertebrate types with particular reference to teleost fish. Cell. Tissue Res. 187, 281-303.
PALMER, J. W., TANDLER, B. & HOPPEL, C. L. (1977). Biochemical properties of subsarcolemmal and interfibrillar mitochondria isolated from rat cardiac muscle. J. biol. Chem. 35a, 8731—8739. PATTERSON, S. & GOLDSPINK, G. (1972). The fine structure of red and white myotomal muscle fibers
of the coalfish (Gadus virens). Z. Zellforsch. 133, 463-474.
PATTERSON, S., JOHNSTON, I. A. & GOLDSPINK, G. (1975). A histochemical study of the lateral muscles of five teleost species. J. Fish Biol. 7, 159-166.
PRITCHARD, A. W., HUNTER, J. R. & LASKER, R. (1971). The relation between exercise and biochemical changes in red and white muscle and liver in the jack mackerel, Trachurus symmetricus. Fishery Bull. 69, 379-386.
RAYNER, M. D. & KEENAN, M. J. (1967). Role of red and white muscles in the swimming of skipjack tuna. Nature, Lond. 314, 392-393.
SHARP, G. D. & PIRAGES, S. W. (1978). The distribution of red and white swimming muscle, their biochemistry and the biochemical phylogeny of selected scombrid fishes. In The Physiological
Heat and power in tuna muscle. I 301
•STEVENS, E. D. & FRY, F. E. J. (1971). Brain and muscle temperatures in ocean caught and captive skipjack tuna. Comp. Biochem. Physiol. 38A, 203-207.
STEVENS, E. D., LAM, H. M. & KENDALL, J. (1974). Vascular anatomy of the counter-current heat exchanger of skipjack tuna. J. exp. Biol. 61, 145-153.
TAKEUCHI, A. (1959). Neuromuscular transmission of fish skeletal muscles investigated with intra-cellular microelectrode. J. cell. comp. Pkysiol. 54, 211-211.
WALKED, R. M. & JOHANSEN, P. H. (1977). Anaerobic metabolism in goldfish (Carastiui auratus).