Diffusion Imaging in Obstructive Hydrocephalus
Aziz M. Ulug˘, Thuy N. Truong, Christopher G. Filippi, Terry Chun, Jimmy K. Lee, Charles Yang, Mark M. Souweidane, and Robert D. Zimmerman
BACKGROUND AND PURPOSE:Hydrocephalus causes transependymal resorption of spinal fluid that in turn produces periventricular interstitial edema. This study was performed to determine if diffusion imaging can demonstrate this interstitial edema in the periventricular region in patients with obstructive hydrocephalus and if it can be used to assess the treatment response.
METHODS: Twenty-one patients with obstructive hydrocephalus were evaluated with MR diffusion imaging before and after treatment. The change in ventricular size was measured by using the frontal and occipital horn ratio. The signal intensity abnormalities in periventricular white matter were scored. Average diffusion constants (Dav) in the periventricular white matter
were measured before and after treatment and compared with normal values. Post-treatment resolution of MR imaging abnormalities and changes in ventricular volume were compared with changes inDav.
RESULTS: Davmeasured from periventricular white matter was increased in hydrocephalic patients compared with age-matched control subjects by a mean of 6.9% (P < .02). After treatment,Davdecreased by an average of 6.0%:Davdecreased in 11 patients (53%), it remained
essentially unchanged in seven (33%), and it increased in three (14%).
CONCLUSION:For patients with obstructive hydrocephalus, diffusion is usually increased in the periventricular white matter. Therefore, increasedDav may be a clinically useful sign of
hydrocephalus, and it may prove useful in cases with equivocal clinical or imaging findings. Measurement of Dav may be valuable in assessing the treatment response in these patients
becauseDavusually decreases toward normal levels with successful treatment.
Normal CSF dynamics is a balance between the duction and resorption of spinal fluid. Pathologic pro-cesses can occur anywhere along the normal pathway of CSF flow and disrupt this balance. Left untreated, this condition can lead to severe neurologic dysfunc-tion and death (1, 2).
CT and MR imaging studies are instrumental in the assessment of hydrocephalus. Typical features in-clude ventricular dilatation and periventricular white matter edema due to the transependymal resorption of spinal fluid (3–9). However, imaging features may be inconclusive. These findings are not always reliable indicators of hydrocephalus because ventricular dila-tation and periventricular hyperintensity (PVH) are routinely seen in elderly patients (7, 9–11), whereas some hydrocephalic patients have only mild ventric-ular dilatation without PVH (9).
Some have postulated that the diffusion of water in the periventricular region should be increased be-cause of the transependymal resorption of CSF. This process produces an increase in the extracellular wa-ter content in the adjacent tissue (inwa-terstitial edema). Increased diffusion in the periventricular region has been documented in an animal model (12) and in selected clinical cases of normal-pressure hydroceph-alus (13–15). We hypothesize that the average diffu-sion constants (Dav) of the periventricular white
mat-ter increases in obstructive hydrocephalus as a result of this excess extracellular water. In this article, we evaluated the effectiveness of diffusion-weighted (DW) imaging and the quantification ofDavin
iden-tifying periventricular interstitial edema associated with hydrocephalus and in assessing the treatment outcome.
Methods
Twenty-one patients with obstructive hydrocephalus were examined. Patients were included in the study when 1) clinical and morphologic imaging findings characteristic for hydro-cephalus were present, 2) patients were to undergo treatment for the hydrocephalus, and 3) clinical symptoms of hydroceph-alus resolved after treatment. At the time of the first MR measurement, patients ranged in age from 80 days to 67 years Received July 17, 2002; accepted after revision, January 1, 2003.
From the Departments of Radiology (A.M.U., T.N.T., C.G.F., T.C., C.Y., R.D.Z.) and Neurosurgery (J.K.L., M.M.S.), Weill Medical College of Cornell University, New York, NY.
Address correspondence to Aziz M. Ulug˘, PhD, Weill Medical College of Cornell University, Department of Radiology, Box 141, 1300 York Avenue, New York, NY 10021.
©American Society of Neuroradiology
(mean, 13 years⫾17). The causes of hydrocephalus included neoplasms (15 of 21), congenital and non-neoplastic abnormal-ities (six of 21), or vascular malformations (one of 21). All patients were imaged before and after treatment. The time between the first measurement and treatment was less than 2 weeks (range, 0–13 days). The initial post-treatment MR image was obtained within 2 weeks of treatment (range, 0–11 days). The diagnosis and the time between measurements for each patient are listed in Table 1. Nine patients were imaged more than once after treatment, and one patient (patient 2) was imaged twice before treatment and three times after treatment. All studies were conducted by using a 1.5-T whole-body MR imager (GE Signa; General Electric Medical Systems, Milwau-kee, WI) equipped with high-performance gradients by using a manufacturer-supplied quadrature head coil. In all patients, sagittal T1-weighted (TR/TE/NEX, 300/14/1), axial fast spin-echo T2-weighted (3000/91/1), and axial fast fluid-attenuated inversion recovery (FLAIR) (10002/172/1) images were ob-tained with a null time of 2200 ms. In general, all routine axial sequences used a section thickness of 5 mm, a 256 ⫻ 192 matrix, and a 22-cm FOV. All patients were imaged with a diffusion-weighted echo-planar multisection sequence (TR/TE, 10,500/102). Diffusion was measured in three directions (x,y,z) with a b value of 1000 s/mm2for each axis. In addition, an
image without diffusion gradients was obtained. A matrix of 128⫻128 was used for all diffusion images with an FOV of 22 cm and a section thickness of 5 mm.
Routine MR images were evaluated for the presence of hydrocephalus by using standard techniques. We assessed the size of the ventricle before and after treatment by measuring the frontal and occipital horn ratio (FOR), which was the ratio of the width of the frontal horns plus the width of the occipital horns divided by twice the interparietal diameter. This tech-nique has been shown to be reliable method for estimating ventricular volume (16). PVH was graded (9) on FLAIR im-ages, as follows: 0, none; 1, discontinuous with foci seen adja-cent to the frontal and occipital horns of the lateral ventricles; 2, continuous with a pencil-thin continuous line around the ventricles; 3, periventricular halo with a band of hyperintensity
with smooth peripheral margins surrounding the ventricles; and 4, diffuse abnormality with hyperintensity extending from the ventricular margins into the surrounding white matter with irregular peripheral margins. On the basis of previous experi-ence (9), patterns 3 and 4 are considered to represent tran-sependymal resorption of CSF due to hydrocephalus, whereas patterns 0–2 are either normal or nonspecific.
These MR imaging abnormalities associated with hydro-cephalus (ventricular dilatation and PVH) were correlated with the changes in the diffusion constant and with diffusion mea-surements before and after treatment.
To measure the pre- and post-treatment Dav values, an
orientation independent diffusion map was calculated for each pixel from the DW images, as follows:Dav⫽trace/3⫽(Dxx⫹
Dyy⫹Dzz)/3. For each patient,Dav values were then
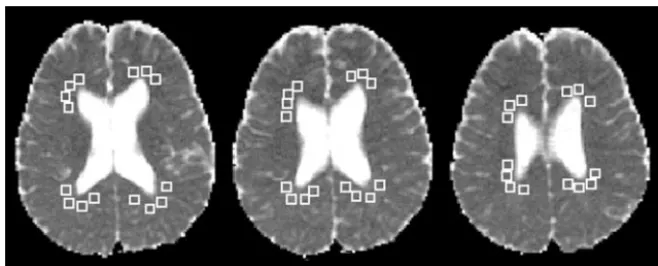
calcu-lated from regions of interest (ROIs) placed over the periven-tricular white matter (Fig 1). In determining Dav for each
patient, we used 25–60 ROIs in multiple sections (two to three sections at the level of the lateral ventricles). Values were obtained from the periventricular region in areas that appeared isointense relative to normal white matter on the diffusion maps. The pre- and post-treatmentDavvalues were compared
with determine the percentage change inDavwith treatment.
Additionally, pre- and post-treatmentDavvalues were
com-pared with normative Dav values. Normal values of Dav for
white matter were calculated from data in 38 adult volunteers and 26 pediatric patients without hydrocephalus from our pre-vious studies (17–19).
Pre- and post-treatmentDavvalues and pre- and
post-treat-ment FOR values were compared by using a paired Studentt
test. We also compared the change in FOR with the change in
Dav. The significance level was set atP⬍.05.
Results
Values ofDav, FOR, and PVH are summarized in
[image:2.603.54.534.70.345.2]Table 2. FOR values decreased by an average of 7.4% after treatment; this was indicative of the resolution
TABLE 1: Diagnosis, age, and time betweenDavmeasurement and treatment in patients with hydrocephalus
Patient Diagnosis Age, y
Time Between First Measurement and
Treatment, d
Time Between Second Measurement
and Treatment, d
1 Choroid plexus papilloma 0.2 3 3
2 Vein of Galen malformation 0.5 9 4
3 Pineal tumor 1.5 1 3
4 Choroid plexus papilloma 2.0 2 6
5 Medulloblastoma 2.1 0* 2
6 Juvenile pilocytic astrocytoma 3.1 2 0*
7 Medulloblastoma 3.4 1 11
8 Subependymal giant cell astrocytoma 4.2 4 2
9 Diencephalic cyst 5.6 2 3
10 Juvenile pilocytic astrocytoma 7.1 0* 1
11 Ependymoma 8.0 1 0*
12 Cerebellar astrocytoma 8.8 1 2
13 Medulloblastoma 8.9 13 5
14 Medulloblastoma 9.2 1 1
15 Juvenile pilocytic astrocytoma 11.3 1 3
16 Hypothalamic glioma 13.9 1 8
17 Aqueduct stenosis 15.9 4 1
18 Aqueduct stenosis 19.6 2 1
19 Primary glioma 22.0 1 0*
20 Aqueduct stenosis 50.4 9 1
21 Colloid cyst of third ventricle 67.5 6 2
Mean 12.6 3.0 2.8
SD 16.8 3.4 2.8
of ventriculomegaly caused by hydrocephalus. After treatment, FOR decreased in 11 patients, it remained fairly constant in nine patients, and it increased in one patient. The difference between pre- and post-treat-ment FOR values was statistically significant (P⬍.003). The average PVH was 2.2 on the initial examina-tion and decreased to 2.0 after treatment. After treat-ment, PVH slightly increased in one patient, it did not change in 15 patients, and it decreased in five pa-tients. PVH was not a reliable indicator of hydroceph-alus or the treatment response.
The average Dav decreased by 6.0% after
treat-ment. The averageDavat different times was plotted
for select patients (Fig 2). Post-treatmentDavvalues decreased in 11 patients, they remained relatively
constant in seven patients, and they increased in three patients. The highest percentage change between pre-and post-treatment values was 26% (patient 18). Post-treatment Davwas significantly lower than
pre-treatmentDav(P⬍.007). In the patients in whom the pretreatmentDavwas normal or decreased, the
post-treatment values did not decrease further.
Pretreatment Dav measured from periventricular white matter was, on average, 6.9% higher in hydro-cephalic patients than in normal control subjects. Re-sults of the pairedttest showed a statistically signif-icant difference between the pretreatment Dav and
the normative Davvalues (P ⬍ .02). The
post-treat-mentDavresults were not significantly different from the normative values (P⬎.64) as a group; this finding
FIG 1. Patient 6. ROIs chosen to mea-sure periventricularDavvalues are shown
onDav maps. TheDav value determined
from 44 periventricular white matter ROIs was 0.85 10⫺5cm2/s (third MR
[image:3.603.53.382.57.190.2]examina-tion).
TABLE 2:Dav, FOR, and PVH values before and after treatment and percentage change
Case
Dav⫻10⫺5cm2/s Change inDav, % FOR Value PVH Value
Before Treatment
After Treatment
Before Treatment vs After Treatment*
Before Treatment vs
Normal†
After Treatment vs
Normal‡
Before Treatment
After Treatment
Change, %§
Before Treatment
After Treatment
1 1.46 1.15 ⫺21.2 25.6 0.1 0.64 0.50 ⫺29.3 2 0
2 1.28 1.12 ⫺12.5 20.5 5.9 0.45 0.44 ⫺2.7 0 1
3 1.17 1.00 ⫺14.5 17.1 0.1 0.58 0.46 ⫺24.1 4 3
4 1.08 0.87 ⫺19.4 10.9 ⫺10.6 0.46 0.41 ⫺12.7 1 1
5 0.85 0.92 8.2 ⫺12.5 ⫺5.3 0.37 0.36 ⫺2.9 2 2
6 0.88 0.91 3.4 ⫺5.6 ⫺2.4 0.40 0.41 1.7 3 3
7 0.87 0.88 1.1 ⫺5.7 ⫺4.6 0.33 0.31 ⫺4.5 2 2
8 0.82 0.79 ⫺3.7 ⫺8.7 ⫺12.0 0.43 0.33 ⫺31.5 3 2
9 0.85 0.84 ⫺1.2 ⫺1.7 ⫺2.8 0.54 0.49 ⫺9.6 3 3
10 0.98 0.92 ⫺5.3 17.0 10.8 0.49 0.45 ⫺7.9 2 2
11 0.79 0.79 0.0 ⫺4.4 ⫺4.4 0.37 0.36 ⫺4.7 2 2
12 0.85 0.82 ⫺3.5 4.9 1.2 0.47 0.48 2.1 3 3
13 0.79 0.80 1.3 ⫺2.5 ⫺1.2 0.35 0.34 ⫺2.6 2 2
14 0.84 0.83 ⫺1.2 4.1 2.9 0.44 0.40 ⫺9.6 2 2
15 0.89 0.80 ⫺9.9 13.0 1.9 0.42 0.40 ⫺5.0 2 2
16 0.79 0.78 ⫺1.3 2.4 1.1 0.41 0.39 ⫺3.3 2 2
17 0.92 0.78 ⫺15.2 20.4 2.1 0.51 0.50 ⫺1.3 3 1
18 0.99 0.73 ⫺26.3 31.0 ⫺3.4 0.43 0.46 6.6 2 1
19 0.84 0.78 ⫺6.9 11.3 3.6 0.39 0.38 ⫺2.7 3 3
20 0.80 0.79 ⫺1.3 7.1 5.8 0.53 0.48 ⫺9.1 2 2
21 0.75 0.77 2.7 0.4 3.1 0.49 0.48 ⫺2.5 2 2
Mean 0.93 0.86 ⫺6.0 6.9 ⫺0.4 0.45 0.42 ⫺7.4 2.2 2.0
SD 0.18 0.11 9.1 12 5.3 0.08 0.06 9.8 0.8 0.8
*P⬍.007
suggested successful treatment. In the nine patients who were imaged multiple times after treatment, the diffusion values stabilized to normal levels.
When the change in FOR was compared with the change in Dav, a linear correlation was observed. A
decrease in the ventricular size correlated with a de-crease in theDavin periventricular white matter. This
correlation, however, was not statistically significant in this patient population (P⬎.35).
Discussion
In certain clinical situations, the diagnosis of hy-drocephalus may be difficult to establish, particularly in the very young or the very old. The ventricles and sulci diminish in size (relative to the overall intracra-nial volume) during the first 2 years of life as the brain matures. Therefore, differentiating normal ventricles from mildly dilated ventricles may be difficult (3). The open cranial sutures alter the pressure and vol-ume dynamics of the intracranial space in the pres-ence of hydrocephalus, leading to variable enlarge-ment of the ventricles and sulci. In elderly patients, atrophy routinely causes some degree of ventricular dilatation. Therefore, the presence of concomitant atrophy and hydrocephalus can limit the diagnostic accuracy of CT and MR imaging (7, 10, 11).
The cases in this series were specifically chosen because the clinical and morphologic findings of hy-drocephalus were clear cut, and yet, grade 3 or 4 PVH was seen in only seven of 21 cases. After treatment, PVH decreased in five patients and increased in one patient. The results show the ineffectiveness of using PVH to assess obstructing hydrocephalus and the effects of treatment.
In animal experiments (12) and in a limited number of patients with normal-pressure hydrocephalus (13– 15) increased diffusion has been identified with DW imaging. Our results provide support for this hypoth-esis. Diffusion, as measured by Dav, was increased
(relative to age-corrected normal values) in the periventricular white matter in areas where no signal
intensity abnormalities were seen on FLAIR and T2-weighted images. Abnormal signal intensity was not visible on DW images or on diffusion maps. There-fore, the detection of increased diffusion required the measurement of Dav from the diffusion maps. The pretreatment changes inDavranged from –12.5% to
31.0%, relative to normal values. This variation prob-ably reflects the extent of subependymal absorption of CSF in these patients. Hydrocephalus is a complex, dynamic process. Factors such as the site and cause of obstruction, the duration of disease, and the patient’s age may affect the degree to which transependymal resorption and other compensatory mechanisms oc-cur in individual patients. In this small series, an assessment of the potential causes of the variation in transependymal absorption was not possible. In the future, the evaluation of data from diffusion imaging may improve our understanding of the compensatory mechanisms that occur in hydrocephalus, and it may aid in treatment planning.
The extent of the decrease inDavwas determined by the extent of the elevation ofDavbefore treatment.
This decrease occurred rapidly. Serial studies in nine patients revealed that Dav decreased continued to
normalize, then remained normal for their age over time (Figs 2 and 3). In the few cases in which the pretreatment study did not show interstitial edema (ie, normalDav, post-treatment values) were not expected to change. Regardless of the initial values, successful treatment resulted in the normalization ofDav.
In two cases, morphologic evidence showed incom-plete decompression of the ventricular system; this was well correlated with Dav measurements. Patient
2 was an infant in whom a vein of Galen malformation was successfully occluded via an endovascular approach without surgical decompression of the ventricular sys-tem. The initial post-treatment MR study demon-strated a mild decrease in both ventricular size and Dav. Subsequent MR imaging performed 7 weeks later revealed a further decrease in both ventricular size and Dav. An examination at 7 months demon-strated a further decrease inDavthat paralleled the
FIG 2. Pre- and post-treatment periventricular white matterDavmeasurements in select patients are displayed relative to values in
age-matched control subjects. Thedotted lineindicates normative values from references 18 and 19.
A, Patients 1– 4.
normal decrease seen in the first year of life (Fig 2). In a second case (patient 16), a hypothalamic glioma was resected and a shunt was inserted. The postsur-gical MR images revealed decompression of the left lateral ventricle but increased dilatation of the right lateral ventricle indicative of unilateral obstruction at the foramen of Monro (Fig 4). The mean Dav was 0.78, but the Dav of the right periventricular white
matter was 0.80, whereas that of the left periventricu-lar white matter was 0.76. These findings indicated that the shunt was not adequately decompressing the right lateral ventricle. After shunt revision, the lateral ventricles became symmetric.
In this patient group, the change in ventricular size (FOR value) and the change in the Dav of the periventricular white matter was statistically signifi-cant after successful treatment. Interestingly, when we correlated these changes with each other, we found a linear relation, as expected. This result showed that, after successful treatment, ventricular
size and periventricular white matter Dav both de-creased. However, this correlation was not statisti-cally significant, possibly because the information given by Dav and the ventricular size was in fact
different. The information given by the ventricular size measurements (FOR values) is morphologic and more related to the increased CSF pressure than to the tissue response. On the contrary, the information given by the periventricular white matter Dav is re-lated to the status of tissue microstructure, and as such, it may be better correlated with the clinical symptoms.
Our study results indicate that diffusion imaging may prove useful in the initial assessment and in the post-treatment monitoring of patients with hydro-cephalus. It is important to note the potential limita-tions of this technique. In some patients with hydro-cephalus, transependymal resorption of CSF may be minimal, and therefore, elevation of Dav is mild or absent. The increased diffusion is not appreciable by
FIG 3. Patient 4. Pre- and post-treatment images in a patient with a third ventricular choroid plexus papilloma.
A, Pretreatment FLAIR images at the level of the foramen of Monro and the lateral ventricles (top row) reveal the presence of the third ventricular choroid plexus papilloma. Ventricular dilatation and a grade 1 PVH are present. TheDavvalue was 1.08, 21% above normal.
Davmaps at the corresponding levels (bottom row) show no evidence of abnormal signal intensity in the periventricular region.
B, Post-treatment images obtained on day 6 after tumor resection. On the FLAIR images (top row), the ventricles are smaller than before, and the PVH has decreased. Postoperative subdural collections are present. TheDavvalue has decreased to 0.87 (19% change)
(bottom row).
C, Subsequent FLAIR images obtained 7 months after surgery reveal no evidence of tumor recurrence (top row). Subdural collections have resolved. TheDavvalue is 0.85, which is normal for the patient’s age (bottom row).
FIG 4. Patient 16. Pre- and post-treat-ment images in a 13-year-old patient with a malignant hypothalamic glioma.
A, Pretreatment FLAIR images (top row) reveal the hypothalamic mass, hydro-cephalus with symmetric dilatation of the lateral ventricles, and a grade 2 PVH.Dav
images (bottom row) demonstrate nor-mal-appearing periventricular white mat-ter. The Dav value was 0.79, only 3%
above normal for the patient’s age.
B, Repeat MR study was performed 7 days after partial resection and shunt placement. FLAIR images (top row) reveal residual tumor in the hypothalamus and asymmetric ventricular dilatation. The left lateral ventricle is smaller, but the right lateral ventricle is larger, consistent with unilateral obstruction at the foramen of Monro. TheDavvalue was also asymmetric (bottom row). In the left periventricular white matter, it had decreased to 0.76, whereas in
means of visual inspection of DW images or diffusion maps. Measurement of Dav in the periventricular
white matter is required. TheDavmust be compared with data from healthy age-matched patients, at least during the pretreatment examination. The normal Davof periventricular white matter is highly age
de-pendent in young children (19). In young children, the change inDavafter treatment may be more
im-portant than the absolute value. Care must also be taken in evaluating the importance of changes inDav
over long periods in children younger than 2 years, because this measurement dramatically decreases with normal brain maturation.Davremains relatively constant throughout the remainder of one’s lifetime, increasing slightly after the age of 60 years (18). A comparison ofDavvalues before and after treatment
should suffice, as our results demonstrated that Dav decreases within a few days of successful treatment. On the basis of our findings, we recommend thatDav be measured several days after treatment. This value can then serve as an internal baseline reference for subsequent examinations. A subsequent elevation of Dav above this internal baseline may be a sign of recurrent hydrocephalus.
Conclusion
We used diffusion imaging to detect periventricular interstitial edema due to transependymal resorption of spinal fluid in hydrocephalic patients. The diffu-sion constant Dav was elevated relative to normal values in age-matched control subjects as a group (average, 6.9%). After successful treatment, the dif-fusion constant rapidly decreased (average decrease, 6.0%). This technique may prove useful in cases in which the clinical and morphologic imaging findings are not diagnostic. Changes in Dav may be a better indicator of the treatment response than the ventric-ular size or the signal intensity changes in the periven-tricular white matter.
Acknowledgments
We thank the competent MR technologists of New York Presbyterian Hospital for performing imaging studies in the patients presented herein.
References
1. Schurr PH, Polkey CE.Hydrocephalus.London: Oxford University Press; 1993
2. Rekate HL.Recent advances in the understanding and treatment of hydrocephalus.Semin Pediatr Neurol1997;4:167–178
3. Barkovich, AJ.Pediatric Neuroimaging2nd ed. Philadelphia: Lip-pincott-Raven; 1996:439–475
4. Tavaras JM, Woods EH.Diagnostic Neuroradiology2nd ed. Balti-more: Williams and Wilkins; 1976:101–102
5. Gunasekera L, Richardson AE.Computerized axial tomography idiopathic hydrocephalus.Brain1977;100:749–754
6. Quisling RQ, Peters KR.Computed tomography.In: Youmans JR, ed.Neurological Surgery4th ed. Philadelphia: Saunders; 1996:101– 105
7. Bradley WM, Quencer RM. Hydrocephalus and cerebrospinal fluid flow.In: Stark DD, Bradley WM eds.Magnetic Resonance Imaging3rd ed. St Louis: Mosby; 1999:1483–1507
8. El Gammal T, Allen MB Jr, Brooks BS, Mark ED.MR evaluation of hydrocephalus.AJNR Am J Neuroradiol1987;8:591–597 9. Zimmerman RD, Fleming CA, Lee BCP, Saint-Louis LA, Deck
MDF.Periventricular hyperintensity as seen by magnetic reso-nance: prevalence and Significance.AJR Am J Roentgenol1986;146: 443–450
10. Jack CR, Mokri B, Laws ER Jr, et al.MR findings in normal-pressure hydrocephalus: significance and comparison with other forms of dementia.J Comput Assist Tomogr1987;11:923–931 11. Bradley Jr. WG. Commentary.MR prediction of shunt response in
NPH: CSF morphology versus physiology.AJNR Am J Neuroradiol 1998;19:1285–1286
12. Ebisu T, Naruse S, Horikawa Y, et al. Discrimination between different types of white matter edema with diffusion-weighted MR imaging.JMRI1993;863–868
13. Gideon P, Thomsen C, Gjerris F, Sorensen PS, Henriksen O.
Increased self-diffusion of brain water in hydrocephalus measured by MR imaging.Acta Radiologica1994;35:514–519
14. Chun T, Filippi CG, Relkin N, Zimmerman RD, Ulug˘ AM. Diffu-sion changes in Normal Pressure Hydrocephalus.Proc Intl Soc Magn Reson Med2000;8:797
15. Ulug˘ AM, Relkin N, Zimmerman RD. Diagnosis of normal pressure hydrocephalus using diffusion imaging.In: Interna-tional Proceedings of the 30th Annual Meeting of the American Aging Association. Madison: American Aging Association; 2001:72
16. O’Hayon BB, Drake JM, Ossip MG, Tuli S, Clarke M.Frontal and occipital horn ratio: a linear estimate of ventricular size for mul-tiple imaging modalities in pediatric hydrocephalus.Pediatr Neu-rosurg1998;29:245–249
17. Ulug˘ AM, Filippi CG, Souweidane M, Zimmerman RD.Use of diffusion imaging for assessing the treatment of obstructive hydro-cephalus.Proc Intl Magn Reson Med1999;7:923
18. Chun T, Filippi CG, Zimmerman RD, Ulug˘ AM.Diffusion changes in the aging human brain.AJNR Am J Neuroradiol2000;21:1078– 1083