Based on forced submergence studies conducted from the 1940s to the early 1970s, it was believed that marine mammals relied primarily on anaerobic metabolism during diving (Elsner and Gooden, 1983; Butler and Jones, 1997). After a forced submergence, there was a net accumulation of lactic acid in the plasma, indicating that anaerobic glycolysis had provided ATP as the organs and tissues became hypoxic. Therefore, it was assumed that marine mammals might have enhanced enzyme activities for anaerobic glycolysis. However, Castellini et al. (1981) showed that, on average, marine mammals do not posses significantly elevated anaerobic enzyme activities when compared with terrestrial mammals. These results were difficult to reconcile with the apparent reliance of marine mammals on
anaerobic metabolism during forced submergence. In the early 1980s, Kooyman et al. (1981) established the concept of the aerobic dive limit (ADL) by measuring the post-dive blood lactate concentration in Weddell seals (Leptonycotes weddellii) following voluntary dives from an isolated ice hole in Antarctica. The ADL is defined as the longest dive that a marine mammal can make while relying principally on oxygen stored in the lungs, blood and muscles to maintain aerobic metabolism. They found that dives shorter in duration than the ADL showed no post-dive increase in blood lactic acid, indicating that metabolism had remained aerobic. By attaching time-depth recorders to free-ranging Weddell seals, they showed that most voluntary dives were within the ADL. Similar results have been
doi:10.1242/jeb.00654
Pinnipeds (seals and sea lions) have an elevated mitochondrial volume density [VV(mt)] and elevated
citrate synthase (CS) and β-hydroxyacyl-CoA dehydrogenase (HOAD) activities in their swimming muscles to maintain an aerobic, fat-based metabolism during diving. The goal of this study was to determine whether the heart, kidneys and splanchnic organs have an elevated VV(mt) and CS and HOAD activities as parallel
adaptations for sustaining aerobic metabolism and normal function during hypoxia in harbor seals (Phoca vitulina). Samples of heart, liver, kidney, stomach and small intestine were taken from 10 freshly killed harbor seals and fixed in glutaraldehyde for transmission electron microscopy or frozen in liquid nitrogen for enzymatic analysis. Samples from dogs and rats were used for comparison. Within the harbor seal, the liver and stomach had the highest VV(mt). The liver also had the highest CS
activity. The kidneys and heart had the highest HOAD activities, and the liver and heart had the highest lactate dehydrogenase (LDH) activities. Mitochondrial volume densities scaled to tissue-specific resting metabolic rate
[VV(mt)/RMR] in the heart, liver, kidneys, stomach and
small intestine of harbor seals were elevated (range 1.2–6.6×) when compared with those in the dog and/or rat. In addition, HOAD activity scaled to tissue-specific RMR in the heart and liver of harbor seals was elevated compared with that in the dog and rat (3.2× and 6.2×in the heart and 8.5× and 5.5× in the liver, respectively). These data suggest that organs such as the liver, kidneys and stomach possess a heightened ability for aerobic, fat-based metabolism during hypoxia associated with routine diving. However, a heightened LDH activity in the heart and liver indicates an adaptation for the anaerobic production of ATP on dives that exceed the animal’s aerobic dive limit. Hence, the heart, liver, kidneys and gastrointestinal organs of harbor seals exhibit adaptations that promote an aerobic, fat-based metabolism under hypoxic conditions but can provide ATP anaerobically if required.
Key words: diving, hypoxia, harbor seal, Phoca vitulina, metabolism.
Summary
Introduction
Adaptations to diving hypoxia in the heart, kidneys and splanchnic organs of
harbor seals (Phoca vitulina)
Amanda L. Fuson
1,*, Daniel F. Cowan
2, Shane B. Kanatous
3, Lori K. Polasek
1and
Randall W. Davis
11Department of Marine Biology, Texas A&M University at Galveston, 5007 Avenue U, Galveston, TX 77551, USA, 2Department of Pathology, University of Texas Medical Branch, 301 University Boulevard, Galveston, TX
77555-0555, USA and 3Department of Internal Medicine, University of Texas Southwestern Medical Center, 5323 Harry Hines Boulevard, Dallas, TX 75390-8573, USA
*Author for correspondence at present address: Division of Nephrology, University of Alabama, Birmingham, AL 35294, USA (e-mail: alfuson@uab.edu)
found in other species of marine mammals and birds (Butler and Jones, 1997; Ponganis et al., 1997).
A marine mammal’s response to ‘exercise’ during diving is counterintuitive in the context of our normal understanding of the mammalian exercise response. When terrestrial mammals exercise, they increase ventilation and cardiac output, and peripheral vasodilation increases skeletal muscle perfusion and allows heat dissipation through the skin (Rowell, 1986; Wagner, 1991). By contrast, marine mammals undergo apnea (breath-holding), bradycardia (reduction in heart rate) and peripheral vasoconstriction, which are collectively known as the dive response. As cardiac output decreases, reflex peripheral vasoconstriction maintains central arterial blood pressure by reducing flow to all organs and tissues except the brain. Although the degree of bradycardia and peripheral vasoconstriction may vary with the dive duration or level of exertion, all organs and tissues, including the heart, kidneys, and splanchnic organs, experience a reduction in convective oxygen delivery resulting from both hypoxic hypoxia (decrease in O2supply without a decrease in blood flow) and ischemic
hypoxia (the condition in which blood flow is reduced or stopped) (Butler and Jones, 1997; Davis and Kanatous, 1999; Kanatous et al., 2001). By the end of aerobic dives, the arterial oxygen partial pressure (PaO∑) in Weddell seals is as low as
3.2×10²·Pa (Qvist et al., 1986; Davis and Kanatous, 1999),
which is equivalent to the degree of hypoxia experienced by human climbers on the top of Mt Everest (approximately 8850·m). At this altitude, the maximum oxygen consumption of climbers is reduced to 25% of that at sea level (West et al., 1983). Nevertheless, pinnipeds maintain aerobic metabolism during most free-ranging dives (Kooyman et al., 1983; Davis et al., 1991; Hochachka, 1992; Butler and Jones, 1997).
Previous research on adaptations that enable tissues to maintain normal function during diving have focused mostly on skeletal muscle. Kanatous et al. (1999) found that pinniped skeletal muscle has an increased mitochondrial volume density [VV(mt)] that is most pronounced in the muscles used for
swimming. The increased VV(mt) is thought to facilitate
aerobic metabolism under hypoxic diving conditions by decreasing the diffusion distance between mitochondria and intracellular oxygen stores in the form of oxy-myoglobin. The increased VV(mt) results in an increased citrate synthase (CS)
activity and maximum aerobic capacity, although this may not be important to marine mammals that make long dives, because they use cost-efficient modes of locomotion to conserve oxygen stores and prolong dive duration (Williams et al., 2000; Davis et al., 2001). It was also found that the β -hydroxyacyl-CoA dehydrogenase (HOAD) activity in the skeletal muscle of pinnipeds was significantly greater than in the skeletal muscle of terrestrial mammals (Kanatous et al., 1999). HOAD activity is indicative of aerobic, fat-based metabolic potential (Pette and Dölken, 1975; Simi et al., 1991). Since the skeletal muscles of pinnipeds show an increased VV(mt) that facilitates aerobic metabolism under hypoxic
conditions, the question arises of whether other organs and tissues show similar adaptations.
The goal of the present study was to determine whether harbor seals have an elevated VV(mt) and enzymatic capacity
for aerobic metabolism in their heart, kidneys and splanchnic organs. Our results show that harbor seal organs have an enhanced VV(mt) when scaled to tissue-specific resting
metabolic rate (RMR) that decreases the diffusion distance of oxygen between mitochondria during hypoxia. When scaled to tissue-specific RMR, CS and HOAD activities in these organs are also elevated, indicating a reliance on aerobic, lipid-based metabolism. These adaptations enable harbor seals to maintain aerobic metabolism and physiological homeostasis under hypoxic conditions associated with voluntary dives. LDH activity was also measured in the pyruvate to lactate (anaerobic) direction, and our results point to a heightened anaerobic ability in harbor seal organs. However, the possibility of adaptation for the oxidation of lactate to pyruvate cannot be eliminated.
Materials and methods Tissue sampling
Tissue samples from 10 adult or sub-adult harbor seals (Phoca vitulina L.) were taken within seven hours of death as part of a native subsistence hunt in Alaska. The heart, kidneys, liver, stomach and intestines were removed in their entirety and weighed. Multiple samples (2–3·g) were taken from the left ventricle of the heart, a non-standardized reniculi of the right kidney, a non-standardized lobe of the liver and the fundus of the stomach. Only the cortex of the kidney and mucosal layer of the stomach were analyzed. Samples from the intestine were taken at half the length of the entire intestine, in the jejunum. For comparison, equivalent samples were obtained from three laboratory rats (Rattus norvegicus L.; Sprague-Dawley strain) from the Health and Kinesiology Department at Texas A&M University and three dogs (Canis familiaris L.) sacrificed for research purposes at the Texas A&M College of Veterinary Medicine. Tissue samples were taken in accordance with guidelines for the humane treatment of animals at Texas A&M University.
Samples taken for electron microscopy were fixed in 2% glutaraldehyde and remained in the fixative for approximately 30·days before being minced and stored in 0.1·mol·l–1
cacodylate buffer at pH 7.4 prior to embedding. Since samples were taken after death and were immersion fixed, some tissue autolysis may have occurred. However, serious autolysis was not apparent in the electron micrographs of any of the tissues. Samples for enzymatic analysis were immediately frozen in liquid nitrogen until they were returned to Texas A&M University, after which they were stored at –70°C.
Mitochondrial volume density
Fixed samples were rinsed in 0.1·mol·l–1 cacodylate buffer
passed through propylene oxide and increasing concentrations of epoxy (50–100%). They were finally embedded in epoxy and allowed to polymerize overnight at 60°C. Semi-thick sections (1·µm) were cut with a Leica Ultratome (Reichert Division of Leica Co., Vienna, Austria) and stained with toluidine blue. Ultrathin (50–70·nm) sections from four randomly selected blocks per sample were cut, placed on a copper grid (150 Mesh) and contrasted with lead citrate and/or uranyl acetate. Micrographs were taken with a Phillips 201 transmission electron microscope (FEI Company, Eindhoven, The Netherlands). Final image magnification was approximately 18·150×. The number of micrographs taken for each block ranged from 10 to 20, yielding a total of 40–80 micrographs per sample. We calculated VV(mt) from digitized
micrographs using a standard point-counting technique (Hoppeler et al., 1981; Mathieu et al., 1981). Electron micrographs from the cardiac muscle were used only if the sections were transverse or oblique in orientation.
Mitochondrial distribution
The intracellular distributions of mitochondria in the liver, kidney and stomach were semi-quantitatively characterized in ≥40 micrographs per species. Micrographs in which the mitochondria were more uniformly distributed were classified as ‘homogeneous’, and those with tightly packed mitochondria with areas of cytoplasm devoid of mitochondria were classified as ‘clustered’ (Jones, 1984). The classification was conducted independently by two of the authors. The results were compared, and those micrographs with differing classifications were discarded from the analysis. The percentages of micrographs with homogeneous and clustered mitochondria were calculated for the tissues of each species.
Enzyme assays
Frozen tissue samples were thawed, blotted, weighed and immediately homogenized in a volume of buffer (1·mmol·l–1
EDTA, 2·mmol·l–1MgCl
2and 50·mmol·l–1imidazole, pH 7.0
at 37°C) according to their mass and type (300× dilution for heart, 30× for liver, 10× for kidney and 5× for stomach or intestine) in a ground glass homogenizer (Reed et al., 1994). The homogenates were centrifuged at 2900·g for 50·min at 4°C. Enzyme analyses were performed at 37°C on a PowerWaveX 340 microplate reader (Bio-Tek Instruments,
Inc., Winooski, VT, USA). The assay conditions for CS (EC 4.1.3.7) were: 0.5·mmol·l–1 oxaloacetate, 0.4·mmol·l–1 acetyl
CoA, 5,5′-dithiobis(2-nitrobenzoic acid) and 50·mmol·l–1
imidazole, pH 7.5; DA412, ∈412=13.6, where DA indicates
absorbance wavelength and ∈ is the extinction coefficient. Assay conditions for HOAD (EC 1.1.1.35) were: 0.1·mmol·l–1
acetoacetyl CoA, 0.15·mmol·l–1 NADH, 1·mmol·l–1 EDTA
and 50·mmol·l–1imidazole, pH 7.0; DA
340, ∈340=6.22. Assay
conditions for LDH (EC 1.1.1.27) were: 1·mmol·l–1pyruvate,
0.15·mmol·l–1 NADH and 50·mmol·l–1 imidazole, pH 7.0;
DA340, ∈340=6.22. Enzyme activities in micromoles of
substrate converted per minute per g wet mass (IU·g–1·wet·mass·tissue) were calculated from the rate of
change in absorbance at the maximum linear slope (Reed et al., 1994). CS activity in the small intestine was below the limit of detection for our system, so the samples were combined to yield only one measurement for each species.
Statistical analysis
Results are expressed as means ± S.E.M. VV(mt) was
determined for six seals, three rats (exclusive of kidney cortex) and three dogs. Enzyme activities were determined for 10 seals, three rats (exclusive of kidney cortex) and three dogs. Inter-organ and inter-species comparisons of mean values of VV(mt) and enzyme activities were analyzed using an analysis
of variance (ANOVA; Tukey HSD; P<0.05). Rat kidney was not included in either analysis due to a sample size of only one. CS activity in the intestine was not analyzed statistically because only a single value could be obtained for each species. In addition to the above analyses, values for VV(mt) and
enzyme activities were scaled to each tissue’s calculated specific RMR to adjust for differences in body mass between the seals and the control species. Based on the work of Wang et al. (2001), the scaling exponent for the RMR of individual organs and tissues is more variable than for whole-body RMR. Therefore, instead of scaling VV(mt) and enzyme activities
with the whole-body RMR, estimated as 70Mb–0.25
(Schmidt-Nielsen and Duke, 1984), where Mbis the body mass of the
animal (in kg), we used the estimated specific RMR for each organ or tissue (Wang et al., 2001). The estimated tissue-specific RMRs (kJ·kg–1·day–1) were as follows: liver
RMR=2861Mb–0.27, heart RMR=3725Mb–0.12, kidney
RMR=2887Mb–0.08, stomach and intestine RMR=125Mb–0.17.
Statistical comparisons of scaled VV(mt) and enzyme activities
among species were made using an ANOVA (Tukey HSD; P<0.05). Statistical comparisons among species for CS/HOAD and LDH/CS ratios were also made using an ANOVA (Tukey HSD, P<0.05). CS/HOAD was used as an index of potential fatty acid oxidation versus the overall aerobic metabolism of the animal, with a ratio less than one indicating that fatty acids can provide most of the acetyl CoA for the Krebs cycle (Pette and Dölken, 1975; Simi et al., 1991). LDH/CS was used as an index of relative anaerobic versus aerobic metabolic capacities (Hochachka et al., 1982). All statistical analyses were performed with SYSTAT version 10.
Results Tissue morphology
well-defined cristae and thick, darkly staining double membranes (Fig.·2). Electron micrographs were taken from random areas of the cortex of the kidney, and mitochondria were generally very round and highly distinguishable from other structures (Fig.·3). There appeared to be two different populations of renal mitochondria in close proximity that exhibited differential staining; one stained lightly while the other took
on a darker stain (Fig.·4). Electron micrographs of the stomach were taken mostly at the mucosal surface where metabolism should be active due to the secretion of hydrochloric acid, potassium chloride, traces of other electrolytes and a glycoprotein called ‘gastric intrinsic factor’, which is essential
A
B
C
F
F F
F
M
F
F
F M
M
M
F
F
M
M M
M
M
M
M
M
F
F F
Fig.·1. Representative electron micrographs from the heart of a harbor seal (A), dog (B) and rat (C). M, mitochondria; F, myofibers. Magnification is approximately 18·150×. Scale bar, 1·µm.
Fig.·2. Representative electron micrographs from the liver of a harbor seal (A), dog (B) and rat (C). M, mitochondria; N, nucleus. Note the relatively homogeneous distribution of mitochondria in the seal liver, whereas the dog and rat liver display more clustering. Magnification is approximately 18·150×. Scale bar, 1·µm.
A
B
C
M
M M
M
M
M M
M
M
M
M
M M
N
for the absorption of vitamin B12(Junqueira et al., 1998). The
mitochondria in the stomach were generally very round with distinctive membranes and were easily distinguishable from other structures (Fig.·5). Micrographs of the small intestine were taken mostly near the microvilli, where nutrient
absorption occurs. Mitochondria in the intestine were not as easily distinguishable due to areas of dense connective tissue and some cellular autolysis (Fig.·6).
Harbor seal inter-organ comparisons
The mean VV(mt) of the seal liver (26.4) was significantly
greater than in the heart and kidney (18.6 and 21.4, respectively; Table·1). Stomach VV(mt) (24.5) was also
significantly greater than that in the heart (18.6). VV(mt) in the
liver, heart, kidney and stomach were significantly greater than in the intestine (8.9). The mean CS activity in the heart (73.8·IU·g–1·wet mass tissue) was significantly greater than in
the liver (13.5·IU·g–1·wet mass tissue), kidney (15.4·IU·g–1·wet
mass tissue) and stomach (11.4·IU·g–1·wet mass tissue)
(ANOVA, P<0.05), but there were no significant differences among liver, kidney and stomach (Table·2). The mean HOAD activity in the kidney (2.4×10²·IU·g–1·wet mass tissue) was
significantly greater than in the heart (1.0×10²·IU·g–1·wet mass
tissue), liver (11.2·IU·g–1·wet mass tissue), stomach
(4.4·IU·g–1·wet mass tissue) and intestine (3.4·IU·g–1·wet mass
tissue), but there were no significant differences between the liver and stomach. The mean LDH activity in the liver (1.1×10³·IU·g–1·wet mass tissue) was significantly greater than
in the heart (6.9×10²·IU·g–1·wet mass tissue), kidney
(1.9×10²·IU·g–1·wet mass tissue), stomach (1.6×10²·IU·g–1·wet
mass tissue) and intestine (2.5×10²·IU·g–1·wet mass tissue),
and the LDH activity in the heart was significantly greater than in the kidney, stomach, and intestine (statistical analysis not shown). There were no significant differences in LDH activity among the kidney, stomach and intestine. The CS/HOAD ratio ranged from 6.0×10⁻² in the kidney to 2.6 in the stomach
(Table·3). Except for the stomach, the CS/HOAD ratios were close to or less than one, indicating that the β-oxidation of fatty acids could provide most of the acetyl-CoA for the citric acid cycle. The LDH/CS ratio ranged from 9.9 in the heart to
A
B
C
M
M M
N
M
M
M
M
M
M R
R
M
M
N M
M
M
Fig.·3. Representative electron micrographs from the kidney (cortex) of a harbor seal (A), dog (B) and rat (C). M, mitochondria; N, nucleus; R, red blood cell. Note the relatively homogeneous distribution of mitochondria in all three species. Magnification is approximately 18·150×. Scale bar, 1·µm.
1.58×10³ in the intestine. Only one intestinal CS value was
recorded for each species.
Mitochondrial volume density among species
Mean VV(mt) in harbor seal liver was significantly greater
than in the dog and rat (26.4%, 17.3% and 13.2%,
respectively; Table·1; Fig.·7). The VV(mt) in harbor seal
kidney was significantly greater than in the dog (21.4% and 16.6%, respectively). Stomach VV(mt) in the harbor seal was
significantly greater than in the rat (24.5% and 13.3%, respectively). There were no significant differences in VV(mt) among species in either the heart or the small
intestine.
A
B
C
M
M
M M
M
M
M M M M
M
M
A
B
C
M
M
M M
N N
N N
N
N N
N
M M M
M
N M
M
M
M
Fig.·5. Representative electron micrographs from the stomach of a harbor seal (A), dog (B) and rat (C). M, mitochondria; N, nucleus. Note the relatively homogeneous distribution of mitochondria in all three species. Magnification is approximately 18·150×. Scale bar, 1·µm.
The VV(mt)/RMR in the harbor seal heart, liver, stomach
and intestine were significantly greater than in the rat. The VV(mt)/RMR in the harbor seal liver, kidney, stomach and
intestine were greater than in the dog (Table·4; Fig.·8). The VV(mt)/RMR in the dog heart, liver and stomach were also
[image:7.612.63.566.98.317.2]significantly greater than in the rat.
Table 1. Mean body mass, percent organ mass and mitochondrial volume density [VV(mt)] for heart, liver, kidney, stomach and intestine in the harbor seal, dog and rat
Mass % VV(mt)
Species (kg) Organ Body mass (%)
Harbor seals (Phoca vitulina) (N=6) 43.8±6.3 Heart 0.7 18.6±0.9
Liver 2.7 26.4±0.9α,δ
Kidney 0.6 21.4±0.9α
Stomach 1.2 24.5±1.5δ
Intestine 4.2 8.9±1.0
Dogs (Canis familiaris) (N=3) 9.2±0.5 Heart 0.8* 18.2±0.8
Liver 2.3* 17.3±1.2
Kidney 0.6* 16.6±1.0
Stomach 0.8* 21.3±3.4
Intestine 2.7* 6.0±0.5
Rats (Rattus norvegicus) (N=3, N=1 for kidney) 0.48±0.03 Heart 0.3† 22.8±4.7
Liver 3.7† 13.2±1.7
Kidney 0.7† 18.7
Stomach 0.5† 13.3±3.8
Intestine 2.2† 7.5±1.8
Values are means ±S.E.M. (N = no. of animals). VV(mt), volume density of total mitochondria; all quantities expressed per tissue volume. *Percent organ mass for dogs from Davis et al. (1975). †Percent organ mass for rats from International Life Sciences Institute Risk Science Institute (1994). αsignificantly different from dog (ANOVA, P<0.05); δsignificantly different from rat (ANOVA, P<0.05); ωsignificantly different from harbor seal (ANOVA, P<0.05). Values with noS.E.M. were not included in the analysis and are presented for comparison.
Table 2. Enzyme activities of citrate synthase (CS), β-hydroxyacyl-CoA dehydrogenase (HOAD) and lactate dehydrogenase (LDH) in the heart, liver, kidney, stomach and intestine of harbor seals, dogs and rats
Mass
Species (kg) N Organ CS activity HOAD activity LDH activity
Harbor seals 46.1±4.3 10 Heart 73.8±5.1 1.0×10²±3.8α,δ 6.9×10²±20.5α 8 Liver 13.5±0.3α 11.2±0.5α,δ 1.1×10³±66.5α,δ
10 Kidney 15.4±0.3 2.4×10²±45.6 1.9×10²±6.1
10 Stomach 11.4±2.0 4.4±0.7 1.6×10²±16.8
9 Intestine 0.16 3.4±0.3 2.5×10²±13.0α
Dogs 9.2±0.5 3 Heart 71.8±2.1 38.3±7.4 5.4×10²±46.7
3 Liver 8.2±0.3 2.0±0.1 3.1×10²±18.9
3 Kidney 21.3±0.7ω 1.7×10²±66.0 2.1×10²±21.2ω
3 Stomach 21.8±4.6 4.2±0.9 2.1×10²±18.9
3 Intestine 0.14 2.4±0.2 1.3×10²±3.2
Rats 0.48±0.03 3 Heart 1.2×10²±7.7*,α,ω 27.5±1.1* 1.3×103±81.1*,α,ω
3 Liver 12.3±0.8α 7.1±0.4α 8.1×10²±11.6α
1 Kidney 18.7 143.8 1.0×10²
3 Stomach 16.8±5.0 6.7±1.5 1.7×10²±12.2
3 Intestine 0.22 6.0±0.7α,ω 2.7×10²±4.0α
[image:7.612.56.566.413.631.2]Mitochondrial distribution
Mitochondrial distribution in the liver of the harbor seal was very homogeneous (87.8% of the micrographs; Fig.·2), whereas only 8.7% and 4.8%, respectively, of dog and rat liver micrographs had homogeneously distributed mitochondria. For harbor seal and dog kidney, 49% and 50%, respectively, of the micrographs were classified as homogeneous (Fig.·3). Again, rat kidney was not included in the analysis due to a sample size of only one. For harbor seal stomach, 91.3% of the micrographs were classified as homogeneous, whereas only 76% and 69%, respectively, of dog and rat stomach micrographs were classified as homogeneous (Fig.·5).
Enzyme activities
The mean CS activity in the rat heart was significantly greater than in the harbor seal or dog (124.7·IU·g–1·wet mass
tissue, 73.8·IU·g–1·wet mass tissue and 71. 8·IU·g–1·wet mass
tissue, respectively; Table·2). The CS activities of harbor seal and rat liver (13.5·IU·g–1·wet mass tissue and 12.3·IU·g–1·wet
mass tissue, respectively) were not significantly different, but both were significantly greater than in the dog (8.2·IU·g–1·wet
mass tissue). CS activity in the dog kidney was significantly greater than in the harbor seal (21.3·IU·g–1·wet mass tissue
and 15.4·IU·g–1·wet mass tissue, respectively). Other organs
exhibited no significant differences in CS activity among the three species. The CS/RMR activity of the harbor seal liver was significantly greater than that of the dog and rat (1.3×10⁻²,
5.2×10⁻³ and 3.5×10⁻³, respectively; Table·5; Fig.·9). No
differences among species existed in the CS/RMR activity of the heart or stomach. An analysis was not conducted for the intestine because only one CS activity measurement was made for each species.
Mean HOAD activity in harbor seal heart was significantly greater than in the heart of dogs and rats (1.0×10²·IU·g–1·wet
mass tissue, 38.3·IU·g–1·wet mass tissue and 27.5·IU·g–1·wet
mass tissue, respectively; Table·2). Harbor seal liver also had a significantly greater HOAD activity when compared with that of the dog and rat (11.2·IU·g–1·wet mass tissue, 2.0·IU·g–1·wet
mass tissue and 7.1·IU·g–1·wet mass tissue, respectively). The
[image:8.612.314.560.74.243.2]HOAD activity in the liver of rats was significantly greater than in dogs. The HOAD activity in the small intestine of the rat Table 3. Citrate synthase/β-hydroxyacyl-CoA dehydrogenase
(CS/HOAD) and lactate dehydrogenase (LDH)/CS ratios for the heart, liver, kidneys, stomach and intestine of harbor
seals, dogs and rats
Species N Organ CS/HOAD LDH/CS
Harbor seals 10 Heart 0.7±0.05α,δ 9.9±1.0
8 Liver 1.2±0.05α,δ 80.5±5.4α
10 Kidney 0.06±0.01α 12.2±0.4α
10 Stomach 2.6±0.3α 15.7±1.7
9 Intestine 0.05 1583.1
Dogs 3 Heart 1.9±0.4δ 7.5±0.6
3 Liver 4.1±0.2 38.3±1.2
3 Kidney 0.1±0.04 9.8±0.7
3 Stomach 5.2±0.1 10.2±1.6
3 Intestine 0.06 988.8
Rats 3 Heart 4.5±0.4 10.9±0.7
3 Liver 1.7±0.2α 66.3±4.5α
1 Kidney 0.1 5.3
3 Stomach 2.5±0.3α 11.6±2.3
3 Intestine 0.04 1180.0
Values are means ± S.E.M. (N = no. of animals). αSignificantly different from dog (ANOVA, P<0.05); δsignificantly different from rat (ANOVA, P<0.05). Values with noS.E.M. were not included in the analysis and are presented for comparison.
VV
(mt) (%)
0 5 10 15 20 25 30
α,δ
α
δ
Harbor seal Dog Rat
Intestine Stomach
Kidney Liver
Heart
Fig.·7. Mean mitochondrial volume density [VV(mt)] for heart, liver, kidney, stomach and intestine of the harbor seal, dog and rat. Values are means ± S.E.M. All quantities expressed per tissue volume.
αSignificantly different from dog (ANOVA, P<0.05); δsignificantly
different from rat (ANOVA, P<0.05); ωsignificantly different from seal (ANOVA, P<0.05).
Fig.·8. Mitochondrial volume densities [VV(mt)] scaled to tissue-specific resting metabolic rate (RMR) for rats, dogs and harbor seals.
αSignificantly different from dog (ANOVA, P<0.05); δsignificantly
different from rat (ANOVA, P<0.05); ωsignificantly different from seal (ANOVA, P<0.05).
0 0.1 0.2 0.3 0.4 0.5
Rat Dog
δ δ α
δ
VV
(m
t)/
R
M
R
α,δ Harbor seal
Intestine Stomach
Kidney Liver
Heart
α,δ
[image:8.612.41.291.120.328.2] [image:8.612.318.556.341.504.2]was significantly greater than in the harbor seal and the dog (6.0·IU·g–1·wet mass tissue, 3.4·IU·g–1·wet mass tissue and
2.4·IU·g–1·wet mass tissue, respectively). HOAD activities in
the kidney and stomach of the three species were not statistically different. Analysis of the HOAD/RMR showed that: (1) harbor seal heart was significantly greater than dog and rat heart (4.2×10⁻², 1.3×10⁻²and 6.8×10⁻³, respectively);
(2) harbor seal liver was significantly greater than dog or rat liver (1.1×10⁻², 1.3×10⁻³and 2.0×10⁻³, respectively); and (3)
the harbor seal intestine was significantly greater than the
dog intestine (5.1×10⁻² and 2.8×10⁻², respectively; Table·5;
Fig.·10). There were no significant differences in the HOAD/RMR activities in the kidney or stomach among the three species.
Mean LDH activity in rat heart was significantly greater than in both the harbor seal and dog (1.3×10³·IU·g–1·wet mass
tissue, 6.9×10²·IU·g–1·wet mass tissue and 5.4×10²·IU·g–1·wet
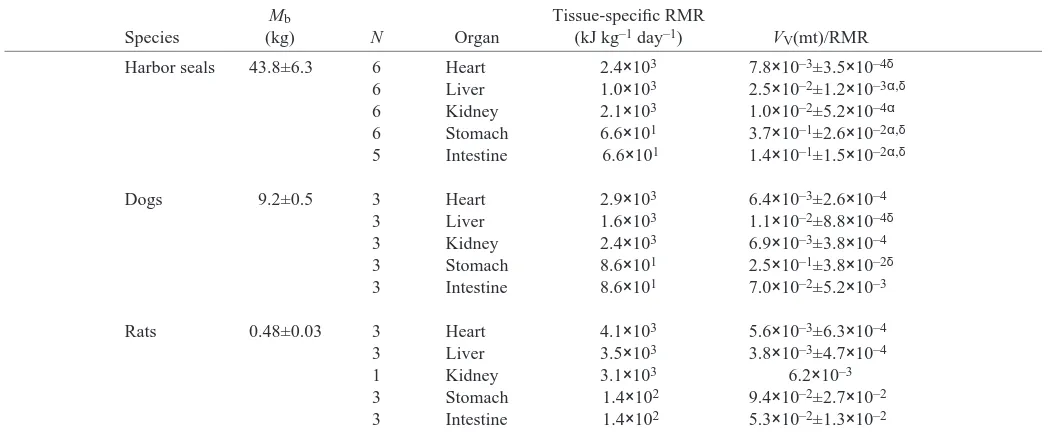
[image:9.612.47.572.98.316.2]mass tissue, respectively), but seal heart LDH activity was significantly greater than in the dog (Table·2). The liver of Table 4. Mitochondrial volume densities VV(mt) for heart, liver, kidney, stomach and intestine scaled to tissue-specific resting
metabolic rate (RMR) for harbor seals, dogs and rats
Mb Tissue-specific RMR
Species (kg) N Organ (kJ·kg–1·day–1) VV(mt)/RMR
Harbor seals 43.8±6.3 6 Heart 2.4×10³ 7.8×10⁻³±3.5×10⁻⁴δ
6 Liver 1.0×10³ 2.5×10⁻²±1.2×10⁻³α,δ
6 Kidney 2.1×10³ 1.0×10⁻²±5.2×10⁻⁴α
6 Stomach 6.6×101 3.7×10⁻¹±2.6×10⁻²α,δ 5 Intestine 6.6×101 1.4×10⁻¹±1.5×10⁻²α,δ
Dogs 9.2±0.5 3 Heart 2.9×10³ 6.4×10⁻³±2.6×10⁻⁴
3 Liver 1.6×10³ 1.1×10⁻²±8.8×10⁻⁴δ
3 Kidney 2.4×10³ 6.9×10⁻³±3.8×10⁻⁴
3 Stomach 8.6×101 2.5×10⁻¹±3.8×10⁻²δ
3 Intestine 8.6×101 7.0×10⁻²±5.2×10⁻³
Rats 0.48±0.03 3 Heart 4.1×10³ 5.6×10⁻³±6.3×10⁻⁴
3 Liver 3.5×10³ 3.8×10⁻³±4.7×10⁻⁴
1 Kidney 3.1×10³ 6.2×10⁻³
3 Stomach 1.4×10² 9.4×10⁻²±2.7×10⁻²
3 Intestine 1.4×10² 5.3×10⁻²±1.3×10⁻²
Values are means ±S.E.M. (N = no. of animals). Mb, body mass. VV(mt), volume density of total mitochondria; all quantities expressed per tissue volume. αSignificantly different from dog (ANOVA, P<0.05); δsignificantly different from rat (ANOVA, P<0.05). Values with noS.E.M. were not included in the analysis and are presented for comparison.
Fig.·9. Citrate synthase (CS) activity scaled to tissue-specific resting metabolic rate (RMR) for rats, dogs and harbor seals. αSignificantly different from dog (ANOVA, P<0.05); δsignificantly different from rat (ANOVA, P<0.05); ωsignificantly different from seal (ANOVA, P<0.05).
Rat Dog
ω
0 0.1 0.2 0.25 0.3 0.35
CS/
R
M
R
α,δ Harbor seal
Stomach Kidney
Liver Heart
0.15
0.05
Rat Dog
α
0 0.06 0.1 0.12 0.14 0.16
HOA
D
/R
M
R
α,δ Harbor seal
Stomach Kidney
Liver Heart 0.08
0.04
0.02
Intestine
α,δ
Fig.·10. β-Hydroxyacyl-CoA dehydrogenase (HOAD) activity scaled to tissue-specific resting metabolic rate (RMR) for rats, dogs and harbor seals. αSignificantly different from dog (ANOVA, P<0.05);
δsignificantly different from rat (ANOVA, P<0.05); ωsignificantly
[image:9.612.59.292.380.541.2] [image:9.612.328.561.382.539.2]harbor seals had a significantly higher LDH activity when compared with that in dogs and rats (1.1×10³·IU·g–1·wet mass
tissue, 3.1×10²·IU·g–1·wet mass tissue and 8.1×10²·IU·g–1·wet
mass tissue, respectively), and LDH in the rat liver was also significantly greater than in the dog. Dog kidney LDH activity was significantly greater than that in seal kidney (2.1×10²·IU·g–1·wet mass tissue and 1.9×10²·IU·g–1·wet mass
tissue, respectively). The LDH activity of the small intestine of both the harbor seal and the rat were significantly greater than in the dog (2.5×10²·IU·g–1·wet mass tissue,
2.7×10²·IU·g–1·wet mass tissue and 1.3×10²·IU·g–1·wet mass
tissue, respectively). The stomach was statistically indistinguishable among species. The LDH/RMR ratio showed that: (1) harbor seal heart was significantly greater than dog heart (2.9×10⁻¹ and 1.9×10⁻¹, respectively); (2) harbor seal
liver was significantly greater than dog and rat liver (1.1, 2.0×10⁻¹ and 2.3×10⁻¹, respectively); (3) harbor seal kidney
was significantly greater than dog kidney (8.8×10⁻² and
8.6×10⁻², respectively); (4) harbor seal stomach was
significantly greater than rat stomach (2.4 and 1.2, respectively); and (5) harbor seal intestine was significantly greater than dog or rat intestine (3.8, 1.6 and 1.9, respectively; Table·5, Fig.·11).
The CS/HOAD ratio ranged between 0.04 in the rat intestine and 5.2 in the dog stomach (Table·3). The most extreme difference in this ratio among species occurred in the heart. At the low end of the spectrum, the harbor seal heart had a ratio of 0.7, whereas at the high end the rat heart had a ratio of 4.5, a 6-fold difference. The CS/HOAD ratio of the harbor seal heart was significantly less than that of the dog or rat, and that
of the dog was significantly less than that of the rat. The CS/HOAD ratio in the liver was significantly different between the dog and harbor seal, with ratios of 4.1 and 1.2, respectively. The CS/HOAD ratio in the harbor seal liver was significantly less than that in the dog or rat, and that in the rat was less than that in the dog. The CS/HOAD ratio of the harbor seal kidney was significantly less than that in the dog (6.0×10⁻³ and 0.1,
respectively). Ratios for the stomach were significantly different between the dog and harbor seal (5.2 and 2.6, respectively). CS/HOAD ratios for intestine were similar
Fig.·11. Lactate dehydrogenase (LDH) activity scaled to tissue-specific metabolic rate (RMR) for rats, dogs and harbor seals.
αSignificantly different from dog (ANOVA, P<0.05); δsignificantly
[image:10.612.48.560.100.316.2]different from rat (ANOVA, P<0.05); ωsignificantly different from seal (ANOVA, P<0.05).
Table 5. Citrate synthase (CS), β-hydroxyacyl-CoA dehydrogenase (HOAD) and lactate dehydrogenase (LDH) activities scaled to tissue-specific resting metabolic rate (RMR) for harbor seals, dogs and rats
Mass
Species (kg) N Organ CS/RMR HOAD/RMR LDH/RMR
Harbor seals 46.1±4.3 10 Heart 3.1×10⁻²±2.3×10⁻³ 4.2×10⁻²±1.7×10⁻³α,δ 2.9×10⁻¹±9.8×10⁻³α 8 Liver 1.3×10⁻²±4.9×10⁻⁴α,δ 1.1×10⁻²±6.1×10⁻⁴α,δ 1.1±6.6×10⁻²α,δ 10 Kidney 7.2×10⁻³±1.7×10⁻⁴ 1.1×10⁻¹±2.1×10⁻² 8.8×10⁻²±2.7×10⁻³α 10 Stomach 1.7×10⁻¹±2.8×10⁻² 6.6×10⁻²±1.0×10⁻² 2.4±2.3×10⁻¹δ 9 Intestine 2.4×10⁻³ 5.1×10⁻²±4.6×10⁻³α 3.8±1.9×10⁻¹α,δ
Dogs 9.2±0.5 3 Heart 2.5×10⁻²±8.9×10⁻⁴ 1.3×10⁻²±2.6×10⁻³ 1.9×10⁻¹±1.6×10⁻² 3 Liver 5.2×10⁻³±2.4×10⁻⁴ 1.3×10⁻³±9.0×10⁻⁵ 2.0×10⁻¹±1.2×10⁻² 3 Kidney 8.8×10⁻³±2.6×10⁻⁴ω 7.0×10⁻²±2.7×10⁻² 8.6×10⁻²±8.4×10⁻³ 3 Stomach 2.5×10⁻¹±5.1×10⁻² 4.8×10⁻²±9.7×10⁻³ 2.4±2.0×10⁻¹ 3 Intestine 1.6×10⁻³ 2.8×10⁻²±2.5×10⁻³ 1.6±5.0×10⁻³
Rats 0.48±0.03 3 Heart 3.1×10⁻²±2.1×10⁻³ 6.8×10⁻³±2.8×10⁻⁴ 3.3×10⁻¹±1.8×10⁻²α 3 Liver 3.5×10⁻³±1.7×10⁻⁴ 2.0×10⁻³±1.3×10⁻⁴ 2.3×10⁻¹±5.9×10⁻³
1 Kidney 6.2×10⁻³ 4.7×10⁻² 3.3×10⁻²
3 Stomach 1.2×10⁻¹±3.5×10⁻² 4.8×10⁻²±1.0×10⁻² 1.2±7.4×10⁻² 3 Intestine 1.6×10⁻³ 4.2×10⁻²±5.2×10⁻³ 1.9±2.1×10⁻²
Values are means ±S.E.M. (N = no. of animals). αSignificantly different from dog (ANOVA, P<0.05); δsignificantly different from rat (ANOVA, P<0.05); ωsignificantly different from harbor seal (ANOVA, P<0.05). Values with noS.E.M. were not included in the analysis and are presented for comparison. RMR for specific tissues was calculated as in Table·4.
0 1.0 2.0 3.0 4.0 5.0
Rat Dog
α δ
L
D
H/
R
M
R
α,δ Harbor seal
Stomach Kidney
Liver
Heart Intestine
α,δ
[image:10.612.310.540.385.543.2]among species (5.0×10⁻², 6.0×10⁻² and 4.0×10⁻² for harbor
seal, dog and rat, respectively) but were not analyzed statistically due to the small sample size.
The LDH/CS ratio ranged between 5.3 in the rat kidney and 1583.1 in the harbor seal intestine. The LDH/CS ratios of the harbor seal liver and kidney (80.5 and 12.2, respectively) were significantly greater than those in the dog (38.3 and 9.8, respectively) (Table·3). The LDH/CS ratio in the rat liver was also significantly greater than that in the dog (66.3 and 38.3, respectively). There were no differences among species in the LDH/CS ratio of the heart or stomach. The LDH/CS ratio of the intestine was not included in the statistical analysis.
Discussion
Studies of adaptations in mammals to hypoxia have fallen into two main categories: (1) exposure to hypoxia (for periods ranging from 1·day to 9·months) and (2) high-altitude-adapted mammals. For the first category of studies, research has shown that there is either no change or a decrease in aerobic indicators of the heart and liver (Kayar and Banchero, 1987; Costa et al., 1988; Lewis et al., 1999; Kennedy et al., 2001). For studies of the second type, CS (Hochachka et al., 1982) and LDH activities of the heart were increased (Vergnes, 1971; Penney, 1974; Barrie and Harris, 1976; Ohtsuka and Gilbert, 1995). Our studies suggest that the heart and splanchnic organs of harbor seals exhibit adaptations (i.e. dual adaptations for aerobic metabolism under hypoxic conditions, but the increased ability to use anaerobic energy production) similar to those of high-altitude-adapted mammals rather than hypoxia-exposed mammals. The liver (Davis et al., 1983; Castellini et al., 1988), kidneys (Davis et al., 1983; Castellini et al., 1981) and gastrointestinal tract (Davis et al., 1983) all maintain aerobic metabolic function during natural diving. A model for convective oxygen transport and tissue oxygen consumption in Weddell seals during aerobic dives indicates that convective oxygen transport to the heart, liver, kidneys and gastrointestinal tract is sufficient to maintain aerobic metabolism despite a falling PaO∑ to as low as 2.9×10²·Pa
during an aerobic dive (Davis and Kanatous, 1999). Harbor seal inter-organ comparisons
The function of the heart, liver, kidneys and digestive organs of mammals relies on the delivery of oxygen from the circulation. The estimated mass-specific RMR of harbor seal organs (taken from Weddell seal estimates; Davis and Kanatous, 1999) is, in descending order, heart (59.2·ml·O2·min–1·kg–1), kidneys (38.4·ml·O2·min–1·kg–1),
liver (27.7·ml·O2·min–1·kg–1) and gastrointestinal tract
(10.1·ml·O2·min–1·kg–1). When blood flow is reduced, these
organs increase their extraction of oxygen from the blood (Fisher, 1963; Jacobsen et al., 1969; Granger and Shepherd, 1973; Lutz et al., 1975; Nelson et al., 1988; Fink, 2001) or, in the case of the kidneys, decrease their metabolic rate because glomerular filtration rate (GFR) is reduced (Brezis et al., 1984). If convective oxygen transport is insufficient to maintain
aerobic metabolism, the tissue will become anoxic, and cellular damage or death can result (Brezis et al., 1984). Although the seal heart had the highest RMR among the organs, it did not have the highest VV(mt). However, CS activity in the seal heart
was 4.8–6.5×greater than that in the liver, kidney and stomach, indicating a higher density of citric acid cycle enzymes in heart mitochondria. This, combined with an elevated HOAD activity and a CS/HOAD ratio of 0.7, shows the high aerobic capacity of the heart and its ability to oxidize fatty acids.
Among the organs of the harbor seal, the liver had the highest VV(mt) followed by the stomach and kidneys. The
HOAD activity of the seal kidney was significantly greater than that of all other organs, reinforcing the reliance on lipid metabolism. The intestine had the lowest VV(mt), which may
reflect the overall low RMR of the gastrointestinal tract. The LDH activity of the liver was the highest among the seal’s organs, reflecting its capacity to switch on anaerobic ATP production if necessary. However, the high LDH activity may also indicate an enhanced ability to convert lactate into pyruvate as the initial step in gluconeogenesis. Previous studies (Davis et al., 1983) have shown that most of the lactate produced when harbor seals are forcibly submerged or exercising is not oxidized but recycled, most likely back into glucose in the liver. We believe that seals rely primarily on aerobic metabolism during diving. In rare instances, there is a survival advantage for the seals to produce ATP anaerobically, resulting in a large lactate load in tissues and blood. The conversion of this lactate back to pyruvate requires LDH, but the process also requires the presence of adequate oxygen and a high percentage of heart (H)-type LDH subunits in the tissue (Castellini et al., 1981). We would therefore argue that an elevated LDH has a greater significance for the rapid conversion of pyruvate to lactate (and the production of ATP) than the reverse. Nevertheless, an elevated LDH will facilitate the removal of lactate after it is produced.
Interspecies comparison of the heart
We found that the unscaled VV(mt) of harbor seal heart was
not significantly different from that of the dog and rat, but the VV(mt)/RMR was greater (1.4×) than that in the rat. These
results indicate a small increase in the VV(mt) in the seal heart
relative to its metabolic requirements. We hypothesize that this increase in VV(mt)/RMR aids in the maintenance of aerobic
metabolism during diving by decreasing the diffusion distance between mitochondria and intracellular oxygen. We base this hypothesis on the rate of diffusion within a muscle fiber described by Fick’s equation:
dQ/dt = –DA(du/dx)·,
advantageous at low partial pressures (i.e. du is small) of oxygen experienced during diving.
The unscaled CS activity in the harbor seal heart was significantly less than in the rat heart. However, when CS activity was scaled to RMR, there were no significant differences among the three species, indicating that the high RMR of the rat accounts for the high CS activity. As a result, overall aerobic capacity of harbor seal heart muscle is not elevated compared with that of the rat and dog when scaled to cardiac muscle RMR. However, there is an increase in VV(mt)
that may enhance the diffusion of intracellular oxygen into mitochondria under hypoxic conditions.
Based on a mean postabsorptive respiratory quotient (ratio of CO2production/O2consumption) of 0.74 in seals, previous
studies (Kooyman et al., 1981; Davis et al., 1991) showed that seals rely heavily on lipid as a fuel for energy metabolism, especially during exercise. Even without scaling for RMR, HOAD activity in the harbor seal heart was significantly greater (2.6×and 3.6×) than in the dog and rat, respectively. When scaled to RMR, the HOAD activity in the seal heart was 3.2×and 6.2×greater than that in the dog and rat, respectively, indicating that seal heart relies heavily on lipid as a source of energy. This was further supported by a CS/HOAD ratio of 0.7 in the seal, while the ratio in the dog and rat were 1.9 and 4.5, respectively. This dependence on lipid as an energy source in seals results from a diet rich in fatty acids and protein but containing little carbohydrate (Roberts et al., 1943; Balazquez et al., 1971; Kettelhut et al., 1980; Davis et al., 1991). Studies of terrestrial mammals have shown that high-fat, low carbohydrate diets increase the rate of lipid oxidation (Roberts et al., 1996; Lee et al., 2001) and that this is accompanied by an increase in the concentration of enzymes required for fatty acid oxidation (Gollnick and Saltin, 1988; Roberts et al., 1996). A greater reliance on fatty acid oxidation also spares carbohydrate for red blood cells and the central nervous system, which are obligate glucose metabolizers.
Castellini et al. (1981) found that LDH activity in the hearts of marine and terrestrial mammals was not significantly different. By contrast, we observed a small, but significant, increase in LDH activity (1.3×) of the seal heart over that of the dog. This difference was further enhanced (1.5×) when LDH activity was scaled to RMR. Castellini et al. (1981) found that the mean LDH activity for the marine mammals was not significantly different from that of terrestrial mammals, although some marine mammals had elevated LDH activities relative to others. This may account for the difference in the results between Castellini et al. (1981) and our study, given that our LDH values for harbor seals were not greatly elevated compared with those of the dog and not at all compared with those of the rat. Since the heart is critical for survival, enhanced LDH activity may have survival advantage, even if the heart normally remains aerobic during dives. Ohtsuka and Gilbert (1995) studied the effects of high-altitude hypoxemia on cardiac enzyme activities in pregnant and non-pregnant sheep. The results showed that LDH activity increased by 24% and 27%, respectively, in the left ventricle of non-pregnant and
pregnant adult sheep. Similar results for animals exposed to high altitudes (hypoxia) have been reported by Vergnes (1971), Penney (1974) and Barrie and Harris (1976). Seal cardiac muscle shows adaptations for both aerobic and anaerobic metabolism under conditions of hypoxia. Oxygen will be used until a critical PaO∑ is reached during a dive. At that point,
anaerobic metabolism will become increasingly important as a source of ATP. In Weddell seals, this critical PaO∑is less than
2.9×10²·Pa, and it appears that the seals rarely exceed this
threshold during aerobic dives (Qvist et al., 1986; Davis and Kanatous, 1999). As a result, convective oxygen transport to the heart is normally sufficient to maintain aerobic metabolism during a dive. Nevertheless, enhanced anaerobic glycolytic enzyme activity is present if needed to protect the heart against hypoxia.
Interspecies comparison of the liver
Seal liver VV(mt) was significantly greater (2× and 1.5×)
than rat and dog liver, respectively. When scaled for RMR, seal liver VV(mt) was even greater (6.6×and 2.3×) than in rat and
dog liver, respectively. As with the seal heart, we hypothesize that this increase in VV(mt) decreases the intracellular distance
for oxygen diffusion and effectively increases diffusive conductance to maintain aerobic metabolism and organ function during periods of hypoxia while diving (Costa et al., 1988). Based on the hepatic clearance of indocyanine green (ICG) from the blood during voluntary dives, Davis et al. (1983) showed that hepatic function was maintained in subadult Weddell seals during voluntary dives, even though hepatic arterial and portal blood flow were reduced as a result of the dive response. The liver appears to compensate for a reduction in blood flow during a dive by increasing the extraction coefficient of ICG (Fisher, 1963; Jacobsen et al., 1969), thereby maintaining a pre-dive level of ICG clearance. Plevris et al. (1999) observed that reduced ICG clearance in laboratory animals is due mainly to impaired microcirculation in the liver and compromised hepatocyte function. Since ICG clearance in the seal is maintained during aerobic dives, there is no impairment of hepatic microcirculation or function. This conclusion is further supported by data that show little variation in the blood glucose concentration and blood urea nitrogen (BUN) during consecutive, aerobic dives (Castellini et al., 1988; R. W. Davis, unpublished results), which would not be possible if liver function were disrupted.
Costa et al. (1988) showed that the livers of rats exposed to chronic, hypobaric hypoxia had a more homogeneous distribution of mitochondria than rats raised under normoxic conditions. In our analysis of hepatic mitochondrial distribution, 88% of micrographs from the seal were classified as homogeneous, whereas only 9% of dog and 5% of rat liver micrographs were classified as homogeneous. Along with an elevated VV(mt), we hypothesize that the homogeneous
distribution of hepatic mitochondria decreases the intracellular diffusion distance for oxygen and helps maintain aerobic metabolism under hypoxic conditions.
than that in the dog. Since CS is an enzyme found in the matrix of the mitochondria, it follows that an increase in VV(mt)
would result in an increase in CS activity. HOAD activity in the seal liver was 5.6×and 1.6×greater than in the dog and rat, respectively, and 8.5× and 5.5× greater, respectively, when scaled to RMR. The increased HOAD activity in the harbor seal probably results from the high-fat, low-carbohydrate diet discussed previously. These results are similar to those for skeletal muscle for harbor seals, Steller’s sea lions (Eumetopias jubatus) and northern fur seals (Callorhinus ursinus) (Kanatous et al., 1999). Kennedy et al. (2001) found that HOAD activity in the liver of rats decreases after exposure to chronic hypoxia at high altitude, but HOAD activity and glycogen sparing have not been studied widely in the liver. Although the CS/HOAD ratio in the liver is not as low as in heart, kidneys and intestine, it indicates that lipid is an important source of fuel for energy metabolism in the liver.
Castellini et al. (1981) found that LDH activity (in the direction of pyruvate to lactate) in marine mammal liver was higher than in terrestrial mammals. Our data are in agreement, with harbor seals having a statistically greater LDH activity than either the dog or rat regardless of scaling for RMR. However, our mean LDH activity was double that reported by Castellini et al. (1981) for marine mammals, with values of 1084.5±66.5·IU·g–1·wet·mass·tissue and 538±188·IU·g–1·wet
mass·tissue, respectively. However, as noted by Castellini et al. (1981), some of the terrestrial mammals had high LDH activities and some marine mammals had low LDH activities. The LDH/CS ratio of the harbor seal liver is greater than that of the dog, indicating a relatively high anaerobic capacity. Therefore, our results show a heightened ability for anaerobic metabolism in the liver of the harbor seal. Although we did not measure LDH activity in the lactate to pyruvate direction, this aerobic process may be important in the liver for recycling lactate back into glucose through gluconeogenesis. As with the heart, the seal liver shows adaptations for both aerobic and anaerobic metabolism under conditions of hypoxia. Although Davis and Kanatous (1999) showed that the liver in Weddell seals receives sufficient oxygen to prevent anaerobic ATP production during dives within the ADL, this source of energy may be important during longer dives.
Interspecies comparison of the kidney
Studies in which seals were forcibly submerged led researchers to believe that there was a pronounced decrease in blood flow to the kidneys during diving resulting from an extreme dive response (Blix et al., 1976). Bradley and Bing (1942) and Murdaugh et al. (1961) came to the same conclusion when seals that were forcibly submerged experienced either a decrease or complete cessation in GFR. However, a study by Davis et al. (1983) of Weddell seals making voluntary dives came to a different conclusion. By injecting inulin into the blood of the seals, they were able to measure the seal’s GFR during and after dives. They found that inulin clearance did not change from pre-dive, resting levels and only decreased when the seals dived for longer than their
ADL. They concluded that the kidneys functioned normally during dives shorter than the ADL due to sustained renal blood flow and glomerular filtration.
Mammalian kidneys, regardless of species, require an abundance of mitochondria to provide ATP for active transport of electrolytes and metabolites across the renal tubules. Since mitochondria are the source of ATP production, they are present in the kidneys where the sodium pump enzymes reside (Abrahams et al., 1991). The harbor seal kidney had a VV(mt)
that was significantly greater (29%) than that of the dog. We hypothesize that this elevation in VV(mt) is an adaptation to
sustain aerobic metabolism and renal function during the hypoxia experienced during diving. When blood flow to the kidneys of a terrestrial mammal decreases, it concomitantly reduces its metabolic rate since the kidney’s workload is directly proportional to the amount of plasma that must be filtered (Brezis et al., 1984). However, at very low renal blood flow, the metabolic rate of the kidneys is reduced to basal levels because there is little filtration and absorption (Lassen, 1964). The kidneys can suffer damage if there is a further decrease in blood flow (Brezis et al., 1984), although the seal kidney appears to recover from severe anoxia better than the dog kidney (Halasz et al., 1974). The elevated VV(mt) in the
harbor seal kidney may aid in decreasing the intracellular diffusion distance of oxygen and thereby keeping renal metabolism aerobic and functioning normally.
Mitochondrial distribution in the harbor seal and dog kidneys was nearly identical. Unlike the liver, it appears that the harbor seal kidney needs no redistribution of mitochondria to facilitate the intracellular diffusion of oxygen. The increased volume density of the mitochondria may be enough to increase the effective oxygen diffusive conductance, or the intrinsic grouping of mitochondria in the mammalian kidney may be equally divided between a homogeneous and clustered distribution.
The CS activity in the dog kidney was significantly greater (1.4×) than in the seal, even though the VV(mt) in the seal was
greater (1.3×) than in the dog. This result indicates a greater concentration (packing) of CS in the dog mitochondria. Kanatous et al. (1999) obtained similar results for an increase in CS activity in the mitochondria of pinniped skeletal muscle. However, when scaled for RMR, there were no statistical differences in the CS activity of harbor seal and dog kidneys. The enzymatic design of the mammalian kidney for oxidative metabolism may depend solely on body mass. HOAD activity in both the seal and dog kidneys was at least twice as great as any other organ examined (the rat showed a similar trend) but was not significantly different between the two species regardless of scaling. As a result, the CS/HOAD ratio for the harbor seal, dog and rat kidneys was very low (~0.1), indicating that the mammalian kidney has an elevated enzymatic potential for aerobic lipid metabolism.
enhanced LDH activity may confer a survival advantage, even though the kidneys remain aerobic during most voluntary dives. Again, when a dive exceeding an animal’s ADL is required, there is additional LDH activity available for the glycolytic production of ATP. This ability was observed by Halasz et al. (1974), which explains the ability of the seal kidney to recover from severe bouts of hypoxia that would be rare in the wild.
Interspecies comparison of the gastrointestinal tract The VV(mt) in the stomach of the harbor seal was
significantly greater (1.8×) than in the rat and, when scaled for RMR, it was greater (3.9×and 1.5×, respectively) than in both the rat and the dog. When scaled for RMR, the VV(mt) of the
harbor seal small intestine was also significantly greater (2.6× and 2×, respectively) than that of the rat and dog. We hypothesize that the increase in VV(mt) in the stomach and
small intestine of the harbor seal is an adaptation for maintaining aerobic metabolism and gastrointestinal function during hypoxia. This is supported by the observations of Davis et al. (1983), who found that the plasma of Weddell seals making foraging dives became very lipemic and opaque from the presence of chylomicrons. The lipemic plasma was an indication that the digestion and intestinal absorption of fat [Weddell seals usually feed on Antarctic silverfish (Pleuragramma antarcticum), which have a very high lipid content] was taking place during a bout of consecutive foraging dives.
Previous research has shown that the gastrointestinal organs are capable of compensating for alterations in blood flow by adjusting the amount of oxygen extracted from the blood (Granger and Shepherd, 1973). The oxygenation of the tissue is regulated by the balance between blood flow and oxygen extraction (Johnson, 1960; Garg, 1979; Granger and Norris, 1980). Kvietys and Granger (1982) also found that at normal intestinal blood flows, the uptake of oxygen appears to be blood flow independent, whereas at very low perfusion, oxygen uptake becomes flow dependent. An increased VV(mt) would
support the efficient extraction (by increasing the diffusive conductance) of oxygen needed to support aerobic metabolism and normal function during a dive.
Analysis of the distribution of mitochondria in the stomach revealed that approximately 91.3% of harbor seal micrographs and 76% and 69% of dog and rat micrographs, respectively, were classified as homogenously distributed. As in the liver, the more homogeneous distribution of mitochondria in the mucosal surface of the stomach may aid in decreasing the effective diffusion distance of oxygen in the stomach lining.
The CS activities in the stomachs of the three species were not significantly different and, although intestinal CS activity was not included in the analyses, the single values obtained for each species were very similar. Mean HOAD activity in the stomach of the harbor seal was not significantly different from that of rat or dog. However, the HOAD/RMR of the seal intestine was significantly greater than that of the dog. The
CS/HOAD ratio for the harbor seal intestine (and the rat and dog) was very low (<0.1), indicating a high enzymatic potential for aerobic lipid metabolism. The CS/HOAD ratio of the harbor seal stomach (5.2) was higher than that of the intestine.
The LDH activity in the stomach of the harbor seal was not significantly different from that of the dog or rat. However, when scaled for RMR, LDH activity in the seal stomach was significantly greater than in the rat. When scaled for RMR, LDH activity in the small intestine of the harbor seal was significantly greater than that in the dog and rat. The higher LDH activity in the harbor seal digestive organs indicates a heightened ability to undergo anaerobic metabolism during a dive if necessary. However, given that most dives are within an animal’s ADL, and the LDH/CS ratio is not significantly different from that of the dog or rat, we believe that the animal may only rely on this anaerobic production of ATP when undertaking a dive beyond its ADL.
Conclusions
The elevated VV(mt)/RMR, especially in the liver of the
harbor seal, indicates adaptations to sustain aerobic metabolism during hypoxia by enhancing the diffusion of oxygen to mitochondria at low partial pressures. The elevated CS/RMR of the harbor seal liver is indicative of its high aerobic capacity and poise for aerobic metabolism. The high HOAD activity and low CS/HOAD ratio, along with a respiratory quotient that is normally less than 0.74, indicate that lipids are the primary substrate for aerobic metabolism. A heightened LDH activity indicates an adaptation for the anaerobic production of ATP on dives that exceed animal’s ADL. Hence, the heart, liver, kidneys and gastrointestinal organs of harbor seals exhibit dual adaptations that promote an aerobic, lipid-based metabolism under hypoxic conditions but can provide ATP anaerobically if required.
We thank the Alaska Native Harbor Seal Commission for assistance in obtaining tissue samples. We also wish to thank the IACUC at Texas A&M University. Technical assistance with electron microscopy was provided by J. Wen and V. Han. Statistical assistance was provided by C. Ribic, S. Khan and J. Grady. We gratefully acknowledge the field assistance of F. Weltz. The research described in this paper was supported by the Exxon Valdez Oil Spill Trustee Council. However, the findings and conclusions presented by the authors are their own and do not necessarily reflect the views or position of the Trustee Council. This study was conducted under Marine Mammal Permit No. 1021 issued to Randall W. Davis.
References
Abrahams, S., Greenwald, L. and Stetson, D. L. (1991). Contribution of
renal medullary mitochondrial density to urinary concentrating ability in mammals. Am. J. Physiol. 261, R719-R726.
Balazquez, E., Castro, M. and Herrera, E. (1971). Effect of high-fat diet on
pancreatic insulin release, glucose tolerance and hepatic gluconeogenesis in male rats. Rev. Espan. Fisol. 27, 297-304.
![Table 1. Mean body mass, percent organ mass and mitochondrial volume density [VV(mt)] for heart, liver, kidney, stomach andintestine in the harbor seal, dog and rat](https://thumb-us.123doks.com/thumbv2/123dok_us/1131124.633251/7.612.56.566.413.631/table-percent-mitochondrial-volume-density-kidney-stomach-andintestine.webp)