Munich Personal RePEc Archive
South-South Trade: A Quantitative
Assessment
Raihan, Selim
SANEM
27 May 2014
Online at
https://mpra.ub.uni-muenchen.de/57776/
Page
1
of
115
[This version: 27 May 2014]
South-South Trade: A Quantitative Assessment
Selim Raihan
1
1
Dr. Selim Raihan is Professor, Department of Economics, University of Dhaka, Bangladesh and Executive
Page
2
of
115
Executive Summary
The share of North-North trade in global trade declined from 55.5 percent in 1990 to around 32
percent in 2010. Such fall in North-North trade had been accompanied by rising trade involving the
South countries. The South-North trade share increased from 13.9 percent to 16.5 percent during
the same time. However, the most spectacular phenomenon was the rise in South-South trade,
which increased from only 6.4 percent to 19.4 percent during this period.
Such rise in South-South trade has not been uniform across different South countries. During 1990
and 2010, though all categories of South countries (all South, LDCs, SVEs, advanced South and South
excluding advanced South) experienced rises in their shares in global trade, trade involving the
advanced South countries was the major contributor to the changing landscape in global trade,
which resulted in remarkable rise in the South-South trade.
When it comes to country-wise shares in South-South export, there are some gainers and losers. Out
of the 135 South countries, 50 countries experienced rise in their shares in South-South export while
85 countries experienced fall in shares.
The structures of the export of the South countries are not uniform. Many of the South countries’
export are agriculture based, many of them are extraction based and the rest are manufacturing
oriented. The destinations of the export from South countries are primarily the developed countries.
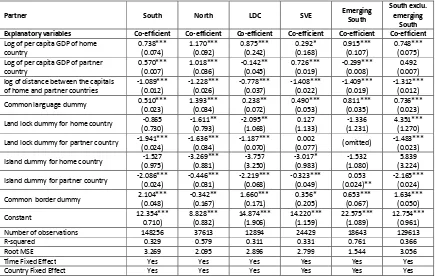
A comparison among the sizes of coefficients of different variables under the basic gravity models
suggests that as far as intra-South trade is concerned, among the continuous variables, the largest
positive effect stems from the per capita GDP of the home country, and largest negative effect
comes from the distance. Among the dummy variables, the common border dummy has the largest
positive effect, whereas the island dummy of the partner country has the largest negative effect.
However, these variables have differential effects when it comes to trade between different groups
of South countries.
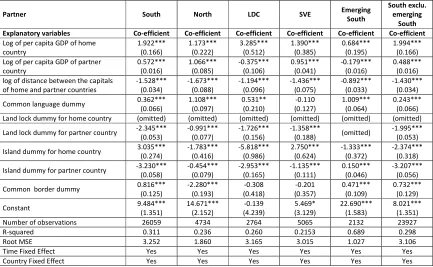
Gravity modeling results suggest that when considering South countries as the home, there are
marked differences among different groups of countries as far as the impact of per capita GDP of
home country (in this case the South countries) on exports from these groups of countries to the
South countries are concerned. Per capita GDP of the South countries has the largest positive effect
on the export from the North countries; and among different South countries such positive effect is
the largest for the export from the Emerging South countries. For SVEs the effect is positive but is
the smallest among all country groups. Now, while considering South as the source of export, the
per capita GDP of the emerging South countries has the largest positive effect among all country
groups on the export from South. Interesting, the per capita GDP of the North countries doesn’t
have any significant effect. Also, though the per capita GDP of LDCs has a positive effect on the
export from South that of the SVEs doesn’t have any statistically significant effect.
Page
3
of
115
countries; and distance factor has the largest negative impact on South’s export to Emerging South
among all country groups as destinations for South’s export. In the case of common language
dummy, while considering exports to South from all country groups, this dummy has the largest
positive effect on export from North countries, and while considering export from South, common
language has the largest positive effect on the export to South Excluding Emerging South countries.
In the case of land lock dummy for home country, considering South as the home, this dummy has
mixed effects on exports from different country groups; for example, it has negative impacts on
exports from LDCs and North, while it has a positive impact on export from South Excluding
Emerging South. Also, this dummy has only negative effect on the export from South to North
among all country groups as destinations for South’s export. In the case of land lock dummy for
partner country, when South is the home, among all country groups, this dummy has the largest
negative effect on the export from the South; however, when South is the export source, this
dummy has the largest negative effect on South’s export to Emerging South countries. In the case of
island dummy for home country, considering South as the home, the export from the island
countries will be reduced, if those countries are either North or SVEs. Also, South’s export to
Emerging South countries will be reduced most of the South countries are the island countries. In
the case of island dummy for partner country, considering South as the home, the export from LDCs
is mostly affected among exports from all country groups if LDCs are island countries. Also, if South
countries are island countries, then their export is mostly affected in the Emerging South countries.
When South is the export destination, common border dummy has the largest positive effect on the
export from South countries in general, and among different groups of South countries, this dummy
has the largest positive effect on the export from LDCs. However, this dummy has a negative effect
on the export from North to South.
Augmented gravity modeling results suggest that, in general, South’s tariff rate has the largest
negative effect on the export from SVEs. North’s tariff is most restrictive on the export from South in
general and South Excluding Emerging South in particular. LDCs’ tariff rate affects mostly the export
from SVEs and LDCs. SVEs’ tariff rate affects mostly the export from South Excluding Emerging South
counters. Tariff rates of Emerging South and South Excluding Emerging South have the largest
negative effect on export from SVEs. As far as South is considered as the export destination, trade
cost in South affect mostly the export from South. Trade cost in North has the largest negative effect
on export from LDCs, and it seems that such negative effect is higher than the negative effect on
export from North to LDCs due to trade cost in LDCs. While the trade costs between LDCs and
Emerging South countries are compared, trade costs in Emerging South countries seem to be more
restrictive on export from LDCs, as compared to the negative effect of trade cost in LDCs on the
export from Emerging South. Similar observations are hold for SVEs, while comparing the restrictive
effect of their trade cost with those of North and Emerging South.
Page
4
of
115
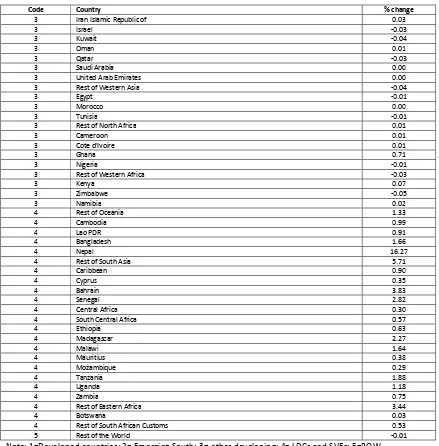
followed by Rest of South Asia. The lowest rise in export would be for Botswana. . All LDCs and SVEs
would experience some re-direction of their exports towards the Emerging South countries. Such as
scenario would not lead to large rise in export from LDCs and SVEs, which indicates to the fact that
tariff preferences in the Emerging South countries alone would not be enough to help LDCs and SVEs
to increase their export to the Emerging South countries. Such a scenario would lead to marginal
effects on the export from other developing countries, some countries would experience very small
rise and some counties would experience very small fall.
Page
5
of
115
I. INTRODUCTION
In recent times the world economy has witnessed an unprecedented growth of developing
countries with their share in global output doubling to almost 40 per cent over the last two
decades. While between 1990 and 2000 merchandise exports from developing countries
rose from about US$850 billion to US$ 2 trillion, the volume tripled further in the following
decade. Their combined share in global export trade reached close to 40 per cent from just
about 20 per cent in 1990.The trade between developing countries has expanded much
faster: the average annual growth of South-South trade over the past decade was 16 per
cent as against of world trade growth rate of just about 6 per cent. Although impressive
growth performance has characterized many developing countries, it is the rise of such
economies as Brazil, Russia, India, China and South Africa (known as BRICS nations) that has
widely been recognized as the defining feature of the emerging South, paving the way for a
world economy with an increasingly multi-polar character. With a combined GDP of US$8.7
trillion in 2010, the BRICS countries contributed 18 per cent of the world’s GDP and 15 per
cent of global trade, accounting for 30 per cent of global economic growth since 2000 (but
45 per cent since the beginning of the financial crisis). Moreover, according to available
projections, the group of largest seven emerging economies (China, India, Brazil, Russia,
Indonesia, Mexico and Turkey) is predicted to overtake the group of current G7 economies
(France, Germany, Italy, Japan, United Kingdom, United States, and Canada) by 2020 in
terms of gross domestic outputs measured in purchasing power parity exchange rates.
Page
6
of
115
trade and cooperation has been a longstanding development issue, never in the past it
could be more relevant and prominent than it is now.
The least developed countries (LDCs) and other Sub-Saharan African countries (SSA),
generally regarded as countries suffering from severe structural handicaps to growth with
weak human capital base, high economic vulnerability and weak integration with the global
economy, over the past decade have, on the whole, achieved encouraging economic
growth. Some of these countries’ trade with Southern partners also increased rapidly.
Nevertheless, sustainability of growth, lack of economic diversification, concentration of
export trade - particularly with emerging economies - in primary commodities, and a
majority of countries’ not being able to participate effectively in South-South trade and
investment flows, amongst others, remain important concerns about emerging-country led
trade and development prospects. A third group of countries − known as the small,
vulnerable economies (SVEs) − are also confronted with overriding developmental
problems, some of which are unique because of their small size, geographic location and
inherent characteristics, while others are comparable to those of LDCs. Like many LDCs, they
overwhelmingly rely on a few primary commodities for their exports, remaining susceptible
to significant fluctuations in the world prices of these products. SVEs as a group have
registered the lowest economic growth over the past decade and their marginalization (in
terms of declining relative significance) in global trade remains unabated.
The rapidly rising significance of a number of emerging economies in the backdrop of
economic slowdown in the advanced economies provides an opportune moment to have a
fresh look at the ongoing engagement between developing countries in trade and
development cooperation to situate development interests of LDCs, SVEs and SSA in a right
context. It is also timely as the collapse of the Doha Round of trade talks has been extremely
frustrating for development to be supported through multilateralism trade, as envisaged
when the Doha Development Agenda was launched more than 10 years ago in 2001, while
the rise of emerging countries offers an opportunity to secure a productive engagement
with them for the poorest and vulnerable countries.
Page
7
of
115
II. REVIEW OF LITERATURE
Coulibalya and Fontagné (2006) highlighted the importance of geography in south-south
trade. Examining the pattern of intra-sub-Saharan African trade, the authors argued that it
was not the size of the exporting and the importing economies, rather geography was the
main determinant of the ‘missing trade’ in that region. They argued that being landlocked
and poor, those sub-sharan African countries experienced high trade costs.
Greenaway and Milner (1990) critically evaluated the arguments in favor of a relative
expansion of South-South trade and reviewed the experience of developing countries with
discriminatory regional trading arrangements. The authors contended that the case for
specific policies to promote South-South trade was not convincing and that experience with
discriminatory arrangements was not encouraging. The authors argued that the expansion
of South-South trade could be expected to continue in the context of multilateral trade
expansion, and the potential gains would likely to be greater if this process were allowed to
evolve freely in a multilateral setting.
OECD (2006) argued that trade between developing countries (South-South trade) would
offer wide scope for specialization and efficiency gains. At present, barriers to South-South
trade are higher than hose governing South trade with other partners, and distance-related
costs are higher. Recent OECD research shows that the potential benefit from freer
South-South trade may indeed be at least as large as the gains that developing countries can
obtain from better access to rich countries’ markets (North-South trade). There is certainly
room for South-South trade to develop – it is estimated that exports from one developing
country to another account for just 6 percent of total world merchandise exports, while
South-South trade in services overall makes up just 10 percent of world total.
South-South merchandise trade has expanded considerably in the past20 years, albeit from
a very small base: it now makes up around 6 percent of world trade, compared with 3% in
1985. Over that period, South-South merchandise trade grew on average at the impressive
rate of 12.5 percent a year, compared with 7 percent for North-North trade and 9.8% for
North-South trade. But tariff barriers affecting South-South trade are still much higher than
those affecting other trade, at an average 11.1 percent compared with 4.3 percent for
North-North trade.
Page
8
of
115
total world trade; exchanges involving low income countries make up barely 1 percent of
total world trade. This situation is unlikely to change since growth in the value of exchanges
involving low income countries shows a significantly slower growth trend than for others.
There are also significant differences in the products involved in South-South merchandise
trade as compared to North-South and North-North trade. Broadly speaking, South-South
trade seems to be more concentrated on raw materials and less processed products than
either North-South or North-North trade, probably due to differences in factors affecting
both the demand and the supply sides.
Research at the OECD suggests that the recent growth in South-South goods trade has not
been brought about by the so-called “death of distance” – the large drop in the cost of
moving people, objects and ideas around the globe observed in the 1980s and 1990s. The
impact of distance-related trade costs has not noticeably diminished over the period and
such costs continue to have a much more negative effect on South-South than on
North-North trade. Whereas a 10 percent increase in distance between countries or regions tends
to reduce North-North trade by about 10 percent, the comparable figure for South-South
trade is 17 percent. In both cases, the figures estimated for 2002 were scarcely different
from those for 1985. However, given that the distances facing South-South trade are
broadly comparable (on average) to those facing North-North and North-South trade, there
is considerable scope for increasing South-South trade by reducing distance-related trade
costs to levels prevailing for other trade flows. It can also be demonstrated that the
importance of a common language for South-South trade increased markedly in the early
1990s (e.g. trade among French-speaking Africa), but remained approximately constant for
other trade f lows. Hence, ethno-cultural links may have been one factor in the observed
growth of South-South trade around that time.
Page
9
of
115
The observed geographical patterns of South-South trade imply that about half of the gains
from future South-South tariff liberalization would be realized by low and middle income
countries in Asia. Additionally, most of the gains from South-South liberalization in Asia
would be regional. In other words, countries would benefit most from liberalized trade with
their geographical neighbors. One prominent exception to this rule is China which is actually
estimated to gain more than twice as much from liberalization of trade with Latin American,
MENA and sub-Saharan countries than from liberalization with other Asian countries. The
picture is slightly different in Latin America and sub-Saharan Africa where regional gains
account for respectively 45 percent and 39 percent of gains from South-South trade –
almost all the remaining gains can be attributed to trade with low and middle income
countries in Asia.
It also appears, however, that only a part of the potential gains from South-South trade
could be realized through regional agreements, mainly in Asia. More generally, many low
and middle income countries benefit most from freer trade with similar countries in other
regions. This points to multilateral negotiations as an important vehicle for realizing the
gains from South-South goods trade.
According to UNCTAD (2011), one of the key features of the last decade or so has been the
rising importance of some developing economies in the global economy and the
intensification of South–South economic relationships. From the point of view of the LDCs,
the multi-faceted process of reconfiguration of the world economy has translated, most
notably, into a remarkable strengthening of their economic ties with Southern countries. As
a consequence, although traditional Northern partners remain crucial, South–South
relations now play an important and increasing role in LDCs’ integration into the world
economy. Further, they are likely to acquire an even greater prominence in the future, given
the significant downside risks that loom on the recovery in developed economies, as well as
the need for a global rebalancing. A critical development issue for LDCs is whether the
dynamism of their intensifying relationships with Southern economies can serve as a
springboard for developing their productive capacities, facilitating structural transformation,
and providing more productive jobs and livelihoods, which are the necessary basis for
substantial poverty reduction.
Page
10
of
115
beginning of the decade. The above shift in LDCs’ export destinations has been paralleled by
the simultaneous evolution of their merchandise imports. In a decade during which the
LDCs’ imports bill rose from $42 billion in 2000 to almost $144 billion in 2009 (after the peak
in 2008), developing countries expanded their market share by roughly 10 percentage
points. As a result, nowadays they account for well over half of LDCs’ total merchandise
imports.
An important feature of LDCs’ trade with Southern partners, however, is its geographic
concentration. A few large developing countries (mostly in the Asian region) account for the
overwhelming share of LDCs’ exports to and imports from the South. Such a concentration is
coupled with huge asymmetries between individual LDCs and their main Southern partners,
in terms of economic size, as well as the dependency on each other’s market. The two Asian
giants, China and India, play a particularly prominent role in LDCs’ growing integration with
other developing countries. China and India became respectively the first and fourth largest
markets for LDCs’ exports, and the second and third source of LDCs’ imports in 2009.
Beyond them, though, a much broader array of countries is involved in the multifaceted
process of South–South economic integration, ranging — just to name a few — from Brazil
to South Africa, from Thailand to Saudi Arabia, and from Malaysia to Turkey.
A major feature of the composition of exports from LDCs to developing countries is the
important role of commodity exports. Indeed, the growth of commodity exports has largely
driven the expansion of LDCs’ exports to the South while the growth of manufactures
exports, often within the context of preferential market access schemes, has played a more
prominent role in the expansion of LDCs’ exports to the North. In 2009, only 15 per cent of
LDCs’ total manufactures exports went to Southern markets, while the latter received over
half of LDC total exports of fuel and minerals. Besides, as much as 68 per cent of LDC
agricultural raw materials exports (including products like cotton) were sent to Southern
destinations. Manufactures imports, particularly from China, India, South Africa and
Thailand, dominate the composition of imports of LDCs from developing countries.
Page
11
of
115
Finally, there are increasing financial flows between LDCs and other developing countries,
including both FDI and official financial flows. Between 2003 and 2010, when total FDI
inflows to the LDCs were growing on average at nearly 20 per cent per year, the share of FDI
projects accounted for by Southern investors climbed from 25 per cent to upwards of 40 per
cent. While these investments are still largely related to extractive industries, there are signs
of incipient diversification to other economic sectors, such as finance, telecommunication,
tourism and manufacturing, with promising implications in terms of innovation and
technological transfers. Southern official flows to LDCs have also surged rapidly over the last
few years. Though South–South official financial flows are rather small in relationship to
traditional ODA disbursements to LDCs, their focus on infrastructure and productive sectors
render them very conducive to developing productive capacities.
A rationale for trade integration of South-South goods and services can be made under both
inward and outward-oriented development paradigms (e.g. Otsubo, 1998). Under the
former, South-South trade is viewed as an alternative to North-South trade that would
enable the South to reduce its dependence on the technologically dominant markets of the
North and, through protection of “infant industries”, break into higher value product
markets. A political manifestation of this concept can be traced back to the mid-1970s and
the beginnings of the Global System of Trade Preferences among Developing Countries
(GSTP). Under the outward-oriented development paradigm, South-South trade integration
is seen as complementary to North-South trade as Southern markets, with their high growth
potential, may offer attractive export opportunities. This type of South-South integration
can be achieved through non-discriminatory integration in the multilateral GATT/WTO
system or through non-discriminatory regional trade agreements. Indeed, rules-based
South-South integration is undoubtedly one important reason for increasing the
participation of low- and middle-income countries in the GATT/WTO.
Page
12
of
115
It has generally been argued that regional trade agreements (RTAs) among developing
countries may induce potential adverse effects on trade patterns among RTA members and
between them and third countries. Cernat (2001), using an expanded gravity model,
estimated for a number of regional trade arrangements among developing countries the
gross trade creation and diversion effects resulting from RTA formation. This paper brings
evidence in favor of the idea that South-South RTAs, and African RTAs in particular, are not
more trade diverting than other RTAs. This evidence suggests that increased trade with both
regional partners and third countries in the case of South-South RTAs might be explained by
the removal of “invisible” trade barriers as a result of trade facilitation measures favored by
RTA formation.
Page
13
of
115
III. CHANGING GLOBAL LANDSCAPE: THE RISE OF THE SOUTH
3.1. Share in Global Trade
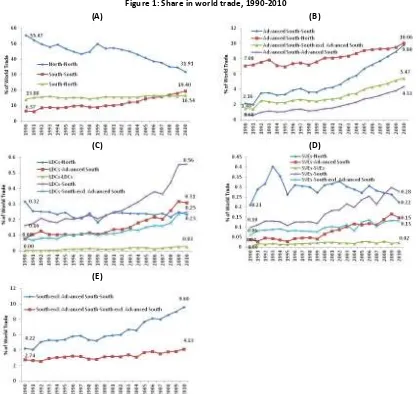
Figure 1 shows the dynamics of the changes in global trade landscape over the past two
decades. According to Figure 1-A, the share of North-North trade in global trade declined
from 55.5 percent in 1990 to around 32 percent in 2010. Such fall in North-North trade had
been accompanied by rising trade involving the South countries. The South-North trade
share increased from 13.9 percent to 16.5 percent during the same time. However, the most
spectacular phenomenon was the rise in South-South trade, which increased from only 6.4
percent to 19.4 percent during this period.
Figure 1: Share in world trade, 1990-2010
(A)
(B)
(C)
(D)
(E)
Note: The lists of countries according to different classifications (North, South, Advanced South, LDCs, SVEs
and South excluding advanced South) are provided in Annex 1.
[image:14.612.100.518.261.655.2]Page
14
of
115
It should, however, be mentioned that such rise in South-South trade has not been uniform
across different South countries. Here the South countries are further classified into
Advanced South, LDCs, SVEs and South excluding Advanced South. Examining the panels in
Figure 1, it becomes very clear that the major drivers of the South-South trade are the rising
trade involving the advanced South countries. The trade between advanced South and all
South countries as a share of world trade was only around 2.16 percent in 1990, which rose
to 9.8 percent by 2010. Also, the trade among the advanced South countries was as low as
only 0.7 percent of world trade in 1990 and it increased to 4.3 percent by 2010.
Furthermore, the trade among the advanced South and South countries excluding the
advanced South increased from 1.5 percent to 5.5 percent during the same period.
As far as the LDCs and SVEs are concerned, their shares in global trade were very low in
1990 (Figures 1-C and 1-D). The LDCs’ trade with the North as a share of global trade was as
low as 0.32 percent in 1990, which declined to 0.23 percent in 2010. However, LDCs’ trade
with the South as a share of global trade increased from 0.16 percent to 0.56 percent during
this period, indicating the re-orientation of LDCs’ trade from the North to the South over the
past two decades. Such rise in trade share of LDCs has been primarily driven by LDCs’
intensified trade with the advanced South countries, which was as low as 0.08 percent of
global trade in 1990, but increased by almost four times to 0.31 percent in 2010. LDCs’ trade
with other South countries excluding the advanced South also increased during the same
period. The intra-LDCs trade however remained very low; starting from close to zero
percent of global trade in 1990 it increased to only 0.03 percent in 2010. Similar pattern is
also observed for the SVEs, where the trade between SVEs and North as a percent of global
trade, despite some fluctuations, remained at the same level during 1990 and 2010. The
SVEs trade with South, especially the advanced South intensified and the intra-SVEs trade
share remained very low.
Figure 1-E suggests that the trade between the South countries excluding the advanced
South and all the South countries, as a share of global trade, increased from 4.2 percent in
1990 to 9.6 percent in 2010; and the pace of such rise in the share was lower than that of
the rise in trade share involving advanced South and all South countries: from 2.2 percent to
9.8 percent as depicted in Figure 1-B. The intra-regional trade among the South countries
excluding advanced South, as a share of global trade, also increased, from 2.7 percent to 4.1
percent during the same period.
Page
15
of
115
3.2. Share in South-South Export
When it comes to country-wise shares in South-South export, there are some gainers and
losers. Annex 2 lists 135 South countries and their shares in South-South export during 2000
and 2010.
2
Annex 2 also compares the changes in average shares in South-South export for
these 135 countries by comparing the averages of shares between 2000-2002 and
2008-2010. Table 1 presents a summary of the findings in Annex 2. It is clear from Table 1 that a
group of only 13 advanced South countries accounts for more than three-fourth of the total
South-South exports. During 2000 and 2010, their share slightly declined from 76.3 percent
to 75.9 percent. The share of LDCs increased from 0.57 percent to 0.61 percent, while that
of SVEs decline from 0.58 percent to 0.46 percent. The South countries excluding the
advanced South could increase their shares from 23.7 percent to 24.1 percent. This suggests
that there are some countries from the LDCs and other South countries (excluding the
advanced South) who were able to increase their shares.
Table 1: Share of country groups in total South-South export
Country group
Average during 2000 and 2002 (%)
Average during 2008 and 2010 (%)
All South
100.00
100.00
LDCs
0.569
0.607
SVEs
0.584
0.458
Advanced South
76.337
75.900
South excluding advanced South
23.663
24.100
Note: Summarized from Annex 2
Data source: UNCOMTRADE
For example, from Annex 2 and summarized it Table 2, it appears that out of the 135 South
countries, 50 countries experienced rise in their shares in South-South export while 85
countries experienced fall in shares. Out of 31 LDCs (listed in those 135 countries) 14
experienced rise and 17 experienced fall. 22 out of the 29 SVEs experienced fall in shares
while only 7 experienced rise. Among the 13 advanced South countries, 4 experienced rise
and 9 experienced fall in shares. Finally out of the 122 South countries excluding the
advanced South, 46 experienced rise and 76 experienced fall in their shares.
Table 2: Comparison of average shares in South-South export
(average of 2000-2002 and average of 2008-2010)
Country group
Number of countries
experienced rise in share
Number of countries
experienced fall in share
Total
All South
50
85
135
LDCs
14
17
31
SVEs
7
22
29
Advanced South
4
9
13
South excluding advanced South
46
76
122
Note: Summarized from Annex 2
Data source: UNCOMTRADE
2
This analysis is limited to the 135 South countries and to the period of 2000 and 2010 to make the best use of
Page
16
of
115
Table 3 lists the top 10 South countries in terms of their shares in South-South export. All
these 10 countries belong to the advanced South countries. The names of the top 10
countries remained the same during 2000 and 2010, though their ranking changed. The total
share of the top 10 South countries declined slightly from 73 percent to 72.08 percent
during this period. China registered a remarkable rise in her share from 15.7 percent to 23.4
percent. While India and Brazil also experienced rises in their shares, India’s gain was more
prominent as she increased her share considerably from 2.7 percent to 4.3 percent, and
Brazil could increase her share by 0.5 percentage points from 3.1 percent to 3.6 percent.
Table 3: Top 10 South countries in term of share in South-South export
Average during 2000 and 2002
Average during 2008 and 2010
Rank
Country
%
Rank
Country
%
1
China
15.7031
1
China
23.3587
2
China, Hong Kong SAR
13.9261
2
Rep. of Korea
9.2363
3
Rep. of Korea
10.1298
3
China, Hong Kong SAR
8.3273
4
Singapore
9.4251
4
Singapore
8.3133
5
Malaysia
5.8827
5
Russian Federation
4.6494
6
Russian Federation
5.0203
6
India
4.3346
7
Thailand
3.7187
7
Malaysia
3.8150
8
Indonesia
3.3361
8
Thailand
3.6328
9
Brazil
3.1133
9
Brazil
3.6188
10
India
2.7471
10
Indonesia
2.7968
Total
73.00
Total
72.08
Note: Summarized from Annex 2
Data source: UNCOMTRADE
When it comes to the rise in the percentage share in South-South export during 2000 and
2010, China tops the list since she could increase her share by 7.7 percentage points (Table
4). The next country in this list is India. Some oil rich countries, such as Saudi Arabia, United
Arab Emirates, Qatar, Iran and Oman are in such list of top 10 countries.
Table 4: Top 10 South countries in terms of rise in percentage share in South-South export
Country
Comparison between
average of 2000-2002 and average of 2008-2010
China
7.6556
India
1.5875
Saudi Arabia
1.1661
Turkey
0.7718
United Arab Emirates
0.7087
Brazil
0.5056
Qatar
0.4383
Iran
0.2942
Oman
0.2576
Panama
0.2401
Note: Summarized from Annex 2
Data source: UNCOMTRADE
Page
17
of
115
share increased by only 6.8 percent. Nepal, though she was among the top 5 LDCs during
early 2000s, experienced fall in the share towards the end of the 2000s.
Table 5: Top 5 LDCs in term of share in South-South export
Average during 2000 and 2002
Average during 2008 and 2010
Rank
Country
Share in total
South-South export
Rank
Country
Share in total
South-South export
1
Bangladesh
0.073
1
Zambia
0.092
2
Cambodia
0.056
2
Bangladesh
0.078
3
Senegal
0.052
3
United Rep. of Tanzania
0.074
4
Zambia
0.049
4
Cambodia
0.070
5
Nepal
0.048
5
Senegal
0.050
Total
0.278
Total
0.364
Note: Summarized from Annex 2
Data source: UNCOMTRADE
The overall performance the SVEs was dismal. The aggregate share of the top 5 SVEs
declined from 0.44 percent to 0.38 percent during this period (Table 6). Among the top 5
SVEs in the early 2000s, only Gabon and Botswana could increase their shares.
Table 6: Top 5 SVEs in term of share in South-South export
Average during 2000 and 2002
Average during 2008 and 2010
Rank
Country
Share in total
South-South export
Rank
Country
Share in total
South-South export
1
Brunei Darussalam
0.171
1
Brunei Darussalam
0.125
2
Bahrain
0.131
2
Bahrain
0.112
3
Gabon
0.066
3
Gabon
0.076
4
Botswana
0.044
4
Botswana
0.052
5
Papua New Guinea
0.029
5
Bhutan
0.017
Total
0.441
Total
0.382
Note: Summarized from Annex 2
Data source: UNCOMTRADE
3.3. Structure of South’s Export
[image:19.612.90.527.119.720.2]
(20)Page
18
of
115
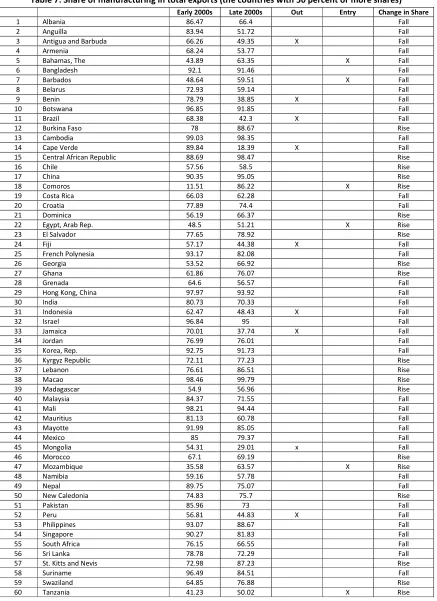
2000s, only 29 countries experienced rise in their share of manufacturing export in total
export, while the rest 40 countries experienced fall.
Table 7: Share of manufacturing in total exports (the countries with 50 percent or more shares)
Early 2000s
Late 2000s
Out
Entry
Change in Share
1
Albania
86.47
66.4
Fall
2
Anguilla
83.94
51.72
Fall
3
Antigua and Barbuda
66.26
49.35
X
Fall
4
Armenia
68.24
53.77
Fall
5
Bahamas, The
43.89
63.35
X
Fall
6
Bangladesh
92.1
91.46
Fall
7
Barbados
48.64
59.51
X
Fall
8
Belarus
72.93
59.14
Fall
9
Benin
78.79
38.85
X
Fall
10
Botswana
96.85
91.85
Fall
11
Brazil
68.38
42.3
X
Fall
12
Burkina Faso
78
88.67
Rise
13
Cambodia
99.03
98.35
Fall
14
Cape Verde
89.84
18.39
X
Fall
15
Central African Republic
88.69
98.47
Rise
16
Chile
57.56
58.5
Rise
17
China
90.35
95.05
Rise
18
Comoros
11.51
86.22
X
Rise
19
Costa Rica
66.03
62.28
Fall
20
Croatia
77.89
74.4
Fall
21
Dominica
56.19
66.37
Rise
22
Egypt, Arab Rep.
48.5
51.21
X
Rise
23
El Salvador
77.65
78.92
Rise
24
Fiji
57.17
44.38
X
Fall
25
French Polynesia
93.17
82.08
Fall
26
Georgia
53.52
66.92
Rise
27
Ghana
61.86
76.07
Rise
28
Grenada
64.6
56.57
Fall
29
Hong Kong, China
97.97
93.92
Fall
30
India
80.73
70.33
Fall
31
Indonesia
62.47
48.43
X
Fall
32
Israel
96.84
95
Fall
33
Jamaica
70.01
37.74
X
Fall
34
Jordan
76.99
76.01
Fall
35
Korea, Rep.
92.75
91.73
Fall
36
Kyrgyz Republic
72.11
77.23
Rise
37
Lebanon
76.61
86.51
Rise
38
Macao
98.46
99.79
Rise
39
Madagascar
54.9
56.96
Rise
40
Malaysia
84.37
71.55
Fall
41
Mali
98.21
94.44
Fall
42
Mauritius
81.13
60.78
Fall
43
Mayotte
91.99
85.05
Fall
44
Mexico
85
79.37
Fall
45
Mongolia
54.31
29.01
x
Fall
46
Morocco
67.1
69.19
Rise
47
Mozambique
35.58
63.57
X
Rise
48
Namibia
59.16
57.78
Fall
49
Nepal
89.75
75.07
Fall
50
New Caledonia
74.83
75.7
Rise
51
Pakistan
85.96
73
Fall
52
Peru
56.81
44.83
X
Fall
Page
19
of
115
Early 2000s
Late 2000s
Out
Entry
Change in Share
61
Thailand
81.37
81.15
Fall
62
Tunisia
77.51
76.34
Fall
63
Turkey
83.59
82.36
Fall
64
Turks and Caicos Isl.
52.7
64.04
Rise
65
Ukraine
80.94
67.55
Fall
66
Uruguay
50.59
34.42
x
Fall
67
Vietnam
47.46
68.61
X
Rise
68
Zambia
83.64
85.04
Rise
69
Zimbabwe
43.82
68.53
X
Rise
Source: Calculated from Annex 3
Annex 3 also suggests that by the late 2000s, 32 South countries had extraction export at
least 30 percent of their total export. The top ten of these countries are Montserrat, Algeria,
Kuwait, Azerbaijan, Venezuela, Nigeria, Saudi Arabia, Gabon, Bahrain and Oman, while they
all have more than 75 percent share of extraction export. It also appears that by late 2000s,
22 countries had agricultural export at least 30 percent of their total export. The top ten of
these countries are Tonga, Maldives, Ethiopia, Vanuatu, Burundi, St. Vincent and the
Grenadines, Gambia, Nicaragua, Uruguay and Uganda, where they all have more than 58
percent share of agricultural export.
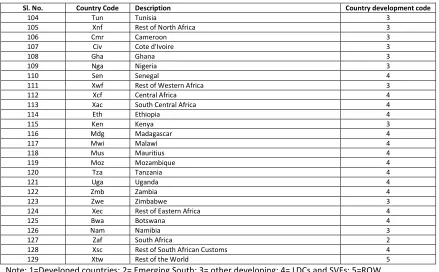
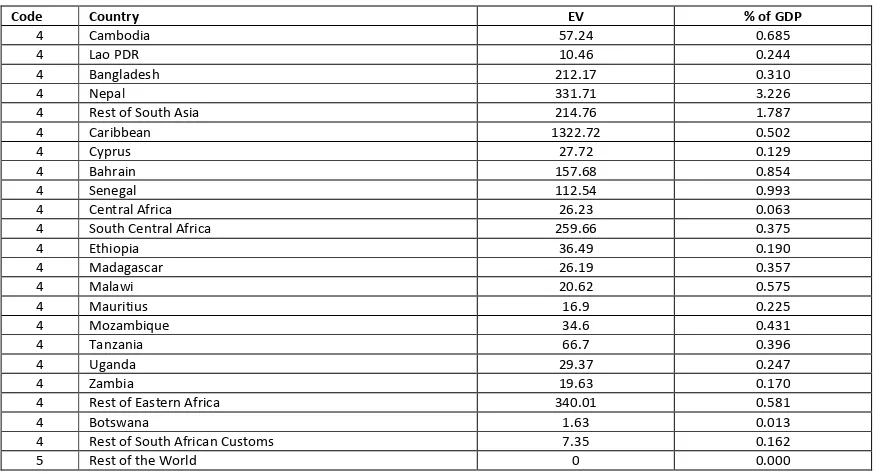
The destinations of the export from South countries are primarily the developed countries
(Table 8). As far as the Emerging South countries are concerned, their exports are also
destined with some significant shares to other developing countries. In the case of other
developing countries, some Latin Amerin countries, like Argentina, Bolivia, Chile, Paraguay,
and Uruguay, some middle Eastern oil rich countries like Iran and Oman, some African
countries like Ghana, and Zimbabwe and some Asian countries like Kyrgyzstan, Mongolia
and Philippines have large shares of their exports (25 percent or more) destined to the
Emerging South countries. Among the LDCs and SVEs, only four countries (or region), such
as Mozambique, Nepal, Rest of South Asia and South Central Africa, have such large shares
of their exports destined to the Emerging South countries.
Table 8: Export destination of countries (Share of total exports)
Country
code
Country
Developed
Emerging
south
Other
developing
LDCs and
SVEs
ROW
Total
Developed countries (North)
Page
20
of
115
Country
code
Country
Developed
Emerging
south
Other
developing
LDCs and
SVEs
ROW
Total
1
Latvia
79.42
10.58
9.47
0.53
0
100
1
Lithuania
75.93
11.58
11.76
0.73
0
100
1
Luxembourg
84.17
6.43
8.53
0.87
0
100
1
Malta
70.82
11.15
16.84
1.19
0
100
1
Netherlands
82.06
7.28
9.51
1.15
0
100
1
New Zealand
64.4
11.92
19.23
4.46
0
100
1
Norway
89.9
3.83
5.36
0.91
0
100
1
Poland
83.18
7.34
8.93
0.55
0
100
1
Portugal
82.06
4.71
8.43
4.8
0
100
1
Rest of EFTA
80.44
7.85
10.93
0.78
0
100
1
Romania
76.29
9.71
13.26
0.74
0
100
1
Slovakia
88.57
5.56
5.52
0.34
0
100
1
Slovenia
72.56
5.66
21.42
0.36
0
100
1
Spain
78.63
8.24
11.58
1.55
0
100
1
Sweden
81.04
9.69
8.36
0.91
0
100
1
Switzerland
75.48
11.83
11.83
0.86
0
100
1
United Kingdom
78.58
8.35
11.54
1.53
0
100
1
United States of America
56.96
21.39
19.53
2.12
0
100
Emerging South
2
Brazil
49.76
16.66
29.62
3.97
0
100
2
China
68.51
9.69
20.18
1.62
0
100
2
India
54.94
13.57
27.04
4.45
0
100
2
Indonesia
57.29
15.98
25.23
1.5
0
100
2
Mexico
88.84
3.01
6.88
1.28
0
100
2
Russian Federation
64.2
12.38
22.31
1.11
0
100
2
South Africa
56.43
14.3
18.08
11.19
0
100
2
Turkey
66.21
9.65
22.86
1.28
0
100
Other Developing (Other South)
Page
21
of
115
Country
code
Country
Developed
Emerging
south
Other
developing
LDCs and
SVEs
ROW
Total
3
Philippines
46.95
34.02
18.44
0.6
0
100
3
Qatar
63.12
14.08
22.27
0.54
0
100
3
Rest of Central America
67.99
7.04
20.51
4.47
0
100
3
Rest of East Asia
67.14
15.58
15.64
1.64
0
100
3
Rest of Eastern Europe
53.23
23.78
21.55
1.45
0
100
3
Rest of Europe
68.71
6.57
23.8
0.93
0
100
3
Rest of Former Soviet Union
34.95
17.2
45.48
2.37
0
100
3
Rest of North Africa
82.86
13.11
3.54
0.49
0
100
3
Rest of North America
77.29
10.24
10.18
2.3
0
100
3
Rest of South America
80.57
5.04
7.55
6.85
0
100
3
Rest of Southeast Asia
50.01
24.59
24.75
0.65
0
100
3
Rest of Western Africa
40.23
37.25
21.37
1.15
0
100
3
Rest of Western Asia
59.92
21.25
16.93
1.9
0
100
3
Saudi Arabia
57.8
19.82
19.9
2.48
0
100
3
Singapore
43.88
24.71
29.96
1.44
0
100
3
Sri Lanka
71.51
12.31
14.18
2
0
100
3
Taiwan
42.11
41
16.17
0.72
0
100
3
Thailand
52.42
21.07
23.25
3.27
0
100
3
Tunisia
81.29
5.27
12.29
1.15
0
100
3
Ukraine
41.21
32.66
24.12
2
0
100
3
United Arab Emirates
54.4
11.07
32.43
2.11
0
100
3
Uruguay
45.31
26.27
26.23
2.19
0
100
3
Venezuela
78.97
8.19
8.44
4.4
0
100
3
Viet Nam
68.97
11.71
16.82
2.49
0
100
3
Zimbabwe
31.26
38.81
6.86
23.07
0
100
LDCs and SVEs
4
Bahrain
41.79
13
39.35
5.86
0
100
4
Bangladesh
85.41
6.19
7.54
0.86
0
100
4
Botswana
79.21
10.7
9.58
0.52
0
100
4
Cambodia
84.75
4.64
9.9
0.71
0
100
4
Caribbean
67.29
12.09
14.29
6.34
0
100
4
Central Africa
68.64
19.01
9.87
2.49
0
100
4
Cyprus
72.02
13.38
13
1.6
0
100
4
Ethiopia
59.48
9.93
21.72
8.87
0
100
4
Lao PDR
40.52
8.81
50
0.67
0
100
4
Madagascar
76.99
9.37
10.7
2.94
0
100
4
Malawi
54.51
15.78
25.07
4.63
0
100
4
Mauritius
76.19
8.94
10.01
4.86
0
100
4
Mozambique
53.28
34.05
10.29
2.38
0
100
4
Nepal
47.78
42.48
8.88
0.85
0
100
4
Rest of Eastern Africa
43.22
44.65
9.2
2.93
0
100
4
Rest of Oceania
69.8
14.2
13.54
2.46
0
100
4
Rest of South African Customs
66.54
10.2
13.42
9.85
0
100
4
Rest of South Asia
50.62
27.03
17.84
4.51
0
100
4
Senegal
50.76
9.74
37.36
2.14
0
100
4
South Central Africa
53.1
35.66
8.66
2.58
0
100
4
Tanzania
56.03
17.93
19.31
6.72
0
100
4
Uganda
57.03
10.56
18.57
13.84
0
100
4
Zambia
35.08
24.3
31.9
8.72
0
100
5
Rest of the World
72.62
17.72
8.82
0.84
0.00
100.00
Note: Country code 1=Developed countries; 2= Emerging South; 3= other developing; 4= LDCs and SVEs;
5=ROW
GrainsCrops = Grains and Crops; MeatLstk = Livestock and Meat Products; Extraction = Mining and Extraction,
ProcFood = Processed Food; TextWapp = Textiles and Clothing; LightMnfc = Light Manufacturing; HeavyMnfc =
Heavy Manufacturing; Util_Cons = Utilities and Construction; TransComm = Transport and Communication;
OthServices = Other Services
Page
22
of
115
IV. WHAT FACTORS DETERMINE SOUTH-SOUTH TRADE?
What are the factors which determine the pattern of South-South trade? It has already
been highlighted in the previous sections that South countries are not homogenous,
therefore, the there could be differential effects of different variables on the patterns of
trade among different groups of South countries. Empirically, such analysis can be done
using the framework of gravity models. In the following sub-sections the basic gravity
models and augmented gravity models are run to examine the effects of different factors on
the bilateral trade among different country groups. The gravity model is one of the most
widely used models in international economics and is capable of explaining patterns of
international trade. Theoretical foundations for the gravity model have been provided by
Bergstrand (1985, 1989, 1990), Leamer (1974), Anderson (1979), Helpman (1987), Deardorff
(1998), Head and Ries (2005).
4.1. The basic gravity model
In this study, six groups of countries have been identified: South (group of developing
countries), North (group of developed countries), LDCs (group of least developed countries),
SVEs (group of small and vulnerable countries), Emerging South (group of advanced
developing countries), and South Excluding Emerging South (group of developing countries
excluding the advanced developing countries). The list of countries under different country
groups are already presented in Annex 3. The basic gravity regressions for each of these
country groups have been run considering all other groups including itself as partners. Thus,
there are 36 different gravity regressions and for these 36 pairs (home-partner) the basic
gravity model considered is shown in Equation 1:
lnm
lngdp_pc
lngdp_pc
lndiscap
comlang
landlock
landlock
island
island
comborder
"Equation 1(
Where,
lnm
= Log of import of home country from partner country in year t (US$)
lngdp_pc
= Log of per capita GDP of home country at constant price of 2000 in year t (US $)
lngdp_pc
= Log of per capita GDP of partner country at constant price of 2000 in year t (US $)
lndiscap
= log of distance between the capitals of home and partner countries
comlang
= Common language dummy if home and partner countries have common language
landlock
= Land lock dummy for home country
landlock
= Land lock dummy for partner country
island
= Island dummy for home country
island
= Island dummy for partner country
comborder
= Common border dummy if home and partner countries have common border
Page
23
of
115
data base. The data of per capita GDP are taken from the World Bank’s World Development
Indicators data base. The data on the distance between the capitals of home and partner
countries, common language dummy and land lock dummy are taken from the “GeoDist”
data base of CEPII. The data on island dummy and common border dummy are taken from
Wikipedia. To estimate the gravity regressions fixed effect models are run by introducing
country dummy and year dummy. Heteroskedasticity is also controlled for which could be
apparent in a panel data with long time dimension.
[image:25.612.90.525.201.477.2]