ISSN Online: 2327-5960 ISSN Print: 2327-5952
Acculturation and Dietary Change in
Mexican-American Immigrant Women
Maria Isabel Ortega-Velez
1*, Pedro Alejandro Castañeda-Pacheco
21Centro de Investigación en Alimentación y Desarrollo, A.C. División de Nutrición, Hermosillo, Mexico
2Universidad de Sonora, Hermosillo, Mexico
Abstract
Our study explored the process of acculturation among Mexican women liv-ing in southwest U.S., and the consequences regardliv-ing dietary risk factors as-sociated to health. The cross-sectional study included face to face interviews with 150 migrant women and 150 non-migrant women. Interviews consisted of two non-consecutive 24-hour recalls, and data on anthropometry, accultu-ration, dietary change and lifestyle. Multiple regression analysis showed that consumption of calories from saturated fat and body mass index (BMI) were significantly higher in migrant women compared to non-migrant women, even after adjusting for other lifestyle and diet related variables. Overall, ac-culturation seems to be associated with more access to food rather than with a change in consumption of dietary risk components. Furthermore, accultura-tion was associated positively with socioeconomic status, indicating interplay of socioeconomic and cultural variables related to eating behavior in Mexican immigrant women. Positive association of BMI with acculturation and of ac-culturation with socioeconomic status suggests that health risk factors among Mexican immigrant women follow similar trends of those of women in their born country.
Keywords
Acculturation, Immigrant Women, Diet, Dietary Change, Obesity
1. Introduction
We are experiencing an era where the shift in focus from communicable to chronic diseases is challenging not only the current perspectives of health educa-tion, but also the priorities of health care. However, results from interventions to change health-related behaviors that considered lifestyle as short-term practices
How to cite this paper: Ortega-Velez, M.I. and Castañeda-Pacheco, P.A. (2017) Ac-culturation and Dietary Change in Mex-ican-American Immigrant Women. Open Journal of Social Sciences, 5, 211-243.
https://doi.org/10.4236/jss.2017.57014
Received: June 6, 2017 Accepted: July 14, 2017 Published: July 17, 2017 Copyright © 2017 by authors and Scientific Research Publishing Inc. This work is licensed under the Creative Commons Attribution International License (CC BY 4.0).
http://creativecommons.org/licenses/by/4.0/
have been quite unsuccessful. Behaviors resulting from different lifestyles are understood not as isolated acts controlled by the individual, but as acts that are socially conditioned, culturally embedded, and economically constrained. (Green and Kreuter, 1991; CSDH, 2008) [1][2].
Concurring with the above perspective, being sensitive to how individuals de-fine and understand health according to their cultural orientation will facilitate the health promoter’s work. The more a health promoter knows about the be-liefs, attitudes, traditions and practices of a given cultural group and how they change within a new cultural setting, the more his/her activities will improve and become effective. Health facilitators that have an understanding and respect for the community’s ways could be more easily involved in a program intended to improve its health (González et al., 1991; Cyril et al., 2015) [3][4]. At a national level, it is also imperative to be aware of the needs that different sub-groups in a society can have given their economic and cultural differences.
According to the document Healthy Border 2020: A Prevention & Health Promotion Initiative (2010) [5], the main risk factors for obesity and diabetes among the population of the U.S. and Mexico border communities are physical inactivity, poor diet (high caloric intake), poverty, genes (non-modifiable deter-minants), lack of breastfeeding, and education/lack of information. Most of this determinants have been documented higher in Hispanics populations compared to White populations (Willey et al., 2012; Siega-Riz et al., 2014) [6][7].
Not only Hispanics are one of the largest ethnic minority groups in the U.S. (Cortes-Bergoderi et al., 2013) [8], but the number of Hispanics is increasing almost four times as fast as the rest of the population, totaling 47,435,002 million according to the U.S Census Bureau, (2010) [9]. Nationally, Mexicans are the largest Hispanic origin group, making up 64.6% of all Hispanics (Brown and López, 2013) [10]. The largest concentrations of Mexican Americans are in the Western states, notably California and Texas, with others growing rapidly, namely in Arizona and New Mexico. California, Texas, New México and Arizo-na have 32%, 33%, 30% and 27% of Mexican origin population respectively (Brown and López, 2013) [10].
Regional information on Mexican Americans’ health has been concentrated in those states with the largest numbers of Mexican Americans, such as California and Texas. There is, however, a growing interest in exploring other places in which the Mexican population is increasing. It is also imperative to understand the differences in the lifestyle and living conditions of Mexican Americans as a result of different historic development of their communities (Robinson, 1998; Roberts, 1995) [11][12]. In this context, it is also worth exploring the challenges and strategies related to health and nutrition that Mexican-Americans are facing in those places, as well as the geographic, socioeconomic, demographic, and cultural characteristics of the environment that shape their lifestyles (Ayala et al., 2008) [13].
as low income, it has a health prognosis that is related to variables somewhat different from other low income minority groups. Several studies and review papers, have explored the relationship between socioeconomic status (mainly through income, education and occupation) and health risk factors (i.e. obesity, smoking) (Sobal and Stunkard, 1989; Belcher, et al., 1993; Kumanyika and Gol-den 1991; Maurer et al., 1989; Samet et al., 1988; Hanis et al., 1983; Stern et al., 1981; Liao et al., 2007; Cortes-Bergoderi et al., 2013) [8] [14]-[21], and con-cluded that not only is socioeconomic status related to the presence of more health risk factors, but other variables are also involved in the process of dietary behavior. Acculturation has been frequently associated to health risk factors and dietary behavior among Latino and Hispanic populations in the U.S., however several studies proposed that such association may be mediated by other va-riables such a place of origin, and residence, access to and use of health care fa-cilities, awareness of the diet-health relationship, the importance of physical ex-ercise, and adaptation to new environments (Ayala et al., 2008; Pérez-Escamilla R, 2011) [13][22].
Within the aforementioned, it is the aim of this study to further the under-standing of the present social, cultural, and economic characteristics that shape the lifestyle, and as a consequence, the dietary pattern of a group of Mexican Americans in the border region of Arizona.
Conceptual Framework
The theoretical framework used to guide the present study is based on two eco-system perspectives. It integrates the conceptual eco-systems from the model of communication-acculturation developed by Kim (1991) [23], and the ecological perspective on nutrition proposed by Pelto (1981) [24], and Sims (1972) [25].
The conceptual framework, incorporates an attempt to examine how
differen-tiation (defined as the extent of the presence of dietary risk factors) in dietary
behavior and food consumption among Mexican American families is related to the level of acculturation, socioeconomic, and demographic characteristics. Consequently, the dependent or outcome variables of the study were food con-sumption and dietary change, which are the main components of dietary beha-vior. Additional outcomes resulting from differentiated dietary behaviors and food consumption included an obesity indicator or Body Mass Index (BMI), and body fat distribution (from measures of waist-hip circumferences ratio). Some other variables that can affect the dependent variables were also explored such as smoking behavior, physical activity, alcohol consumption and stress.
2. Sample and Methods
related to differentiated nutritional, psychosocial and genetic factors. Second, studies on the effect of acculturation on dietary intake and health risk factors among Hispanics and Latinos in the U.S., have reported that conclusive evidence is still lacking (Pérez-Escamilla, 2011) [22]. Third, the urgent need for more in-formation regarding obesity and chronic degenerative disease risk factors, such as poor diet, across the U.S. and Mexico border (Healthy Border 2020: A Pre-vention & Health Promotion Initiative (2010) [5].
2.1. Study Design and Sampling
The type of research was cross-sectional and included a purposive site selection from which systematic random selection of units of study (women) were enrolled. Two populations were of interest for this study; migrant Mexican American families (FM) living in Yuma County, Arizona, and low-income non- migrant Mexican families (NM) from Hermosillo, Sonora, Mexico. This last group was considered as a reference group for nutritional variables as dietary intake, obesity and body composition indicators. Sample size was calculated us-ing general formulas for group comparison and association analysis (Bowner et al., 1988) [26], and resulted in 129 families per group; we interviewed 150 wom-en in each group. The selection of womwom-en was carried out at The WIC Clinic in Yuma, Arizona and at a Public Health Center in Hermosillo, México. As women were waiting for their turn to see a doctor or routine evaluation, we selected each 10th woman in line that met the eligibility criteria (age ≥ 18 years, at least one year of residence in Hermosillo or Yuma, having preschool children, and wil-lingness to participate in the study). Each participating women signed an in-formed consent. This study was carried out in accordance with the recommen-dations of the University Committee on Human Subjects from Cornell Univer-sity in 1994.
2.2. First and Second Face-to-Face Interviews
The first interview was conducted at the clinic and lasted 45 to 105 minutes; it consisted of a semi-structured 20-page questionnaire that included a 24-hour recall, a semiquantitative food frequency questionnaire (data not-shown, except for alcohol intake), validated scales for acculturation and emotional stress, die-tary change and food preparation, behavioral health risk factors (smoking beha-vior, physical activity, weight concern, and health care), migration, employment, and educational background (Appendix A). We also collected anthropometric data. The second interview involved a 24-hour recall conducted at least one month from the first interview at the participant’s home, and lasted 20 to 30 mins (Conway et al., 2003) [27]. Quantitative estimation of food was supported by the use of common food containers, spoons, glasses, and cups.
Composi-tion Data for Mexican PopulaComposi-tions (Hernández and Chávez, 1980) [29] and the Regional Food Composition Databank provided by C.I.A.D. in Hermosillo, Mexico (Grijalva, et al., 1995) [30].
2.3. Dietary Change
Concepts such as retention or addition of foods to common dietary practices among Mexican Americans were used to measure dietary change (Dewey et al., 1984; Romero et al., 1993) [31][32]. Common dietary changes during the year before to the interview and during the last five years were also recorded, as well as reasons for reported changes (Sanjur in 1995) [33].
2.4. Overweight and Body Composition
Weight and height were measured according to established protocols (Cameron, 1986) [34], with a calibrated digital scale (Kubota, KA-10-HB; 0-150 ± 0.5 kg) and a Holtain stadiometer (Holtain LTD, UK; 0-205 ± 0.1 cm). For waist and hip circumferences we used a fiberglass tape (Kissebah and Krakower, 1994) [35]. From height and weight measurements we calculated the Body Mass Index (BMI). We used the WHO categories to define weight status (WHO, 1995) [36]. Waist and hip circumferences were used to construct adiposity ratios (WHO, 2008) [37].
2.5. Acculturation
Acculturation was operationalized through a score obtained by using an accul-turation scale developed from selected variables in Kim’s (1988) [23] model of communication/acculturation (language preference and use, ethnic identity, and social networks, as well as perceived discrimination) and from the scale of ac-culturation for Mexican Americans developed by Cuellar (1980) [38] (language preference and use, ethnic identity and social networks).
2.6. Other Health Related Variables
In the present study, only current smokers were considered; operationalization of alcohol consumption was described from the data in the food frequency ques-tionnaire. From the daily activities reported in the pilot study done in the sum-mer of 1993 in Arizona, an index of heavy, moderate, and light physical activity (PAL) was developed and registered depending on the activities reported by women. A modified scale developed by Krause and and Goldenhar (1992) [39] was used to measure stress and acculturation in a sample of elderly Hispanics. This scale involved the domains of financial strain, social isolation, and effects of depression. From our previous 1993 pilot study in Yuma, items such as concern about children’s behavior and communication with relatives in Mexico were added. A total score of stress was derived.
2.7. Ethnography
study was conducted in both studied communities (Patton, 1990) [40]. The purpose of this qualitative work was to characterize the communities and to ex-plore food related issues among families in order to further the understanding and support the cross-sectional research with participant observation, and in-formal talks with key informants.
2.8. Statistical Analysis
Questions belonging to dietary practices and socioeconomic and demographic variables were coded and input using the SAS and SPSS statistical software [41] [42] were used on exploratory (multicollinearity, frequency distributions, plot analysis) and descriptive data analysis (means, standard deviations, skewness, kurtosis). The analysis of association and group comparisons were performed using multiple regression analysis and the Pearson product-moment correlation. Chi-square analysis was also used to compare proportions.
3. Results
152 migrant women from Yuma County, and 157 non-migrant women from Hermosillo, Mexico were interviewed. Nineteen (12%) of the migrant women (Yuma) and 28 (18%) of the non-migrant women (Hermosillo) were pregnant at the time of the interview, and 9% and 13% (respectively) were lactating.
[image:6.595.209.538.568.722.2]3.1. Socioeconomic and Demographic Characteristics
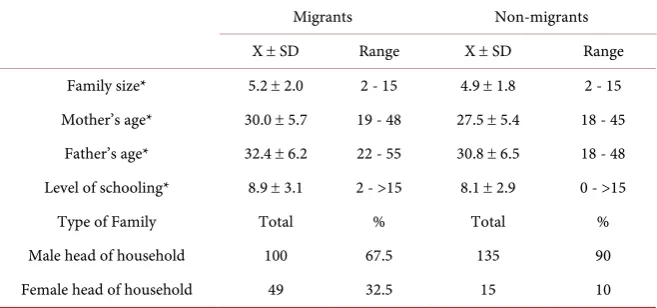
Table 1 contains data on the main socioeconomic and demographic
characteris-tics of participant women. There were no significant differences (tested by one way ANOVA) between migrant women and non-migrant women concerning family size mother’s and father’s age, and level of schooling. However, there was a substantial difference in the family structure between the two groups. Migrant families had a higher percentage of female heads of household than did non- migrant families. Since more than three quarters of migrant and non-migrant women were homemakers, they were not performing paid work during the pe-
Table 1. Selected sociodemographic characteristics among migrant and non-migrant families.
Migrants Non-migrants X ± SD Range X ± SD Range Family size* 5.2 ± 2.0 2 - 15 4.9 ± 1.8 2 - 15 Mother’s age* 30.0 ± 5.7 19 - 48 27.5 ± 5.4 18 - 45 Father’s age* 32.4 ± 6.2 22 - 55 30.8 ± 6.5 18 - 48 Level of schooling* 8.9 ± 3.1 2 - >15 8.1 ± 2.9 0 - >15 Type of Family Total % Total % Male head of household 100 67.5 135 90 Female head of household 49 32.5 15 10
riod of the first interview. Migrant women were more likely to work in agricul-ture in Yuma County and as clerks before they migrated.
3.2. Acculturation of Migrant Women
The acculturation scale included 11 items which represented the proficiency of language use and preference of language (7 items), social networks (3 items) and identity (1 item). A test of reliability resulted in a Cronbach’s alpha [43] of 0.77, indicating a moderately reliable scale.
Scale range varied from 15 points (which indicated that women preferred and used Spanish language at all times, had friends and neighbors only of Mexican descent, attended social gatherings only with Mexican individuals, and identified themselves always as Mexican) to 77 points (which indicated that women used and preferred to speak English, attended social gatherings with American indi-viduals only, and identified themselves always as American). Some of the items in the scale were not relevant for women that reported that they did not listen to the radio, read books, or magazines, or go to parties or social gatherings. Items that were not applicable were coded as 0. Percentages of women who had one, two or three not applicable items were as follows: 30 (20%) for 1 item, 12 (8%) for 2 items and 1 (0.6%) for 3 items.
3.3. Food Consumption/Meal Patterns
Migrant and non-migrant women’s meal patterns were described using two cri-teria proposed by Sanjur (1995) [33]: the presence of each food item, and the usual combination of food items within their common cultural foodways. Typi-cal meal patterns included foods consumed by at least 30% of the women in each group. Variations to the main meal pattern involved foods consumed by at least 10% of the women in each group. Comparison of typical meal patterns among migrants and non-migrants reflect the inclusion of very similar food items and meal patterns (breakfast, lunch, dinner, and snack). However, migrant women’s lunch included beef as part of the usual meal pattern. In non-migrants diets beef is present for lunch, but just as a variation of the usual lunch pattern. In addi-tion, beef is again included for dinner within the main meal pattern of migrant women and constitutes a more elaborate meal than among non-migrant women. An explanation for this pattern could be that even when lunch is still the main meal of the day, dinner could become the main meal for those women that fol-low the American meal pattern. This is true especially when their families and they follow a work schedule in the U.S. Migrant and non-migrant women’s fruits and vegetables intake was scarce. Tomatoes and onions were the only vegetables consumed by more than 50% of the sample; however, they were used just as condiments or in very small quantities when cooking foods.
studied groups, as well as saturated fat consumption in migrant women. On the other hand, fiber consumption seems to be high in both studied groups when compared to mean consumption in the total adult US population (≈17 g/day) (Storey and Anderson, 2014) [44].
3.4. Food Consumption/Dietary Change
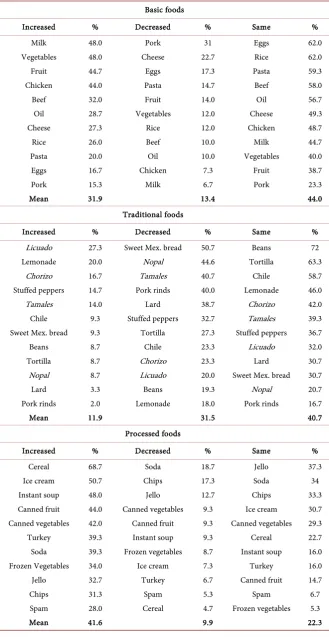
Dietary change considered: a) perceived dietary change in the last year and in the last five years and the main reasons to change, and b) actual change in the consumption of 34 food items after migration for migrant women. Whether women’s food consumption increased, decreased, did not change or they never tried three different sets of food items (eleven basic foods, twelve traditional foods, and eleven processed foods) was assessed as the percentage of women in every category. In addition, a total score of change was computed for each cate-gory.
Among migrants 17% and 23.2% of women responded that they have made some change in their food consumption or cooking methods during the last year and last five years, respectively. Among non-migrants, the percentages were quite similar, with 19% and 18% of respondents stating that they have made some change in the foods they eat or the ways of cooking it. Migrant women’s main reasons for dietary change were driven by a change in legal status (i.e. marriage, 5%), more knowledge about cooking (3%), or the presence of an ex-tended family member (i.e. mother-in-law, 2%). Only 8% of migrant women re-sponded that they had made changes because of migration, 16% because of health reasons, and 2% because of food cost, which were originally expected to be the main reasons for dietary change.
Table 2 shows the percentage of migrant women that answered according to
the different categories of increased, decreased, did not change, or never tried for each food item. As we can see for basic foods, the trends in change (shadow areas) show that more migrant women have increased their consumption of ba-sic foods or that the consumption of basic foods has stayed the same after migra-tion. In other words, the highest percentages of migrant women’s responses to change are distributed in the categories of “increase” and “no change” for basic foods. Interestingly, almost half of migrant women (48%) stated that they had increased their consumption of vegetables and milk, as well as 45% and 44% for fruit and chicken. However, high percentages of migrant women have not changed their basic food consumption (especially for eggs, rice, pasta, and oil).
Regarding change in traditional food consumption, the trend is distributed mainly among “decrease” and “stayed the same” categories. Traditional foods such as Mexican sweet bread, nopal (cactus), chicharrón (pork rinds) and ta-males were foods that more than 40% of migrant women reported diminishing their intake. Except for Mexican sweet bread, nopal, chicharrón,and tamales are
traditional foods that are not part of the daily consumption of foods among
Table 2. Dietary changes among migrant women: increase, decrease, or no change in ba-sic, traditional, and processed foods after migration.
Basic foods
Increased % Decreased % Same % Milk 48.0 Pork 31 Eggs 62.0 Vegetables 48.0 Cheese 22.7 Rice 62.0 Fruit 44.7 Eggs 17.3 Pasta 59.3 Chicken 44.0 Pasta 14.7 Beef 58.0 Beef 32.0 Fruit 14.0 Oil 56.7 Oil 28.7 Vegetables 12.0 Cheese 49.3 Cheese 27.3 Rice 12.0 Chicken 48.7 Rice 26.0 Beef 10.0 Milk 44.7 Pasta 20.0 Oil 10.0 Vegetables 40.0 Eggs 16.7 Chicken 7.3 Fruit 38.7 Pork 15.3 Milk 6.7 Pork 23.3 Mean 31.9 13.4 44.0
Traditional foods
Increased % Decreased % Same % Licuado 27.3 Sweet Mex. bread 50.7 Beans 72 Lemonade 20.0 Nopal 44.6 Tortilla 63.3
Chorizo 16.7 Tamales 40.7 Chile 58.7 Stuffed peppers 14.7 Pork rinds 40.0 Lemonade 46.0 Tamales 14.0 Lard 38.7 Chorizo 42.0 Chile 9.3 Stuffed peppers 32.7 Tamales 39.3 Sweet Mex. bread 9.3 Tortilla 27.3 Stuffed peppers 36.7 Beans 8.7 Chile 23.3 Licuado 32.0 Tortilla 8.7 Chorizo 23.3 Lard 30.7 Nopal 8.7 Licuado 20.0 Sweet Mex. bread 30.7 Lard 3.3 Beans 19.3 Nopal 20.7 Pork rinds 2.0 Lemonade 18.0 Pork rinds 16.7 Mean 11.9 31.5 40.7
Processed foods
ing patterns of Mexicans, such as beans, tortillas, and chili, were reported by high percentages of migrant women (72%, 63%, and 59%, respectively) as “stayed the same.” This suggests that even after migration the majority of wom-en (and, consequwom-ently, migrant families) continued to consume main traditional Mexican foods. Regarding processed foods intake, the trend was distributed mainly within the categories of “increased” and “stayed the same.” Percentages of women that increased processed foods consumption were, however, higher across all food items (cold dry cereals, ice cream, instant soup, and canned fruit).
3.5. Nutritional Status: Anthropometry
According to different categories of BMI, 37% of migrant women and 36% of non-migrant women were in the overweight range. However, more migrant women (32%) were categorized as obese, as compared with 19% among non- migrant women. Migrant women exhibit an even higher degree in the category of extreme obesity (4%) as compared to non-migrant women (1%). Regarding waist/hip circumference ratios among migrant and non-migrant women, and using the cut-off point of 0.8%, 52% and 42% of migrant and non-migrant women were at some risk of cardiovascular disease according to their body fat distribution pattern.
3.6. Physical Activity
Migrant women showed physical activity level (PAL) ranging from light to moderate levels, while non-migrant women had moderate and heavy PAL levels. Conversely, migrant women were more likely to be engaged in some kind of regular physical exercise (36%) than non-migrant women (13%). In general, however, high percentages of women in both migrant (64%) and non-migrant (87%) groups did not report engaging in any kind of regular physical exercise.
3.7. Smoking and Alcohol Consumption
Smoking did not appear as a prevalent health risk among the study sample, since only a small percentage of women reported being current smokers in both mi-grant and non-mimi-grant groups (10 and 12% respectively). Among mimi-grant women 16% (1% daily, 3% weekly, 4% monthly, and 6% yearly) consumed some kind of alcoholic beverage (beer, any kind of liquor, or wine). Among non-mi- grant women, 22% consumed alcoholic beverages (6% weekly, 7% monthly, and 8% yearly).
3.8. Stress (Only Migrant Women)
Among migrant women, the reliability test revealed a moderately reliable stress scale (Cronbach’s alpha = 0.66) with a point range of 9 to 18. Mean score of stress for migrant women was 12.6 ± 2.2.
3.9. Multivariate Analysis
car-bohydrates were done between migrant and non-migrant women, after adjusting for some socioeconomic and demographic variables. Variables included for ad-justments were age, education, type of family, physical activity level, energy consumption (for BMI), lactation, pregnancy, and smoking.
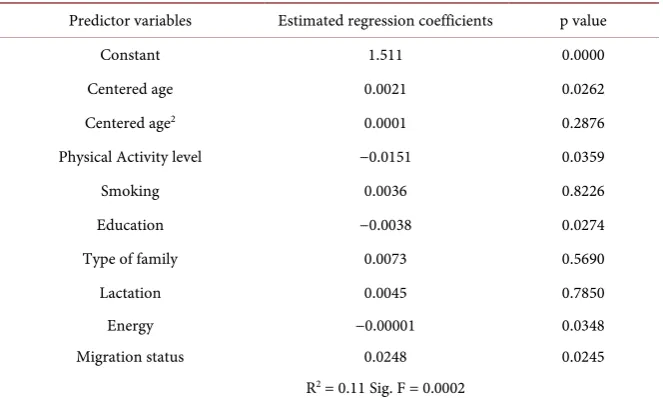
Table 3 shows the estimated regression coefficients, significance of variables, R2, and model significance, which show significant higher BMI among migrant women. In the case of total energy, energy from total fat and saturated fat and carbohydrates (Table 4), results comparing migrant and non-migrant women’s diets indicate that migrant women were consuming significantly less total energy compared to non-migrant women. Also, that there were no differences between migrant and non-migrant women regarding energy from total fat consumption. Migrant women, however, consumed significantly more calories from saturated fat and fewer calories from carbohydrates than non-migrant women.
3.10. Determinants of Risk Factors among Migrant Women
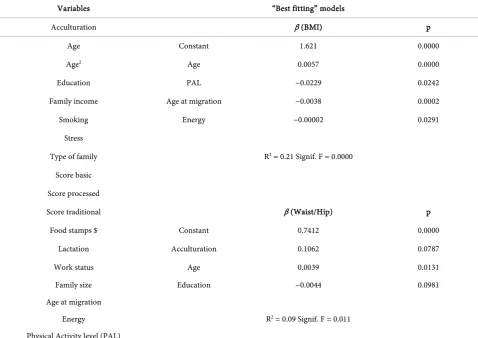
Table 5 shows the predictor variables considered to explain the variation of BMI and waist/hip ratios among migrant women. It also shows the “best fitting” models for the same indicators. From the analysis of the models presented for BMI, it seems the exposure to the American culture (represented by age at gration) became an important variable in explaining differences in BMI in mi-grant women. The more exposure to the American culture the women have, the more likely they are to increase their BMI. This is explained by the negative di-rection of regression coefficient for age at migration in the model; when age at migration was not considered, acculturation was significantly and positively re-lated to BMI. Other significant variables in the model were age, consumption of energy and physical activity level. In the case of fat distribution, the full model was not significant in explaining the differences in waist/hip ratios among mi-grant women. However in the “best” fitting model, acculturation was marginally
Table 3. Estimated regression coefficients and significance of predictor variables for BMIs (log): comparing migrant and non-migrant women.
Predictor variables Estimated regression coefficients p value Constant 1.511 0.0000 Centered age 0.0021 0.0262 Centered age2 0.0001 0.2876
Physical Activity level −0.0151 0.0359 Smoking 0.0036 0.8226 Education −0.0038 0.0274 Type of family 0.0073 0.5690 Lactation 0.0045 0.7850 Energy −0.00001 0.0348 Migration status 0.0248 0.0245
Table 4. Comparing migrant and non-migrant women: estimated regression coefficients and significance of predictor variables for total energy, energy from total and saturated fat, and carbohydrates consumption (squared root).
Predictor variables Estimated regression coefficients (total energy) p value
Estimated regression coefficients
(total fat) p value
Estimated regression coefficients
(saturated fat) p value
Estimated regression coefficients
(carbohydrates) p value Constant 2054.4 0.0000 5.37 0.0000 2.90 0.0000 7.658 0.0000 Centered age −8.39 0.2493 −0.0009 0.9538 −0.0004 0.9666 0.0113 0.4883 Centered age2 0.7148 0.4277 −0.0031 0.1087 −0.0016 0.1807 −0.0057 0.0047
Physical
Activity level −107.6 0.0526 0.1663 0.1601 0.0930 0.2093 0.2601 0.0362 Smoking −119.2 0.3288 0.4237 0.1130 0.2020 0.2271 0.1677 0.5480 Education 0.3120 0.3120 0.0168 0.5504 0.0129 0.4641 −0.0253 0.3910 Type of family 0.3299 0.3299 −0.4530 0.0316 −0.2284 0.0831 −0.0974 0.6573 Pregnancy 0.3173 0.3173 0.2195 0.3320 0.1942 0.1709 −0.0772 0.7442 Lactation 415.9 0.001 −0.2170 0.4276 −0.0863 0.6140 0.1992 0.4864 Migration status −197.4 0.0171 0.0611 0.7283 0.322 0.0037 −0.7091 0.0001 R2 = 0.10 Sig. F = 0.0003 R2 = 0.05 Sig. F = 0.1116 R2 = 0.08 Sig. F = 0.0062 R2 = 0.11 Sig. F = 0.0002
Table 5. Predictor variables for BMIs and waist/hip ratio among migrant women: (full and “best fitting” model).
Variables “Best fitting” models
Acculturation β (BMI) p Age Constant 1.621 0.0000 Age2 Age 0.0057 0.0000
Education PAL −0.0229 0.0242 Family income Age at migration −0.0038 0.0002 Smoking Energy −0.00002 0.0291
Stress
Type of family R2 = 0.21 Signif. F = 0.0000
Score basic Score processed
Score traditional β (Waist/Hip) p Food stamps $ Constant 0.7412 0.0000
Lactation Acculturation 0.1062 0.0787 Work status Age 0.0039 0.0131 Family size Education −0.0044 0.0981 Age at migration
Energy R2 = 0.09 Signif. F = 0.011
[image:12.595.57.536.386.724.2]significant. In addition to acculturation, education was significant in the same model, indicating that the variation in waist/hip ratio is also related to socioe-conomic status.
3.11. Dietary Risk Factors and Acculturation
One of the main dietary risk factors for chronic diseases is, as referred earlier, high levels of total energy and fat intake, and especially the proportion of total energy from fat. In this study, intake of fat and calories provided by fat and sa-turated fat are thought to be influenced by dietary change, and in particular by that change related to the process of migration and exposure to a new culture. In this context, the variation in consumption of total energy, energy from total and saturated fat, and carbohydrates was explored mainly as a function of accultura-tion, controlling for socioeconomic, demographic, and health related variables. The three sub-scales related to dietary change were also included in the model as was proposed initially in the conceptual model.
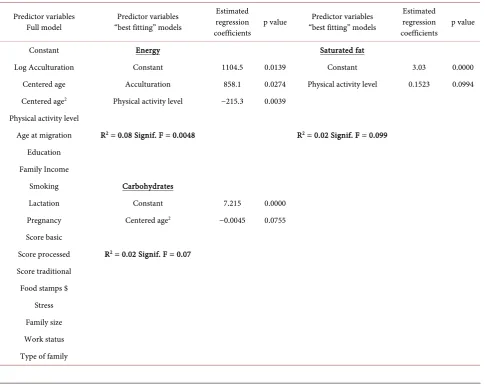
[image:13.595.57.543.367.754.2]The full model presented in Table 6 was not significant as to explain energy consumption. The “best” fitting model, however, seems to explain, though in a
Table 6. Predictor variables, estimated regression coefficients and significance of variables for total energy, energy from total and saturated fat and carbohydrates among migrant women.
Predictor variables
Full model “best fitting” models Predictor variables
Estimated regression
coefficients p value
Predictor variables “best fitting” models
Estimated regression
coefficients p value Constant Energy Saturated fat
Log Acculturation Constant 1104.5 0.0139 Constant 3.03 0.0000 Centered age Acculturation 858.1 0.0274 Physical activity level 0.1523 0.0994 Centered age2 Physical activity level −215.3 0.0039
Physical activity level
Age at migration R2 = 0.08 Signif. F = 0.0048 R2 = 0.02 Signif. F = 0.099
Education Family Income
Smoking Carbohydrates
Lactation Constant 7.215 0.0000 Pregnancy Centered age2 −0.0045 0.0755
Score basic
Score processed R2 = 0.02 Signif. F = 0.07
Score traditional Food stamps $
smaller magnitude, some of the variance in energy consumption. Acculturation was positively and significantly related to energy consumption. Physical activity level as well was significantly, but negatively, related to energy consumption. Upon further exploring the association of the socioeconomic, demographic and health-related variables and calories provided by total fat and saturated fat con-sumption, the full model did not explain significantly the variation in consump-tion of these nutrients. However, there is a trend that shows that saturated fat intake increases as the level of physical activity level rises. The R2 for this model indicates, however, that the magnitude of variance explained is very small. In summary, it seems that the more acculturated migrant women are, the more energy they consume. Having a higher BMI seems to be associated with the ex-posure to the new culture, as well as to lower levels of physical activity.
Although the data shows that energy consumption is negatively associated to BMI, when one separates the group of migrant women into women with BMI ≥ 30 and women with BMI < 30, the association of mean energy consumption and BMI behaves differently. Women with BMI < 30 showed a BMI that is negatively and significantly associated with energy consumption (p = 0.001). On the other hand, for women with BMI ≥ 30 the association is positive and significant (p = 0.041). If we look at the association of BMI with energy consumption, and ad-justing for physical activity, women with BMI < 30 continue to show a signifi-cant and negative association; meanwhile in women with a BMI ≥ 30 association is no longer significant (p = 0.07). These results could mean interplay of effects of physical activity on the association of energy consumption and BMI. In addi-tion, it seems that none of the socioeconomic, demographic, or cultural variables were associated with fat or saturated fat consumption. Fat consumption, howev-er, could be associated to some other health-related variables or lifestyle charac-teristics not explored in our models.
3.12. Predictors of Acculturation
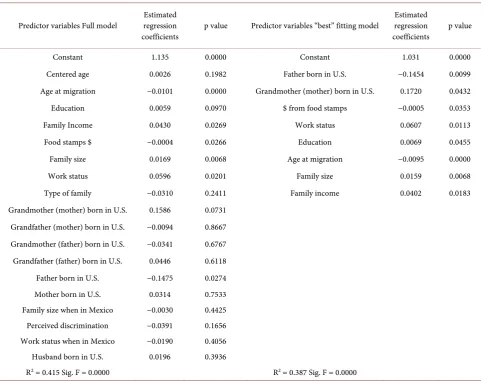
Table 7 presents the estimated regression coefficients and significance of pre-dictor variables for acculturation. The full model contains socioeconomic, de-mographic, family context, and a self-identity related variable (perceived dis-crimination). The full model explained 41% of the variation in acculturation and was highly significant. However, a careful interpretation of the R2 value should be done, since the model contained three variables with condition indexes higher than 30. The same variables that were significant in the full model became even more significant in the “best” fitting model. The proportion of variance ex-plained by this model was still of good magnitude (38%) and significant.
Table 7. Estimated regression coefficients and significance of predictor variables for Acculturation (log): Full and “best fitting” model.
Predictor variables Full model regression Estimated
coefficients p value Predictor variables “best” fitting model
Estimated regression
coefficients p value Constant 1.135 0.0000 Constant 1.031 0.0000 Centered age 0.0026 0.1982 Father born in U.S. −0.1454 0.0099 Age at migration −0.0101 0.0000 Grandmother (mother) born in U.S. 0.1720 0.0432 Education 0.0059 0.0970 $ from food stamps −0.0005 0.0353 Family Income 0.0430 0.0269 Work status 0.0607 0.0113 Food stamps $ −0.0004 0.0266 Education 0.0069 0.0455 Family size 0.0169 0.0068 Age at migration −0.0095 0.0000 Work status 0.0596 0.0201 Family size 0.0159 0.0068 Type of family −0.0310 0.2411 Family income 0.0402 0.0183 Grandmother (mother) born in U.S. 0.1586 0.0731
Grandfather (mother) born in U.S. −0.0094 0.8667 Grandmother (father) born in U.S. −0.0341 0.6767 Grandfather (father) born in U.S. 0.0446 0.6118 Father born in U.S. −0.1475 0.0274 Mother born in U.S. 0.0314 0.7533 Family size when in Mexico −0.0030 0.4425 Perceived discrimination −0.0391 0.1656 Work status when in Mexico −0.0190 0.4056 Husband born in U.S. 0.0196 0.3936
R2 = 0.415 Sig. F = 0.0000 R2 = 0.387 Sig. F = 0.0000
Also, if a mother works, education increases, the family has income, and they are likely to be more acculturated. Surely, these variables could have an impact on the magnitude of social interactions and consequently on the extent of exposure to the U.S. culture.
4. Discussion
asso-ciated with BMI in migrant women, for example physical activity level. This may indicate that in addition to diet, lifestyle characteristics of migrant women con-tribute to the differences found in BMI. This difference could well be related to a better economic situation of migrant families and consequently more access to often expensive foods such as beef.
Differences in dietary patterns among migrant and non-migrant women seem to be related to social and cultural ways within the host country. Even when lunch is still the main meal of the day, dinner could become the main meal for those women that follow the American meal pattern. This is true especially when they and their families follow a work schedule in the U.S. This cultural adapta-tion could have strong consequences for dietary change since women could end up consuming two elaborate meals instead of one.
These changes in meal patterns that affect nutrient consumption have been reported by Sanjur (1995) [33] among Hispanics in the U.S. and specifically in Mexican Americans. This author discusses that “although indigenous food ha-bits of any population group are deeply rooted in local environment as well as local culture, food habits constantly change and are influenced by many factors”.
In the context of dietary risk and protective factors, it is worth noting that di-etary change carries the presence of both components during the process of change. Increase in the consumption of basic foods, such as vegetables and fruit, could mean a positive change and a contribution to the presence of protective food components as vitamins, minerals, and fiber. On the other hand, increased consumption of foods with a high content of fat, sugar, and sodium, increases health risk factors. The presence of these components can be particularly noted in the higher consumption of whole milk, ice cream, instant soup, and canned fruit, whose consumption is reported as being increased by migrant women. Similar results have been reported by, Dewey et al., (1984), Romero et al., (1993), and Sanjur (1995) [31][32][33].
It is also important to highlight the continued consumption of beans and tor-tillas, whose supply of complex carbohydrates and fiber to Mexicans is well rec-ognized. These findings are consistent with the apparent similarities of meal patterns among migrants and non-migrants, the largest percentage of calories coming from carbohydrates, and with the high consumption of fiber among both groups. From our own participant observation study we learned that even after migration, Mexican American families continue to consume Mexican food at home. They find the food ingredients from grocery stores in Yuma County, or they bring the indigenous ingredients from the closest Mexican border town (San Luis, Mexico).
distal environment, and the family’s use of such resources, will vary as a result of that family’s decision-making and valuing process.” Information that the mother gets from the media, social institutions in the community, interpersonal rela-tionships, and from the members of her family, in addition to physical resources, can be utilized in different ways and can be transformed into specific behavior according to each type of family.
Overall, acculturation seems to be associated mostly with access to food rather than with change in consumption of dietary risk components. This is supported by the data relative to dietary change and from ethnographic fieldwork in the migrant community. Although there is an increase in consumption of processed foods and basic foods, traditional foods such as beans and tortillas are kept in the diets of migrant women. Informants reported having an increase in total consumption of foods after migration, while keeping their Mexican cooking customs. Finding ingredients was not a constraint to their dietary practices given the closeness to their home country and the frequent interaction with relatives in Mexico. Furthermore, acculturation was positively associated with socioeco-nomic status, indicating that interplay of socioecosocioeco-nomic and cultural variables is associated with food behavior in this group of Mexican immigrants. A study by Gregory-Mercado et al. (2006) [45], reported a negative association of fruit and vegetables (FV) intake and acculturation among older low socioeconomic status Mexican American women in Arizona; they also reported that persistent low FV intake increased BMI risk in this sample of Mexican-American women. These authors discussed, that socioeconomic status, as well as education, among other social and cultural variables, could modify the relationship of acculturation and dietary change among the Mexican American population; and stressed the need for studies that include dietary patterns, food availability, social structure, health concern, purchasing power, and food preparation responsibilities to make ade-quate inferences in this population.
On the other hand, several studies have reported contrasting results on the re-lationship of acculturation and BMI. Khan et al. (1997) [46] found that an in-creased use of English language (as a measure of acculturation) was associated with a decrease in BMI among Mexican American women. Their analysis, how-ever, included first, second and third generation Mexican Americans from the HHANES (1982-84) national study. Pérez-Escamilla (2011) [22] in a review of studies on acculturation, nutrition and health disparities of Latino populations in the U.S., reported that most of the reviewed studies found a positive relation-ship of acculturation and obesity; however, this author suggests that to reach appropriate conclusions on the cause-effect of this association, a comparison group of Latino-born population must be included, “since obesity rates change as a function of age and have increased across time in immigrant and native- born minority populations”. Pérez-Escamilla concludes that to better under-stand the effect of acculturation on health risks factors, “a cohort study should include a parallel group of the immigrant’s home Country”.
women in the sample were by design first generation Mexican immigrants ex-clusively; they represent a group that is located in the first part of the curve of acculturation and BMI. Moreover, we found that immigrant women had higher BMI than non-migrant women living in Mexico.
For this study sample, there is better access to food than there was in Mexico. It is, still, however, a low income population whose closeness to its country of origin, together with its primarily Mexican cultural heritage, allows it to keep, to a large extent, traditional food consumption patterns, while having better access to food in general. Their socioeconomic status, while low to U.S. standards, may still signify an improvement over what they previously had in Mexico.
5. Practical Implications
Some implications of the findings of this study for future sensitive and culturally appropriate nutritional interventions follow. There are subgroups of population living in the US region that based on their cultural heritage and socioeconomic characteristics should be thought of more as a native Mexican population than as a bicultural or acculturated population. The overall behavioral health and nu-trition promotion programs should continue encouraging to reduce smoking and alcohol consumption, as well as the consumption of fiber-rich traditional foods as part of good health practices. Physical exercise should be part of the same programs since the data from this study supports the association between physical activity level and BMI. Physical exercise should also be promoted since both groups of women expressed a desire to lose weight.
6. Study Limitations and Future Research
Some study limitations should be noted. Collection of data was performed in the mid-late nineties; however, published research data on the study matter is li-mited in such border region, as well as studies that include comparison data from migrant’s country of birth. Sampling locations in both study sites differ; in Yuma County the WIC clinic offered nutritional counseling and food aid to immigrant women, but in Hermosillo, Mexico, women attended a doctor’s ap-pointment which did not include any nutritional guidance.
Finally, it is recommended that in the same areas of the United States, the in-tergenerational food-related behavior should be studied. For research purposes, the collection and analysis of information within these groups living close to Mexico can improve understanding of food-related behavior and acculturation of future generations. For community-based studies, understanding dietary change and examining points for interventions that differ from those needed by first generation Mexican Americans will greatly improve the effectiveness of strategies for nutritional interventions.
Acknowledgements
research. This study has benefited from the financial support of CSRS/US De-partment of Agriculture Grant No. 94-34324-0987.
References
[1] Green, W.L. and Kreuter, M.W. (1991) Health Promotion Today and a Framework for Planning. In: Health Promotion Planning: An Educational and Environmental Approach, Mayfield Publishing Co. Mountain View, 1-31.
[2] Commission on Social Determinants of Health (CSDH) (2008) Closing the Gap in a Generation: Health Equity through Action on the Social Determinants of Health. Final Report of the Commission on Social Determinants of Health, World Health Organization, Geneva.
[3] González, V.M., González, J.T., Freeman, V. and Howard-Pitney, B. (1991) Health Promotion in Diverse Cultural Communities: Practical Guidelines for Working in and with Diverse Cultural Communities. Health Promotion Resource Center, Stan-ford Center for Research in Disease Prevention, Palo Alto, CA.
[4] Cyril, S., Smith, B.J., Possamai-Inesedy, A. and Renzaho, A.M.N. (2015) Exploring the Role of Community Engagement in Improving the Health of Disadvantaged Populations: A Systematic Review. Glob Health Action, 8, Article ID: 29842.
https://doi.org/10.3402/gha.v8.29842
[5] United States-Mexico Border Health Commission (2010) Healthy Border 2020: A Prevention & Health Promotion Initiative. El Paso, Texas, and Tijuana Mexico, 18-20.
[6] Willey, J.Z., Rodriguez, C.J., Park Moon, Y., Paik, M.C., Di Tullio, M.R., Homma, S., Sacco, R.L. and Elkind, M.S.V. (2012) Coronary Death and Myocardial Infarc-tion among Hispanics in the Northern Manhattan Study: Exploring the Hispanic Paradox.
[7] Siega-Riz A.M., Sotres-Alvarez, D., Ayala, G.X., Ginsberg, M., Himes, J.H., Liu, K., Loria, C.M., Mossavar-Rahmani, Y., Rock, C.L., Rodriguez, B., Gellman, M.D. and Van Horn, L. (2014) Food-Group and Nutrient-Density Intakes by Hispanic and Latino Backgrounds in the Hispanic Community Health Study/Study of Latinos. American Journal of Clinical Nutrition, 99, 1487-1498.
https://doi.org/10.3945/ajcn.113.082685
[8] Cortes-Bergoderi, M., Goel, K., Murad, M.H., Allison, T., Somers, V.K., Erwin, P.J., Sochor, O. and Lopez-Jimenez, F. (2013) Cardiovascular Mortality in Hispanics Compared to Non-Hispanic Whites: A Systematic Review and Meta-Analysis of the Hispanic Paradox. European Journal of Internal Medicine, 24, 791-799.
https://doi.org/10.1016/j.ejim.2013.09.003
[9] US Bureau (2010) https://www.census.gov/2010census/
[10] Brown, A. and López, M.H. (2013) Mapping the Latino Population, by State, Coun-ty and CiCoun-ty.
http://www.pewhispanic.org/2013/08/29/mapping-the-latino-population-by-state-c ounty-and-city
[11] Robinson, L. (1998) U.S. News and World Report.
[12] Roberts, B.R. (1995) Socially Expected Durations and the Economic Adjustment of Immigrants. In: Portes, A., Ed., The Economic Sociology of Immigration, Russel Sage Foundation, New York, 43.
1330-1344.
[14] Sobal, J. and Stunkard, A. (1989) Socioeconomic Status and Obesity: A Review of the Literature. Psychological Bulletin, 105, 260-275.
https://doi.org/10.1037/0033-2909.105.2.260
[15] Belcher, J.D., Ellison, R.C., Shepard, W.E., Bigelow, C., Webber, L.S., Wilmore, J.H., Parcell, G.S., Zucker, D.M. and Luepker, R.V. (1993) Lipid and Lipoprotein Distri-butions in Children by Ethnic Group, Gender, and Geographic Location: Prelimi-nary Findings of the Child and Adolescent Trial for Cardiovascular Health (CATCH). Preventive Medicine, 22, 143-153.
https://doi.org/10.1006/pmed.1993.1012
[16] Kumanyika, S.K. and Golden, P.M. (1991) Cross-Sectional Differences in Health Status in US Racial/Ethnic Minority Groups: Potential Influence of Temporal Changes, Disease, and Life-Style Transitions. Ethnicity & Disease, 1, 50-59.
[17] Maurer, K.R., Everhart, J.E., Ezzati, T.M., Johannes, R.S., Knowler, W.C., Larson, D.L. and Roth, H.P. (1989) Prevalence of Gallstone Disease in Hispanic Populations in the United States. Gastroenterology, 96, 487-492.
https://doi.org/10.1016/0016-5085(89)91575-8
[18] Samet, J.M., Coultas, D.B., Howard, C.A., Skipper, B.J. and Hanis, C.L. (1988) Di-abetes, Gallbladder Disease, Obesity, and Hypertension among Hispanics in New Mexico. American Journal of Epidemiology, 128, 1302-1311.
https://doi.org/10.1093/oxfordjournals.aje.a115083
[19] Hanis, C.L., Ferrel, R.E., Barton, S.A., Aguilar, L., Garza-Ibarra, A., Tulloch, B.R., Garcia, C.A. and Schull, W.J. (1983) Diabetes among Mexican Americans in Starr County, Texas. American Journal of Epidemiology, 118, 659-672.
https://doi.org/10.1093/oxfordjournals.aje.a113677
[20] Stern, M.P., Gaskill, S.P., Allen, C.L., Garza, V., González, J.L. and Waldrop, R.H. (1981) Cardiovascular Risk Factors in Mexican Americans in Laredo, Texas. Preva-lence of Overweight and Diabetes and Distributions of Serum Lipids. American Journal of Epidemiology, 113, 546-555.
https://doi.org/10.1093/oxfordjournals.aje.a113131
[21] Liao, Y., Cooper, R.S., Cao, G., Kaufman, J.S., Long, A.E. and McGee, D.L. (1997) Mortality from Coronary Heart Disease and Cardiovascular Disease among Adult US Hispanics: Findings from the National Health Interview Survey (1986 to 1994). Journal of the American College of Cardiology, 30, 1200-1205.
https://doi.org/10.1016/S0735-1097(97)00278-7
[22] Pérez-Escamilla, R. (2011) Acculturation, Nutrition, and Health Disparities in Lati-nos. American Journal of Clinical Nutrition, 93, 1163S-1167S.
https://doi.org/10.3945/ajcn.110.003467
[23] Kim, Y.Y. (1991) Communication and Cross-Cultural Adaptation. In: Samovar, L.A. and Porter, R.E., Eds., Intercultural Communication, Wadsworth Publishing, Co., Belmont, CA, 383-390.
[24] Pelto, G.H. (1981) Anthropological Contributions to Nutrition Education Research. Journal of Nutrition Education, 13, s2-s8.
https://doi.org/10.1016/S0022-3182(81)80003-9
[25] Sims, L.S., Paolucci, B. and Morris, P.M. (1972) A Theoretical Model for the Study of Nutritional Status: An Ecosystem Approach. Ecology of Food and Nutrition, 1, 197-205. https://doi.org/10.1080/03670244.1972.9990290
150.
[27] Conway, J.M., Ingwersen, L.A., Vinyard, B.T. and Moshfegh, A.J. (2003) Effective-ness of the US Department of Agriculture 5-Step Multiple-Pass Method in Assess-ing Food Intake in Obese and Nonobese Women. The American Journal of Clinical Nutrition, 77, 1171-1178.
[28] Geghardt, S.E. and Matthews, R.H. (1981) Nutritive Value of Foods. USDA. Vol. 72, Home and Garden Bulletin, Washington DC, 1-72.
[29] Hernández, M., Chávez, A. and Bourges, H. (1980) Nutritive Value of Mexican Foods. Practical Guidance Tables. 8th Edition, Nutrition Division Publications of National Institute of Nutrition, Mexico, 6-31.
[30] Grijalva, M.I., Caire, G., Sánchez, A. and Valencia, M.E. (1995) Chemical Composi-tion, Dietary Fiber and Mineral Content of Frequently Consumed Foods in North-west Mexico. Archivos Latinoamericanos de Nutrición, 45, 145-150.
[31] Dewey, K.G., Strode, M.A. and Ruiz, Y. (1984) Dietary Change among Migrant and Non-Migrant Mexican-American Families in Northern California. Ecology of Food and Nutrition, 14, 11-24.
[32] Romero-Gwynn, E., Gwynn, D., Grivetti, L., McDonald, R., Stanford, G., Turner, B., West, E. and Williamson, E. (1993) Dietary Acculturation among Latinos of Mex-ican Descent. Nutrition Today, 6-12.
https://doi.org/10.1097/00017285-199307000-00003
[33] Sanjur, D. (1995) Mexican-American Diets and Nutrient Intake. In: Hispanics Foodways Nutrition and Health, Prentice Hall Inc., 36-43, Englewood Cliffs, NJ, 64-107.
[34] Cameron, N. (1986) The Methods of Auxological Anthropometry in Human Growth. In: Falkner, F. and Tanner, J.M., Eds., Methodology, Ecological, Genetic, and Nutritional Effects on Growth, Vol. 3, Plenum Press, New York, 16-18, 26-28. [35] Kissebah, A.H. and Krakower, G.R. (1994) Regional Adiposity and Morbidity.
Phy-siological Reviews, 74, 761-812.
[36] World Health Organization (1995) Expert Committee on Physical Status: The Use and Interpretation of Anthropometry. Report of a WHO Expert Committee, WHO Technical Report Series, 854, Geneva.
[37] World Health Organization (2008) Waist Circumference and Waist-Hip Ratio. Re-port of WHO Expert Consultation, Geneva, 8-11.
[38] Cuellar, I., Harris, L.C. and Jasso, R. (1980) An Acculturation Scale for Mexican American Normal and Clinical Populations. Hispanic Journal of Behavioral Sciences, 2, 199-217.
[39] Krause, N. and Goldenhar, L.M. (1992) Acculturation and Psychological Distress in Three Groups of Elderly Hispanics. Journal of Gerontology: Social Sciences, 47, s279-s288. https://doi.org/10.1093/geronj/47.6.s279
[40] Patton, M.Q. (1990) Qualitative Evaluation and Research Methods. 2nd Ed., Sage Publications, Inc. Newbury Park, California, 91320, 67-68, 88, 136, 153, 215, 241, 425.
[41] SAS Software. Copyright © (1997) SAS Institute Inc. SAS and All Other SAS Insti-tute Inc. Product or Service Names Are Registered Trademarks or Trademarks of SAS Institute Inc., Cary, NC, USA.
[42] SPSS Inc., Released 2005. Statistics for Windows, Version 14.0. SPSS Inc., Chicago. [43] Carmines, G.E. and Zeller, R.A. (1979) Assessing Reliability. In: Reliability and
https://doi.org/10.4135/9781412985642.n4
[44] Storey, M. and Anderson, P. (2014) Income and Race/Ethnicity Influence Dietary Fiber Intake and Vegetable Consumption. Nutrition Research, 34, 844-850.
https://doi.org/10.1016/j.nutres.2014.08.016
[45] Gregory-Mercado, K.Y., Staten, L.K., Ranger-Moore, J., Thomson, C.A., Will, J.C., Ford, E.S., Guillen, J., Larkey, L.K., Giuliano, A.R. and Marshall, J. (2006) Fruit and Vegetable Consumption of Older Mexican-American Women Is Associated with Their Acculturation Level. Ethnicity & Disease, 16, 89-95.
Appendix A
QUESTIONNAIRES
INTERVIEWER___________ CODE____________ DATE____________
SOCIODEMOGRAPHICS
1. How many persons are now living in your house? Circle: 1 2 3 4 5 6 7 8 9 10 11 12 13 14 15+ 2. Household composition
NAME SEX AGE OCCUPATION COUNTRY OF BIRTH CITY, STATE, AND
24-HOUR RECALL QUESTIONNAIRE
24-Hour Recall
NAME: __________________
Hour Food description Where Preparation Food Portion Consumed Grams Code
1. Do you usually eat like this? Yes: ____ No: ____
2. Why? _________________________________________________________
3. Are you taking any supplement or vitamin? Yes: ____ No: ____
4. Type _________________________________________________________
5. How often do you take it? Daily ____ Weekly____ Rarely ____
6. Are you on a special diet? No____ Weight loss ____ Low salt ____
Medical condition ______ Vegetarian______
Low Cholesterol______ Weight gain_______
ANTHROPOMETRIC MEASURES
MEASURES MOTHER CHILD HEIGHT
TRICIPITAL SKINFOLD SUBSCAPULAR SKINFOLD
WAIST CIRCUMFERENCE HIP CIRCUMFERENCE
BLOOD PRESSURE BIRTHDATE
7. Are you pregnant? ______________ 1. Yes______ 2. No______
8. Are you breastfeeding? ___________ 1. Yes_____ 2. No______
FOOD FREQUENCY QUESTIONNAIRE
FOOD FREQUENCY QUESTIONNAIRE
MEDIUM
SERVING SERVING SIZE HOW OFTEN? CODE FRUITS S M L D W M Y R
1. Apples 1 medium 2. Pears 1 medium 3. Bananas 1 medium 4. Peaches,
nectarines
(C,F,D) 1 medium 5. Cantaloupe (in
season) ¼ medium 6. etc…
This questionnaire included 125 food items categorized into: FRUITS; VEGETABLES; MEAT, MIXED DISHES, LUNCH ITEMS; BREADS/SALTY SNACKS/SPREADS; SWEETS; DAIRY PRODUCTS; BEVERAGES.
Note: This questionnaire will be available by the authors upon request.
ACCULTURATION
9. Which language do you prefer to use in daily life?
___1.Spanish all the time
___2.Spanish mostly
___3.Spanish/English equally
___4.English mostly
10. What language do you speak:
At home Work/school W/friends 1. Spanish all the time
2. Spanish mostly 3. Spanish/English equally 4. English mostly 5. English all the time
11. In what language are:
T.V. programs Radio stations Books/ magazines 1. Spanish all the time
2. Spanish mostly 3. Spanish/English equally 4. English mostly 5. English all the time
12. Can you read Spanish? ___1.Yes ____2.No 13. Can you read English? ___1.Yes ____2.No 14. Which do you read better?
___1.Spanish better than English
___2.Spanish and English equally
___3.English better than Spanish
15. Can you write in English? ___1.Yes ___2. No 16. Can you write in Spanish ___1.Yes ___2. No 17. Which do you write better?
___1. Spanish better than English
___2. Spanish and English equally
___3. English better than Spanish
18. In which country were you and relatives born?
Mexico U.S. State Other Respondent
19. How do you identify yourself?
___1. Mexican or Mexicano ___5. Latino
___2. Chicano ___6. Spanish American
___3. Mexican American ___7. American ___4. American of Mexican descent
20. If you were born in Mexico, at what age moved permanently to U.S.?
________________yrs.
21. Are your friends mostly of Mexican or American descent?
___1.Only Mexican ___4.Mostly American
___2.Mostly Mexican ___5.Only American
___3.Equally Mexican and American
22. Are your neighbors mostly of Mexican or American descent?
___1.Only Mexican ___4.Mostly American
___2.Mostly Mexican ___5.Only American
___3.Equally Mexican and American
23. Are the people at the places where you go to have fun and to relax (at par-ties, dances, picnics) mostly Mexican or American?
___1.Only Mexican ___4.Mostly American
___2.Mostly Mexican ___5.Only American
___3.Equally Mexican and American
24. What do you think about the following American institutions?
Public schools____________________________________________ Why?___________________________________________________
Religion_________________________________________________ Why?___________________________________________________
Family__________________________________________________ Why?___________________________________________________
25. Have you ever been discriminated against because you are of Mexican
descent? Yes___ No___
26. In what ways have you been discriminated against?
________________________________________________________________
DIETARY CHANGE AND FOOD PREPARATION
28. Why did you change?___________________________________________
29. Which of these methods do you usually use to cook foods? Frying ____ Boiling____ Grilling____ Baking ____
30. If frying, what kind of fat do you use?
Lard ____ Margarine____ Vegetable oil____ Butter____ Beef lard____ Vegetable lard____
O_______________
31. How often do you...?
Often/Always Sometimes Seldom/Never Remove the skin from chicken
Trim the fat off your meat Eat eggs
Use salad dressings/mayonnaise Drink whole milk Eat cream/sour cream
Add sugar to cereal Eat Ice cream
Eat pies Eat pastries Add sugar to coffee
Drink soda pop Use canned foods Add salt to foods when cooking
Add salt to foods at the table Eat lunch meats/frankfurters Eat Commercial french fries
Eat Chinesse foods
32. If you trim the fat off your meat or remove the skin from chicken, what is the reason?
__________________________________________________________________
Food More Less Same Never tried Basic
Beef Pork Chicken
Milk Eggs Cheese
Fruits Vegetables
Pasta Rice Oil Traditional
Beans Tortilla
Chili Lard Sweet bread
“Licuados” Lemonade “Nopales” “Chorizo” “Chicharrón”
“Tamales” Stuffed peppers
New Breakfast cereals Canned Vegetables
Canned meat (Spam) Turkey
Soda Ice cream Chips (snack)
Jello
Comments_______________________________________________________
MIGRATION HISTORY AND SOCIOECONOMIC INFORMATION
34. What year did you first come to the U.S.?______________________
35. Have you:
___1. Stayed in the U.S. since then
___2. Moved back to Mexico for a while and then returned to the U.S.
36. Why did you come to U.S.?____________________________________
37. How many family members were in your family when you were in Mex-ico?
Circle: 1 2 3 4 5 6 7 8 9 10 11 12 13 14 +15
38. Did you work in Mexico? ___1.Yes ___2.No
39. What was your last job there?_______________________________
40. Do you work now? ___1.Yes ___2.No
41. What kind of work do you do?_________________________________ __________________________________________________________________
42. In what range is your family weekly income? ___1. 100 - 200 dlls. ___3. 401 - 600 dlls ___2. 201 - 400 dlls. ___4. +600 dlls
43. What other jobs have you had, and where?__________________________
44. What is your highest grade you completed at school? Circle: 1 2 3 4 5 6 7 8 9 10 11 12 13 14 15+
45. Was it in: ___1. Mexico ___2. U.S.
LIFESTYLE
46. Have you smoked at least 100 cigarettes in your entire life?
Yes___ No___
47. If yes in number 46: about how old were you when you first started smok-ing cigarettes fairly regularly?_____________________
48. On the average of the entire time you smoked, how many cigarettes did you smoke per day?__________________
49. Do you smoke cigarettes now? Yes___ No___
50. If not: How old were you when you stopped smoking? _______yrs.
51. If yes: On the average, about how many cigarettes a day do you smoke now? _________ cigarettes
52. Do you exercise regularly? Yes___ No___
53. If yes: What kind of exercise?
________________________________________________________________
54. If not, why not?
________________________________________________________________
55. Which are your usual activities in a normal day? ___1. Light housework ___4. Walking ___2. Medium housework ___5. Aerobics
___3. Heavy housework ___6. Agricultural work
56. Do you think your current weight is:
___1. Too high ___2. Too low ___3. About right
57. Would you like to:
___1. Gain weight ___2. Lose weight ___3. Stay the same
58. When was the last time you saw a doctor?
________________________________________________________________
59. Which was the reason(s) to see the doctor?
_______________________________________________________________
60. Do you have medical insurance? Yes___ No___
61. If yes: What type?
STRESS
62. Is not having enough money to live a serious problem?
Yes___ No___
63. Are medical bills a serious problem for you/your family?
Yes___ No___
64. During the past two weeks, did you get together socially (including eating) with friends and neighbors?
Yes___ No___
65. Have you talked with or received any news/letters from relatives in Mexico in the last month?
Yes___ No___
66. Have you argued seriously with your children recently?
Yes___ No___
67. Are you frequently worried about your children’s behavior?
Yes___ No___
68. In the past few weeks, have you felt depressed and very unhappy?
Yes___ No___
69. Is being anxious and worried a serious problem?
Yes___ No___
70. In the last few weeks, have you felt that things were going your way? Yes___ No___
Comments: ____________________________________________________
EATING OUT
71. How often do you eat out?
HOUSEHOLD
MEMBERS B L D S WHERE HOW OFTEN? D W M R HOMEMAKER
B: Breakfast D: Dinner D: Daily M: Monthly L: Lunch S: Snack W: Weekly R: Rarely
72. Weekly mean Expenses when eating out _____________________ dlls.
73. Reason (s) for eating out: _______________________________________
FOOD PURCHASING
74. Where do you usually buy your food/groceries? ______________________ ________________________________________________________________
75. Why do you buy there?
___1. Inexpensive ___4. Quality of foods
___2. Closer ___5. Variety
___3. Convenient ___6. Other_________________
76. What foods do you almost always buy? _____________________________ ________________________________________________________________ ________________________________________________________________
77. Have you changed the foods you buy in the last year? Yes___ No____ Or five years? Yes___ No____
78. In what way have you changed?__________________________________
79. Are you eligible for food stamps Yes___ No___
80. Do you get and use food stamps? Yes___ No___
81. How much do you receive in food stamps?__________ dlls/week
FOOD PREFERENCES
82. Could you tell me how much do you and your child like the following foods?
FOOD MOTHER CHILD
VL L N D VD VL L N D VD 1. Cheese
14. Spam 15. Soda 16. Hamburguers 17. Hot dogs 18. Hot salsa 19. Tacos 20. Tortilla
83. Which are you and your child’s five favorite, most disliked, and never tasted foods?
Subject 5 favorite foods 5 most disliked foods 5 never tasted foods Mother
1 2 etc. Child
1 2 etc.
84. Does your child speak English? ___Yes ___No
85. What programs does he/she watch on T.V. _______________________
86. Are your child’s friends from Mexican or American descent?
___1.Only Mexican ___4.Mostly American
___2.Mostly Mexican ___5.Only American
___3.Equally Mexican and American
Submit or recommend next manuscript to SCIRP and we will provide best service for you:
Accepting pre-submission inquiries through Email, Facebook, LinkedIn, Twitter, etc. A wide selection of journals (inclusive of 9 subjects, more than 200 journals)
Providing 24-hour high-quality service User-friendly online submission system Fair and swift peer-review system
Efficient typesetting and proofreading procedure
Display of the result of downloads and visits, as well as the number of cited articles Maximum dissemination of your research work