Munich Personal RePEc Archive
The puzzle of corporate control
Alves, Paulo
2012
Online at
https://mpra.ub.uni-muenchen.de/52113/
1
Paulo Alves
pauloalves@cmvm.pt
CMVM, ISCAL and Lusofona University
2
Abstract
In this research paper the main forces that influence different kinds of corporate control of the
largest firms by country are evaluated. Firms controlled by individuals, Government,
miscellaneous investors or widely held, exist under different circumstances. While firms
controlled by individuals are small, proliferate on civil-law based countries with low levels of
economic freedom, firms controlled by Governments multiply under low standards of
disclosure, undeveloped financial markets and non catholic environments. On the other hand,
the presence of miscellaneous investors is more frequent when stocks are glamorous and small
wherein the smaller shareholder can easily use their limited resources and monitoring the
management/larger shareholder. Finally, widely held firms are large and are stimulated by an
economic freedom behavior.
Keywords
Corporate control
Ultimate owner
Institutional Environment
Widely Held
JEL classification
3
1. Introduction
Corporate ownership of the US firms has been characterized as widely held by small
shareholders, since the seminal work of Berle and Means (1932), where the management plays
an important role in the control of the firm. This can be explained by several reasons related
with the legal system and the responsibility of the State on the economy. However, not even all
countries have the same legal system, the same interventionism of the Government on the
economy, the same financial infrastructures, the same standards of transparency, the same
economic history, and consequently the corporate ownership and the characteristics of
shareholders are diffused around the world. The role of economic history is clearly relevant to
understand corporate control, for example the Nordic countries historically use dual class
shares, in Spain, Italy and Austria the mutualism has been protagonist along their history, in
Turkey and Chile the State protected families and in Denmark foundations plays a decisive role
in the control of firms. These evidences can´t be ignored to understand how corporate
ownership is so different around the world. For example, according to the results of Becht and
Roell (1999) the degree of ownership concentration in the UK and in the USA is smaller than
in Continental Europe. Faccio and Lang (2002), based on a sample of Western European firms,
present similar results, that is, there is a large number of widely held firms in the UK and
Ireland, in comparison to continental Europe. They show that smallest firms and industrial
firms are more family-owned than financial institutions, and in some countries the State plays a
decisive role in the largest firms. Claessens et al (2000), using a sample of 2,980 East Asian
companies from 9 countries, show how firms from that region are largely family-owned, as
4 However, the debate over corporate ownership and the importance of the legal system and
other country infrastructures is far from ending. While La Porta et al (1999) confirm the idea
that in countries with higher antidirector rights, namely in the US, wherein investors are well
protected, the corporate ownership is widely held, on the contrary, countries with low
shareholder protection, wherein the State interferes in private business, the largest firms are
more family-owned, the voting rights are separate from the cash flow rights, namely through
multiple classes of stock, cross-shareholdings, and pyramidal structures, and the ownership is
less diffused. More recently this assumption has been refused. Holderness (2009), based on a
sample of 23 countries, refutes the idea that corporate ownership in US firms is more diffused
than in other countries. His research documents that 96% of the US firms from their sample
have blockholders with at least 5% of firm’s voting rights. His result contradicts the assumption
that the stronger US investor protection rights account for the widely held ownership of US
firms. But the debate concerning corporate ownership around the world is not limited to
evaluate how concentrated shareholders structures are around the world. For example, La Porta
et al (1999) analyzing the ultimate firm owners, based on voting rights, assess whether those
depend on the characteristics of the legal system in 27 countries. Basically they define six types
of ultimate owners: widely held, family, State, widely held Financial, widely held corporation
and miscellaneous. In this research paper it will be analyzed, considering different ultimate
owners – mixed, individuals, Government and widely held -, based on voting rights, which
variables influence the most each kind of ultimate owner.
In this research paper we pretend to evaluate which variables, firm or country specific,
determine the ultimate ownership. Questions like firms being controlled by individuals on
undeveloped financial markets or firms controlled by the Government subsisting on Catholic
5 This paper proceeds as follows. Section 2 describes the data and the methodology;. Section 3
presents the results for the definitions, for the variables and for the regressions. Section 4
concludes.
2. Data and methodology
2.1.Data
The data extracted from Factset/Lionshres database includes the ultimate owners of the largest
firms 20 firms from 31 countries obtained from Worldscope database (Worldscope item,
WC08001) and respects to the end 2005, more precisely to the period between 2005 and March
2006, depending on the information supplied by firms. These data were compared with those
obtained from different 620 firm´s websites. We selected firms from the following countries:
Australia, Austria, Belgium, Canada, Chile, Denmark, Finland, France, Germany, Greece,
Hong Kong, India, Ireland, Italy, Japan, Malaysia, the Netherlands, New Zealand, Norway,
Portugal, Singapore, South Africa, South Korea, Spain, Sweden, Switzerland, Taiwan,
Thailand, Turkey, the UK, and the US.
2.2. Methodology
2.2.1. Definitions of Variables
2.2.1.1. Dependent variables
While voting rights determine corporate control, cash flow rights are used to evaluate corporate
ownership. It is important to distinguish both concepts because they usually present different
results, particularly when the shareholdings are based on pyramidal structures, a way wherein
large shareholders obtain control with the least amount of capital. For example, if investor A
holds 5% of the shares of firm X, and simultaneously 20% of shares of the firm Y, which in its
6 rights and controls 15% of voting rights (min(10%,20%)+5%). Moreover, differences between
voting rights and cash flow rights are particularly sensitive to dual class voting shares. For
example, Berkshire Hathaway Inc., the US holding company managed by Warren Buffet, has
two classes of common stock, Class A and Class B. A share of Class B common stock has the
rights of 1/30th of a share of Class A common stock except that a Class B share has 1/200th of
the voting rights of a Class A share (rather than 1/30th of the vote). Considering that Berkshire
Hathaway Inc. has issued 1,261 million and 8,407 million Class A and B shares respectively,
we conclude that the 0,498 million Class A shares owned by Warren Buffet represent 32% of
cash flow rights and 38% of voting rights.
In this research, we do not consider some mechanisms used by firms to impede takeovers such
as voting caps, golden shares, and voting blocks. We have collected only ultimate owners that
own more than 5% of voting rights of a firm. We define a threshold of 20%, that means if the
sum of ultimate owners with more than 5% of voting rights does not exceed a threshold of
20%, we define the corporate ownership of that firm as widely held. These figures are in line
with recent research, for example, Holderness (2009) and La Porta et al (1999) who chose 5%,
10%, and 20%, respectively. The blockholder percentage of voting rights takes into account the
American Depositary Receipts (ADRs) stakes. There are few examples of shareholders in
possession of a qualified participation as a result of a simultaneous investment in common
stocks and ADRs.
We define the following ultimate owners:
Widely Held – a firm without any ultimate owner is defined as widely held, that is,
when there is no ultimate owner with more than 5% of total voting rights. Such is the
case of Banco Santander Central Hispano, the largest Spanish bank;
Individual - when a given person (or a group of given people) is the sole shareholder
7 individually controlled. For example, Great West Lifeco, a Canadian insurance
company, is owned by Power Financial Corp (74.9% of total voting rights). Power
Financial Corp, in turn, is owned by Sir Paul Desmarais (66.4% of total voting rights).
Thus, we can say that Sir Paul Desmarais has 66.4% of total voting rights of Great West
Lifeco. In these cases we are in the presence of a pyramidal structure. The use of this
type of strategy has been analyzed and criticized because it is an interesting way for the
large shareholders, particularly families, to maintain control of a firm and
simultaneously to expropriate private benefits from minority shareholders (see Almeida
and Wolfenzon (2006));
Government - when a State is the sole shareholder that controls a significant percentage
of voting rights, a firm is Government owned. For example, Hafslund ASA, a
Norwegian electric utility, has two shareholders who own more than 5% of voting
rights. One is Oslo Kommune, a Norwegian Government institution with 58.5% of total
voting rights, the other is Fortum Oyj, a Finnish public company with 32.8% of total
voting rights, whose main shareholder (with more than 5% of voting rights) is the
Finnish Government with 51.5% of voting rights. Thus, Finnish Government controls
32.8% of total voting rights of Hafslund ASA;
Miscellaneous – whenever a structure differed from the previous, we define it as mixed.
It is possible to observe such structures when a company is dominated by a number of
different financial institutions. For example, Fosters Group, an Australian beverages
firm, has the following shareholders with more than 5% of voting rights: Mondrian
Investment Partners Ltd with 7.3% (Investment Advisor); Capital Research &
Management Co with 7.2% (Investment Advisor); Colonial First State Investments Ltd
with 6.1% of voting rights (Bank Management Division); and, Maple-Brown Abbot Ltd
8 institutions that own more than 20% of voting rights. But also when the main ultimate
owners belong to different business areas. For example, PT Telekomunikasi Indonesia,
a telecommunications company in Indonesia, is controlled by the government (51.2% of
total voting rights), although Capital Research & Management Co also owns 8.8% of
total voting rights.
2.2.1.2. Independent variables
To determine which variables influence the most kind of corporate control firm-level
variables and country-level variables are assessed (see tables I and II):
Firm level variables
Size – We expect a negative relationship between firm size and fraction of corporate
control, ceteris paribus. Wealth constraints, in addition to risk aversion imply that an
ultimate owner is less able to accomplish as a firm becomes larger (Demsetz and Lehn
(1985), Prowse (1992) and Holderness (2009)). We use the (natural logarithm) market
capitalisation, dollar denominated, to control the size of a firm (Worldscope Item,
WC07211);
Volatility - A firm with more volatile profit rate is more difficult to monitor and to
control, and as a result the level of ownership concentration is expectably higher, in
order to avoid eventual abuses by management. The results obtained by Prowse (1992)
for the Japanese market confirm the previous relationship for independent firms, but not
for keiretsu firms. In fact, not even the expected relationship is found. While Demsetz
and Lehn (1985) find a positive relationship, Himmelberg et al (1999) document a
negative relationship. Datastream (DS) weekly prices, dollar denominated, were used to
calculate the annualised standard deviation of weekly stock market rates of return
9
Market-to-Book - This variable is seen as a proxy for the growth opportunities of a firm.
We presume that a firm with more growth opportunities, and also with more doubts by
investors, would develop easily in a developed capital market. Kahn and Winton (1998)
and Goergen (1998), show in theoretical and empirical terms respectively, that the
ownership retention by the initial shareholders will be lower, after an IPO, on firms
characterised by growth opportunities with need of external finance. Market-to-book is
defined as total assets (Worldscope Item, WC 02999) minus book equity - defined as
total assets minus total liabilities (WC 03351) and preferred stock (WC 03451) plus
deferred taxes (WC 03263) and convertible debt (WC 18282) - plus market
capitalisation (WC 08001), local currency denominated, divided by total assets.
Country level variables
Legal Environment – Legal country origin is a measure of legal environment. Country
origin is divided in the two main important legal families, common and civil law
origins. Civil law origins, on the other hand, produced three variants of law: French,
German, and Scandinavian legal environment. La Porta et al (1997, 1998) find a
positive relationship between common law-based countries and capital markets
development, based on accounting standards, shareholders’ rights and creditors’ rights
present higher standards. However, this evidence has been denied by recent research
that found non time series evidence (Rajan and Zingales (2003)). A positive relationship
between diffuse corporate ownership structures and common law-based countries is
expected, particularly when management and shareholder are agent and principal,
respectively (see La Porta et al (1999));
Corporate Disclosure – We expect that more diffused ownership structures to prevail in
countries where accounting and financial disclosure presents higher standards (La Porta
10 shareholders decisions) and consequently to avoid the expropriation of wealth from
minority shareholders. However, that relationship must be taken with caution. For
example, Guedhami and Pittman (2006), for a group of privatised firms from 31
countries, found weak evidence between ownership concentration and disclosure
standards. Disclosure level1 is from Bhattacharya et al (2003) and the original source is
the Center for International Financial Analysis and Research (CIFAR);
Private credit – We expect more concentrated corporate ownership structures under an
environment where financial system is comparatively more developed than the local
capital market. Shareholders in these cases presumably resist to undertake public offers
and to share control with others. Private credit is provided by World Bank measured by
banking sector % of GDP;
Religion - Local beliefs produce impacts on different areas of economy. Weber (1905)
in his distinguished book, “The Protestant Ethic and the Spirit of Capitalism”, found
that Protestantism, particularly Calvinism, was a means of explaining capitalism. In the
Renaissance period, contrary to Catholic religion which defended a fairly luxurious way
of life, a group of reformists emerged in the 16th century, namely Martin Luther and
John Calvin belonging to the Catholic church and who started a religious movement,
later designated as the Protestant Reformation. Protestants defended that hard work led
to prosperity and a life without luxury. This asceticism resulted in an accumulation of
capital, which inspired the beginning of capitalism;
Economic Freedom – We expect more diffused corporate control structures under an
environment of business freedom, financial freedom and freedom from corruption. We
use the index of economic freedom from Heritage Foundation.
11
2.2.2. Multivariate Regressions
A Logit regression model is used to examine the relationship between the probability of a
firm's with a specific ultimate owner switch to another one, conditional on a vector of
explanatory independent X. The dependent variable is 1 for a given class of ultimate owner
and 0 for the remaining. This relationship can be expressed as following where
{ | }
( )
The β′ is the parameter estimated from the sample data for each independent variable and X
represents the explanatory variables, including market capitalization, market-to book,
volatility, legal system, disclosure level, private credit, economic freedom and religion.
3. Results
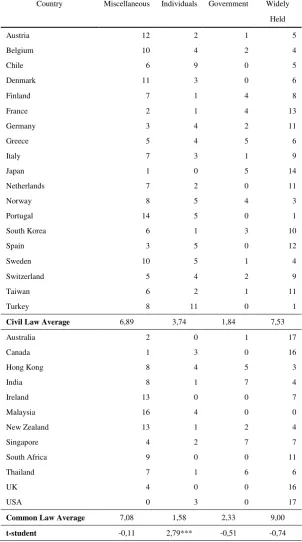
Table III identifies the number of firms by country, considering the different categories of
ultimate owners. The results, comparing countries with common and civil legal regimes,
show that only exist differences statistically significant when we are in the presence of
firms controlled by individuals. On average, there are 3.74 and 1.58 firms owned by
individuals on Civil and Common law based countries (t-stat = 2.79). In this case we are in
the presence of a conflict of interest between minority shareholders and a larger block
shareholder that simultaneously controls management which tries to expropriate wealth
from minority shareholders (vd.for example Bebchuk (1999)). But the legal system can´t be
the panacea for this problem. For example, the economic history of each country must not
12 In fact, the role of individuals is particularly expressive in emerging countries namely in
Chile and Turkey. These economies have suffered recently due to profound changes. In
Chile, old families (Angelini, Matte and Luksic) that grew during the 20th century based on
the policy of import substitution, which ended with the trade liberalization carried out
during 1974-1979, changed from declining manufacturing industries to natural resource
processing sectors. These groups, contrary to the techniques used in other countries, namely
in Asia, of cross shareholdings, prohibited by Chilean law, adopted practices based on
pyramidal structures. In Turkey, an economy predominantly agricultural country inherited
from the Ottoman empire, there are many individuals (for example, Dogan, Koç and
Sabanci families) that created truly giant business groups during the previous century,
particularly after the 60s, period in which the State not also had a decisive weight in the
economy but has allocated resources to the private sector. As Chilean families the Turkish
used pyramidal structures to control their businesses. In Sweden, a Social democratic
country, the Government has adopted measures, the legalization of dual class shares, to
defend employment, sometimes contrarily to the idea of profit maximization. That was the
reason why some individuals, namely the old Wallenberg family, control many important
firms. In Portugal and Spain, on the other hand, the transition to democracy during the 70s
and the development of their capital markets gave rise to major economic groups with
family characteristics.
Even when we compare the importance of Governments on the control of firms,
considering different legal regimes, we observe the importance of the economic history.
The results presented in table III do not show any statistical difference between the number
of firms controlled by Government in countries with different legal regimes (t-stat = -0.51).
There are 1.84 and 2.33 firms, on average, controlled by Governments respectively in Civil
13 change to 1.84 and 0.43 with 5% statistical significance (t- stat = 2.77). It seems that the
interference of the Government on economy is not similar in all Common law based
countries.
In fact, the most common is the largest companies being controlled by managers (widely
held), or, alternatively, said control is carried out by shareholders with different
characteristics (miscellaneous, as we defined in section 2.1.1.), but for different reasons.
The correlation coefficient between the number of firms widely held by country and the
median market capitalization is 0.64. Thus, when we are in the presence of countries whose
firms are large (Australia, Canada, France, Germany, Japan, the UK and the USA (vd.
Table I) the control is exercised by managers, firms are widely held, and there are conflict
of interests between managers and shareholders. The simple explanation to understand the
reasons why a firm is widely held can´t be extended when we are in face of miscellaneous
ultimate owners. Firstly because there is a correlation of -0.57 between the market
capitalization of the companies and the number of companies owned by diverse
shareholders. In fact, this type of corporate ownership exists in small capital markets –
Austria, Belgium, Denmark, Portugal, Sweden, Ireland, Malaysia, and New Zealand –
where companies, in general, present a small market capitalization. However, the structure
of corporate ownership is not the same in those countries. While Austrian and Malaysian
firms are owned by the Government in parallel with other shareholders, in Denmark the
foundations have an important role in the corporate ownership, in Portugal firms are owned
by different categories of shareholders (private firms, holdings, financial intermediaries,
and Government) and in Ireland and in New Zealand there are many financial
14 Table IV shows the explanatory factors of different corporate structures, i.e., variables that
influence firms owned by individuals, by the Government, by different categories of
shareholders (miscellaneous), as well as widely held firms.
In panel A is done the analysis for individuals, and it is possible to conclude that market
capitalization influences negatively such corporate structures, i.e., these companies
generally present a small size. On the other hand, in line with La Porta et al (1999), these
corporate structures seem to be more observed in civil law based countries. The explanation
that appears to be more plausible for this is related with the countries´ economic history. In
some of them, with smaller companies, the State promoted the delivery of vital sectors of
its economy to local groups. This is particularly true for many countries, e.g. Chile,
Portugal and Turkey.
For companies owned by the Government (panel B), it should be noted that this type of
financial structure is more visible in countries whose disclosure level is more limited,
particularly in Greece, India and Thailand. Probably this is a result of these countries
present a less developed financial system, as well as less transparent and where the State
wants to continue playing a decisive role in the economy. This class of firm structures is
more visible in non catholic based countries. Asian countries where Catholic religion is
poorly disseminated is fundamental for such result.
In panel C are presented companies whose shareholder structure is diffuse, usually
characterized by having more than one shareholder, the largest and a smaller, the latter with
a role in the decisions of the management as a monitor. Usually the monitor is a financial
intermediary (bank, hedge fund or asset manager), finding out growth firms (glamorous
stocks) where the role of monitoring is crucial, particularly in terms of investment decisions
made by the management. This occurs most frequently on banking based countries, and
15 Such corporate ownership structures are also more frequent on small firms (see panel C)
where it gets easier to be the second largest shareholder, with a role of monitoring the
largest one. In fact, asset managers find out glamorous small stocks for their portfolios as a
way of controlling the investments made by management/largest shareholder.
Finally regressions for widely held firms are reported in panel D, and the results of
regressions were expected, market capitalization and economic freedom play an important
and positive role in that category of firms. Widely held firms present large market
capitalization and proliferate in an environment where the role of the private sector is
defended, i.e., in countries characterized by economic freedom, giving the opportunity to be
created larger capital markets with thousands of shareholders.
4. Conclusion
This research paper aims to assess the main forces that influence corporate ownership, more
precisely the determinants of a firm owned by individuals, Government, miscellaneous of
investors and widely held.
Firms owned by individuals, Government, miscellaneous investors or widely held, exist under
different circumstances. While firms owned by individuals are small, proliferate on civil-law
based countries with low levels of economic freedom, firms owned by Governments multiply
under low standards of disclosure, emergent financial markets and non-civil-law environments.
On the other hand, the presence of miscellaneous investors is more frequent when stocks are
glamorous and small wherein the smaller shareholder can easily use their limited resources and
monitoring the management/larger shareholder. Finally, widely held firms are large and are
16
References
Almeida, H., and D. Wolfenzon, 2006, A theory of pyramidal ownership and family business groups, Journal of Finance 61, n.º 6, 2637-2680.
Bhattacharya, U., H. Daouk, and M. Welker, 2003, The world price of earnings opacity, Accounting Review 78, 641-678.
Bebchuk, L., 1999, A rent-protection theory of corporate ownership and control, Working Paper, Harvard Law and Economics.
Becht, M., and A. Roell, 1999, Block holdings in Europe: An international comparison, European Economic Review 43, 1049-1056.
Berle, A., and G. Means, 1932, The modern corporation and private property (Macmillan, New York).
Claessens, S., S. Djankov, and L. Lang, 2000, The separation of ownership and control in East Asian corporations, Journal of Financial Economics 58, 81-112.
Demirgüç-Kunt, A., and R. Levine, 1999, Bank-based and market-based financial systems: Cross country comparisons, Working Paper, World Bank Policy Research.
Demsetz, H., and K. Lehn, 1985, The structure of corporate ownership: Causes and consequences, Journal of Political Economy 93, 1155-1177.
Faccio, M., and L. Lang, 2002, The ultimate ownership of Western European countries, Journal of Financial Economics 65, 365-395.
Georgen, M., and L. Renneboog, 1998, Insider retention and long-run performance in German and UK IPO’s, Working Paper, University of Manchester institute of Science and Technology.
Guedhami, O., and J.Pittman, 2006, Ownership concentration in privatized firms: The role of disclosure standards, auditor choice, and auditing infrastructure, Journal of Accounting Research 44, 889-929.
Himmelberg, C., G. Hubbard, and D. Palia, 1999, Understanding the determinants of managerial ownership and the link between ownership and performance, Journal of Financial Economics 53, 353-384.
Holderness, C., 2009, The Myth of Diffuse Ownership in the United States, Review of Financial Studies 22, 1377-1408.
La Porta, R., F. de Silanes, A. Shleifer, and R. Vishny, 1997, Legal determinants of external finance, Journal of Finance 52, 1131-1150.
17 La Porta, R., F. de Silanes, A. Shleifer, and R. Vishny, 1999, Corporate ownership around the world, Journal of Finance 54, 471-517.
Kahn, C., and A. Winton, 1998, Ownership structure, speculation and shareholder intervention, Journal of Finance 53, 99-130.
Prowse, S., 1992, The structure of corporate ownership in Japan, Journal of Finance 47, 1121-1140.
Rajan, R., and L. Zingales, 2003, The great reversals: The politics of financial development in the 20th century, Journal of Financial Economics 69, 5-50.
18
Table I - Firm – Level Variables
The median market capitalisation of the 20 largest firms by country, million dollar denominated, is from Worldscope (WS Item, WC07211).
The median market-to-book of the 20 largest firms by country is also Worldscope. Market-to-book is defined as total assets (Worldscope Item,
WC 02999) minus book equity - defined as total assets minus total liabilities (WC 03351) and preferred stock (WC 03451) plus deferred taxes
(WC 03263) and convertible debt (WC 18282) - plus market capitalisation (WC 08001), local currency denominated, divided by total assets.
The median annualised volatility of the 20 largest firms by country is calculated using Datastream data, dollar denominated, considering
weekly returns during 2000-2005
Country Market Capitalisation Market-to-Book Volatility
(median) (median) (median)
Austria 4.077 1,23 0,27
Belgium 6.896 1,34 0,25
Chile 2.763 1,24 0,27
Denmark 4.014 1,51 0,29
Finland 4.067 1,5 0,31
France 47.826 1,19 0,29
Germany 32.799 1,07 0,34
Greece 4.483 1,38 0,3
Italy 17.247 1,13 0,28
Japan 49.882 1,11 0,34
Netherlands 14.195 1,39 0,34
Norway 3.125 1,51 0,35
Portugal 2.360 1,18 0,26
South Korea 12.919 1,2 0,46
Spain 16.121 1,31 0,23
Sweden 13.464 1,36 0,3
Switzerland 16.367 1,74 0,32
Taiwan 9.321 1,41 0,35
Turkey 2.919 1,23 0,56
Civil Law Countries Average 13.939 1,32 0,32 Australia 15.219 1,41 0,22
Canada 28.917 1,35 0,24
Hong Kong 13.974 1,14 0,3
India 10.914 1,72 0,41
Ireland 2.979 1,57 0,27
Malaysia 4.206 1,22 0,2
New Zealand 1.084 1,49 0,26
Singapore 4.108 1,15 0,28
South Africa 10.106 1,56 0,35
Thailand 2.814 1,24 0,36
UK 71.490 1,62 0,26
USA 155.476 1,93 0,27
Common Law Countries Average 26.774 1,45 0,29
19
Table II – Country – Level Variables
Disclosure level is from Bhattacharya et al (2003), with higher value indicating more disclosure. The original source is the Center for
International Financial Analysis and Research (CIFAR). Private credit is from World Bank and is defined by domestic credit provided by
banking sector % of GDP 2004.The index of economic freedom is from Heritage Foundation and varies from 0 and 100. Religion is from
http://www.mapsofworld.com/world-religion-map.htm.
Panel A: Country-Level Variables
Country Disclosure Private Economic Religion
Level Credit Freedom
Austria 59,7 1,23 71,9 Catholic
Belgium 67,8 1,12 70,2 Catholic
Chile 72,9 0,7 77,4 Catholic
Denmark 70,6 1,66 78,6 Prothestant
Finland 78,2 0,7 74 Prothestant
France 75,8 1,07 64,6 Catholic
Germany 66 1,43 71,8 Prothestant
Greece 59,8 1,05 60,3 Other
Italy 65,4 1,05 60,3 Catholic
Japan 70,5 1,55 72,8 Other
Netherlands 71,4 1,67 74,7 Catholic
Norway 75,4 0,11 70,3 Prothestant
Portugal 53,7 1,51 64 Catholic
South Korea 67,5 1,01 69,8 Other
Spain 68,2 1,39 70,2 Catholic
Sweden 82,1 1,13 71,9 Prothestant
Switzerland 75 1,75 81,9 Catholic
Taiwan 62,3 1,67 70,8 Other
Turkey 58,6 0,6 64,2 Other
Civil Law Countries Average 68,47 1,18 70,5
Australia 78,9 1 82,5 Prothestant
Canada 72,5 0,97 80,8 Catholic
Hong Kong 72 1,49 89,7 Other
India 54 0,6 54,6 Other
Ireland 79,1 1,18 78,7 Catholic
Malaysia 76,4 1,34 66,3 Other
New Zealand 77 1,21 82,3 Prothestant
Singapore 76,6 0,8 87,2 Other
South Africa 75 0,85 62,7 Prothestant
Thailand 62,5 1,05 64,7 Other
UK 82,1 1,58 74,5 Prothestant
USA 73 2,71 77,8 Prothestant
Common Law Countries Average 73,26 1,23 75,2
20
Table III - Ultimate Owners – Number of Firms by Country
This table exhibits the percentage of firms owned by type of ultimate owners, using 20% threshold. Ultimate owners with more than 5%
of votes are included on the sample. A firm whose ultimate owners own less than 20% is considered widely held at 20% threshold.
Ultimate owner classification is defined in section 2.1.1 . .*, **, and ***, indicate significance at the 10, 5 and 1 percent level.
Country Miscellaneous Individuals Government Widely
Held
Austria 12 2 1 5 Belgium 10 4 2 4
Chile 6 9 0 5
Denmark 11 3 0 6
Finland 7 1 4 8
France 2 1 4 13
Germany 3 4 2 11
Greece 5 4 5 6
Italy 7 3 1 9
Japan 1 0 5 14
Netherlands 7 2 0 11
Norway 8 5 4 3
Portugal 14 5 0 1 South Korea 6 1 3 10
Spain 3 5 0 12
Sweden 10 5 1 4
Switzerland 5 4 2 9
Taiwan 6 2 1 11
Turkey 8 11 0 1
Civil Law Average 6,89 3,74 1,84 7,53 Australia 2 0 1 17
Canada 1 3 0 16
Hong Kong 8 4 5 3
India 8 1 7 4
Ireland 13 0 0 7
Malaysia 16 4 0 0 New Zealand 13 1 2 4
Singapore 4 2 7 7 South Africa 9 0 0 11
Thailand 7 1 6 6
UK 4 0 0 16
USA 0 3 0 17
Common Law Average 7,08 1,58 2,33 9,00
21
Table IV – Determinants of Ultimate Owner Class
The table reports the results of OLS regressions for a sample of 32 countries, considering 20% threshold. The dependent variable is the
ultimate owner class (1 for a given class and 0 for the remaining): Individuals, Government, miscellaneous and widely held. Civil
origin, disclosure, private credit, economic freedom and catholic origin are dummy variables. Disclosure, private credit and economic
freedom are 1 if above the median. QML Heteroscedasticity-consistent standard errors (Huber/White) are reported in parentheses. .*, **,
and ***, indicate significance at the 10, 5 and 1 percent level.
Panel A - Individuals
Market Capitalization -0,2508 -0.2280 -0.2414 z-statistic -2.73*** -2.91*** -2.65***
Market-to-Book 0.0438 0.0238 z-statistic 0.84 0.49
Volatility -0.2274 0.3909 z-statistic -0.27 0.49
Civil Origin -0.9450 -0.8893 -0.8940 z-statistic -2.97*** -2.85*** -3.16***
Disclosure 0.2608 0,1964
z-statistic 0.85 0.65
Private Credit -0.0896 -0,1281 z-statistic -0.33 -0.47
Economic Freedom -0,5658 -0,5401 -0.4642 z-statistic -1.89* -1.80* -1.96**
Catholic Origin 0,1800 0,1311
z-statistic 0.71 0.54
Pseudo R2 0,05 0,01 0,04 0,05
Nº obs 620 620 620 620
Panel B - Government
Market Capitalization 0,1739 0,0407 z-statistic 1.41 0.44
Market-to-Book -0.1968 -0.1557 z-statistic -1.09 -0.86
Volatility -0.8390 1.1344 z-statistic -0.72 1.50
Civil Origin 0.2522 0.2479
z-statistic 0,70 0.74
Disclosure -1.0375 -0,9325 -0.5987 z-statistic -2.37** -2.15** -2.17**
Private Credit -1.3580 -1.1950 -1.0027 z-statistic -4.00*** -3.94*** -3.44***
Economic Freedom 0,3862 0,4599
z-statistic 0.98 1.17
Catholic Origin -1.2555 -1.0779 -1.1334 z-statistic -3.21*** -2.95*** -3.12***
Pseudo R2 0,09 0,01 0,08 0,07
22
Panel C - Miscellaneous
Market Capitalization -0.6046 -0,5802 -0.6019 z-statistic -8.16*** -8.13*** -8.12***
Market-to-Book 0.0916 0.0938 0.0864 z-statistic 2.22** 2.38** 2.14**
Volatility 0.4240 -0.2592 z-statistic 0,55 -0.36
Civil Origin 0.0601 0.1988
z-statistic 0,27 0.51
Disclosure 0.03253 0.1967
z-statistic 1.44 0.92
Private Credit 0.7433 0.5575 0.6629 z-statistic 2.62*** 2.99*** 3.45***
Economic Freedom -0.3877 -0.4485 -0.2077 z-statistic -1.52 -1.64 -1.10
Catholic Origin 0.2370 0.1349
z-statistic 1.14 0.71
Pseudo R2 0,09 0,09 0,01 0,11
Nº obs 620 620 620 620
Panel D - Widely Held
Market Capitalization 0.6605 0,6616 0.6442 z-statistic 8.66*** 8.71*** 8.49***
Market-to-Book -0.0929 -0.0853 z-statistic -1.61 -1.57
Volatility -0.1220 -0.4736 z-statistic -0.17 -0.70
Civil Origin 0.2056 0.1645
z-statistic 0.92 0.83
Disclosure -0.0840 0.0491 z-statistic -0.37 0.24
Private Credit -0.2664 -0.0461 z-statistic -1.36 -0.25
Economic Freedom 0.5547 0.5820 0.4875 z-statistic 2.57** 2.89*** 2.72***
Catholic Origin 0.0347 0.1219
z-statistic 0.17 0.66
Pseudo R2 0,13 0,12 0,02 0,12