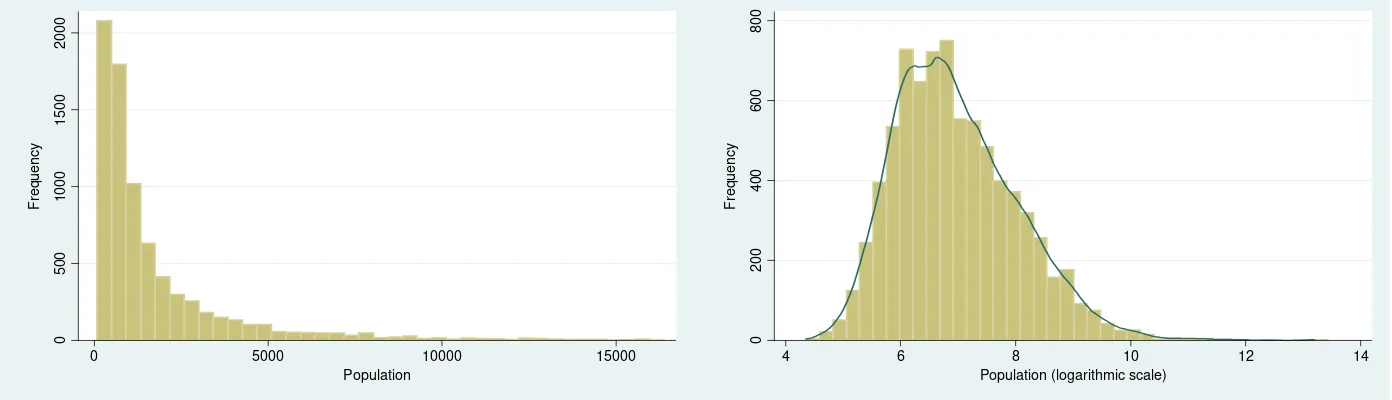
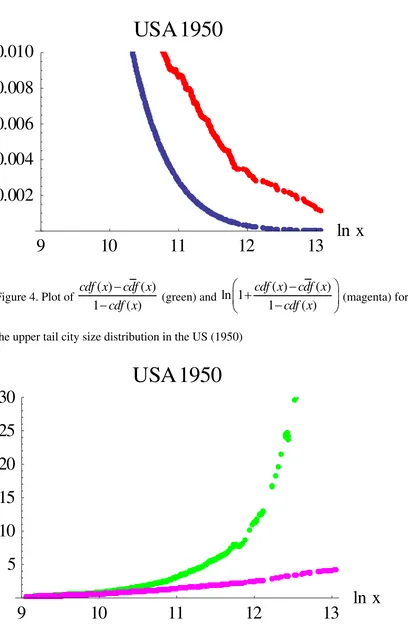
The accuracy of graphs to describe size distributions
Full text
Figure

Related documents
The process of identifying promising products appears to OTA to be both appropriate and fair and, in general, NETAC is performing a valuable service. Nonetheless, a few of
In addition to the contingent nonforfeiture benefits described above, the following reduced “paid up” contingent nonforfeiture benefit is an option in all long-term care
If, as of the Effective Date, Participant has not already executed the Member Committer and Contributor Agreement, Participant accepts and agrees to all of the terms
The target audience for this course is: System Engineers, Service Engineers, and Ericsson Personnel working with operation, provisioning and configuration of the Mobility
In simulated outbreaks using semi-synthetic data, PCTS maintained the detection signal much better than PCS in the case of both Cryptosporidium and in‡uenza outbreaks. Furthermore,
To this end quantitative (based on available indicators) and qualitative assessment is provided, taking into account also to which extent reducing risk of poverty and
The research draws on field study cases that follow various aspects of particular commodities, including rubber, pomelo, tomato, cassava, and furthermore, incorporates
A network with a minimal architecture complexity was evalu- ated on a dataset containing domains names generated by 51 different malware families as well as normal domains..
