ISSN Online: 1947-3818 ISSN Print: 1949-243X
Low-Voltage Analysis of Distribution Network
Software Design and Application
Mingqiu Du
1, Yan Li
1, Chunfang Liu
2, Tangjie Liang
21State Key Laboratory of Advanced Electromagnetic Engineering and Technology, Huazhong University of Science and
Technology, Wuhan, China
2Foshan Electric Power Design Institute Co., Ltd., Foshan, China
Abstract
With the rapid development of urban economy, distribution network con-struction of city is lagging behind the increment of load, and low-voltage problem has become the main complaints of the power users. Based on Py-thon [1] scripting language, this paper develops a piece of software which can provide a friendly human-machine experience for the user, calculate the vol-tage of the power distribution area and propose corresponding control meas-ures, then the paper takes the actual power distribution area to verify its effec-tiveness.
Keywords
Low-Voltage Analysis, Distribution Network, Python
1. Introduction
In recent years, with the fast development of China’s urban economy, the de-mand for electricity is also growing rapidly, limited to the urban land resource, old distribution lines have not been planned scientifically and distribution net-work construction in city is lagging behind the increment of load, shortage of power point, small cross-section of the trunk line, small radius of the power supply and the disorder of the branch lines are commonly found in city power grid, during the power consuming peak period in summer, low-voltage problem has become the main complaints of the power users [2]. In order to change the voltage profile, people have done a lot of work in distribution network: a me-thodology for alleviating peak demand using distribution network voltage con-trol is presented in [3]; reactive power compensation device can also effectively reduce network losses, at the same time it can provide the strong guarantee to the safe operation of power grid [4]. On the other hand, power distribution area How to cite this paper: Du, M.Q., Li, Y.,
Liu, C.F. and Liang, T.J. (2017) Low-Vol- tage Analysis of Distribution Network Soft- ware Design and Application. Energy and Power Engineering, 9, 183-188.
https://doi.org/10.4236/epe.2017.94B022
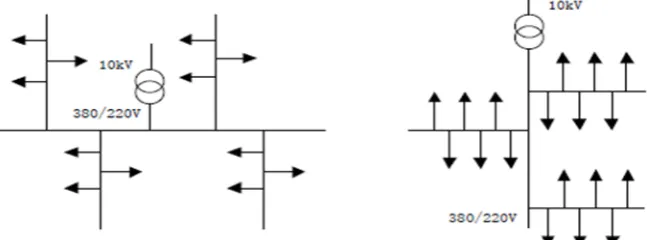
of distribution network is the radial type as shown in Figure 1, considering that many power flow calculation methods like Newton-Raphsonare not effective for the calculation in radial distribution network, software such as PSASP, PSCAD is developed to calculate the complex power system with huge nodes and gene-rators embedded in detailed model, so it is not suitable to apply, in order to sim-plify the operation, low-voltage area of the distribution network should adopt back/forward sweep algorithm [5] [6] [7] and this algorithmis realized through python programming in voltage calculation.
The Python scripting language is chosen for implementing the proposed me-thod due to the fact that it is available for free and its most important numerical libraries, i.e., Numpy and Scipy; this software written by Python can also provide a friendly human-machine experience through Tkinter (Graphical User Inter-face library) [8], calculate the voltage of the power distribution area and propose the corresponding control measures, store data in the form of excel through third-party libraries which can read-write excel easily so that people can easily input, calculate and analyze data of distribution network area.
2. Software Structure and Data Flow
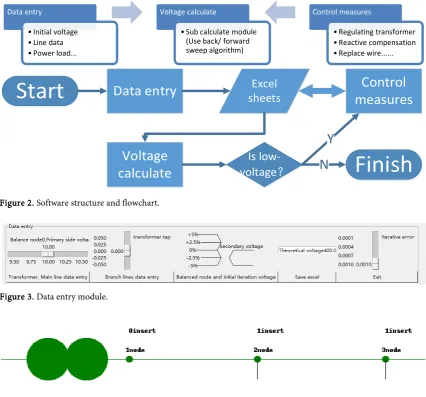
As shown in Figure 2, the main menu includes three independent modules: Da-ta entry, VolDa-tage calculation, Control measures, DaDa-ta entry module leads you to enter the area data in a specific order at first, then Voltage calculation module calculates the voltage drop percentage, if there is a low-voltage problem in the distribution network, Control measures module allows user to change the area parameters to improve voltage profile.
[image:2.595.211.535.587.707.2]As shown in Figure 3, Data entry module consists of four basic inputs: the main line basic data, the branch line basic data, the slack bus voltage and the origin iteration voltage, by adjusting the button in the left, user can adjust the theoretical (ignoring transformer impedance) secondary voltage, the scale of iterative error controls output error of voltage in per unit. After receiving the above inputs, it will generate an Excel file in which will store all information of the distribution network and user can save the picture of distribution area structure to distinguish different areas (Figure 4).
Start
Data entry
sheets
Excel
Voltage
calculate
voltage
Is low-
?
N
Finish
Control
measures
[image:3.595.113.538.79.269.2] [image:3.595.112.539.80.477.2]Y
Figure 2. Software structure and flowchart.
Figure 3. Data entry module.
Figure 4. Picture of distribution area structure.
Voltage calculation module includes three basic functions: importing picture, importing Excel data, and calculating voltage, based on back/forward sweep al-gorithm, this module will first calculate the main line voltage, then the branch voltage and be able to output the results of the voltage profile.
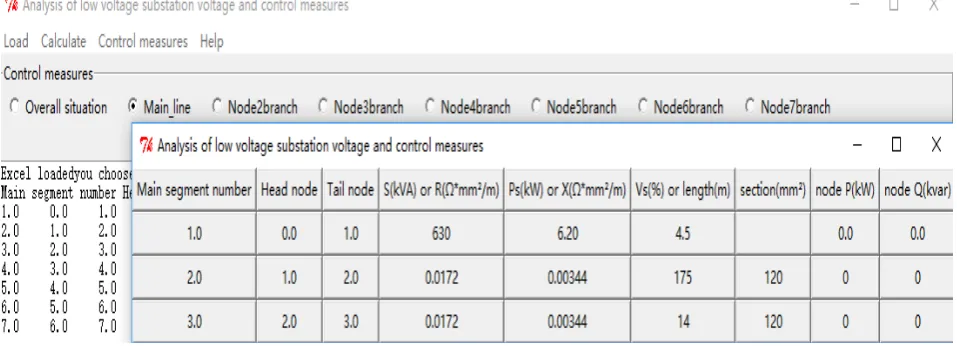
Control measures module include four basic functions: reading Excel data, se-lecting data to be modified, saving data, importing picture, the picture imported can be convenient for the operator to check the network structure, when choosing the main or any branch line in the Excel sheets, you can click the corresponding button in Python to modify the data, at the same time, it will give you specific suggestions based on your selection, take the wire cross-section as an example, if you choose it in the main line, system will remind you to increase the cross-section area of the wire for the wire cross-section is less than a specified value.
3. Case Application and Voltage Control Measures Analysis
Figure 5 is the topology of a typical low-voltage distribution network area which
Data entry
•Initial voltage •Line data •Power load...
Voltage calculate
•Sub calculate module (Use back/ forward sweep algorithm)
Control measures
1, 120 mm2 of the main line cross-section may cause low-voltage problem,
what’s worse, the feeder layout is built in such a way that no load point is served within the first 175 m.
The initial results of voltage calculation are shown in Table 2.
According to the “GB/T 12325-2008 power supply voltage deviation” quality standard, 20 kV or below, 3-phase power supply network area of which voltage is 7% lower than standard value is called low-voltage area. Selected area’s stan-dard voltage is 380 V, so if the user-side voltage is lower than 380 − 380 × 7% = 353.4 V, there is a low-voltage problem in this area. As shown in Table 2, there is a great voltage drop between nodes 1 and 2, however it is impossible to short-en line lshort-ength limited to there source of urban land, in order to improve the vol-tage profile, one of the control measures taken in this paper is to increase cross- section of the main line from 120 mm2 to 185 mm2, saving the modified data and
recalculating the voltage, new voltage profile is displayed in Figure 6.
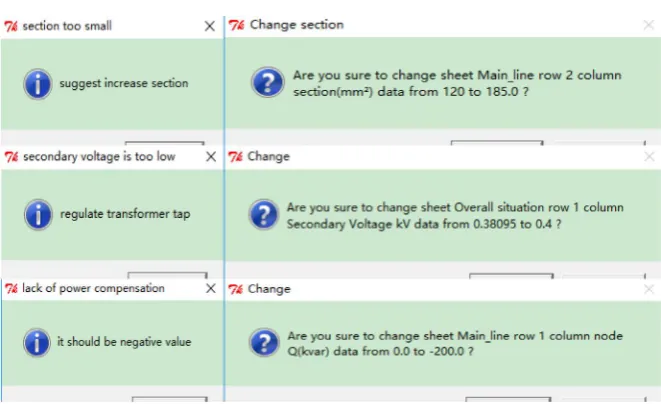
As shown in Figure 7, other ways of changing voltage such as adjusting the transformer taps, offering reactive power compensation, replacing existent transformer or changing wire parameters can be achieved in this software as well: as in Figure 3, if primary side voltage is 10 kV, regulate transformer tap from +5% to 0% and secondary voltage will increase from 0.38 to 0.4; user can also add reactive power compensation at any node, but the injected volume of reactive power should be negative value; method to change the other parameters is clicking on corresponding key in Figure 8 and it will also give the corres-ponding modification tips. At last, software will generate a completely new Excel
2 3 BVV-3*120/13 4 BVV-3*120/14 5 BVV-3*120/16 6 BVV-3*120/19
10 11 12 13
BVV-3*70/77 BVV-3*70/72 BVV-3*70/89 BVV-3*70/79 BVV-3*70/88
1 630kVA
BVV-3*120/175 BVV-3*120/14
8 9
BVV-3*70/75 0
7
Figure 5. A low-voltage distribution network area.
Table 1. Distribution area parameters.
Component parameters Transformer parameters Lineparameters
S (kVA) Vs (%) Ps (kW) R (Ω*mm2/m) X (Ω*mm2/m)
630 4.5 6.2 0.0172 0.00344
Table 2. Initial voltage profile.
Mainnodenumber 1 2 3 4 5 6 7
Voltage 373.5 349.00 347.41 346.19 345.13 344.2 343.86
Branch nodenumber -- 8 9 10 11 12 12
Figure 6. Voltage profileofmain nodes.
Figure 7. Information prompt.
sheet in which the new data is stored, so that user can distinguish between new and old; if user can skillfully operate the software, user can skip Control measure module and directly modify the Excel to calculate, which may lead to the failure of the subsequent calculation, but sometimes can be more rapid and convenient.
The final simulation results are in agreement with the excepted voltage profile: regulating transformer can improve the overall voltage distribution; centralized reactive power compensation is not very effective in distribution network area and changing cable section can effectively reduce the loss of voltage.
4. Summary
[image:5.595.209.540.225.427.2]Figure 8. Control measures module.
with simple and convenient operation.
References
[1] Lutz, M. (2009) Learning Python: Powerful Object-Oriented Programming. O’Reilly Media, Inc.
[2] Willis, H.L. (1997) Power Distribution Planning Reference Book. Marcel Dekker, 82.
[3] McKenna, K. and Keane, A. (2016) Distribution Network Voltage Control for Peak Load Alleviation.2016 IEEE International Conference on Power System Technology
(POWERCON), Wollongong, 1-6.
https://doi.org/10.1109/POWERCON.2016.7754033
[4] Sun, X., Wang, W. and Zhu, M. (2015) Research on Distribution Network Reactive Power Compensation Based on Low Voltage Power Grid. 2015 8th International Conference on Control and Automation (CA), Jeju, 33-37.
https://doi.org/10.1109/CA.2015.18
[5] Hakim,L., Wahidi,M., Murdika,U., Milano,F., Kubokawa, J. and Yorino, N. (2015)A Three-Phase Power Flow Analysis for Electrical Power Distribution System with Low-Voltage Profile. 2015 2nd International Conference on Information Technolo-gy, Computer, and Electrical Engineering (ICITACEE), Semarang, 303-308.
https://doi.org/10.1109/ICITACEE.2015.7437819
[6] Shirmohammadi, D., Hong, H.W., Semlyen, A. and Luo, G.X. (1988) A Compensa-tion-Based Power Flow Method for Weakly Meshed Distribution and Transmission Networks. IEEE Transactions on Power Systems, 3, 753-762.
https://doi.org/10.1109/59.192932
[7] Luo, G.X. and Semlyen, A. (1990) Efficient Load Flow for Large Weakly Meshed Networks. IEEE Transactions on Power Systems, 5, 1309-1316.
https://doi.org/10.1109/59.99382
Submit or recommend next manuscript to SCIRP and we will provide best service for you:
Accepting pre-submission inquiries through Email, Facebook, LinkedIn, Twitter, etc. A wide selection of journals (inclusive of 9 subjects, more than 200 journals)
Providing 24-hour high-quality service User-friendly online submission system Fair and swift peer-review system
Efficient typesetting and proofreading procedure
Display of the result of downloads and visits, as well as the number of cited articles Maximum dissemination of your research work
Submit your manuscript at: http://papersubmission.scirp.org/