At present, there is a great concern all over the world for the sustainability of the land use. A lot of evidence has been found to show that soil quality is, or may be, worsening (Doran & Parkin 1994, 1996; Šarapatka et al. 2002). Lal et al. (1989) and Lal (1997) described the land resources of the world as finite, fragile, and non-renewable and reported that only about 22% of the total area of the globe is suitable for cultivation and only 3% has a high agricultural production capacity. A series of subsequent official reports (e.g. from UNO) warn of some degree of soil degradation threat (European Environment Agency 2000), but the maps of the extent and severity of the degra-dation on country and global scales do not exist (Prince et al. 2009).
According to Oldeman (1994), water erosion is the predominant form of soil degradation (55.7%),
followed by wind erosion (27.8%), chemical (12.3%) and physical damage. In the Czech conditions ac-cording to the database of Research Institute for Soil and Water Conservation (2008), individual types of degradation differ with the area, the most notable being water erosion which threatens more than 45% of agricultural areas. This is followed by wind erosion (11%), extreme soils – clay soils (4.5%), and soils affected by dryness (1.5%).
Lots of attempts were made worldwide at de-veloping methods of identification of the most threatened areas (Yansui et al. 2003; de Paz
et al. 2006). The goal of our work was to find a suitable tool, to identify the phenomena need-ing to be covered in the process in the Czech Republic, to find suitable datasets often provided in non-unique form by different independent organisations.
Analysis of Soil Degradation in the Czech Republic:
GIS Approach
Bořivoj ŠARAPATKA
1, Marek BEDNÁŘ
1and Pavel NOVÁK
21Department of Ecology and Environmental Sciences, Faculty of Science, Palacký University,
Olomouc, Czech Republic; 2Research Institute for Soil and Water Conservation, Prague-Zbraslav, Czech Republic
Abstract: In our work, we have evaluated the available data on the individual types of soil damage, which has been processed in the Czech Republic in recent decades. The individual types of degradation (water erosion, wind erosion, soil compaction, extreme soils (clay soils), loss of organic matter, acidification, dryness impact, and intoxication) were classified in one of three groups: physical degradation, desertification and chemical degradation. Each type of degrada-tion was assigned a specific weight reflecting the importance of this kind of soil degradadegrada-tion. The maps of individual areas of degradation were processed by overlay and assigning weighting techniques in ArcView Spatial Analyst GIS environment to create the final maps for each class of the degradation threat. The same technique was used to create the final map showing the most troubled areas in the Czech Republic, threatened by soil damage.
Keywords: degradation; GIS; modelling; soil
MATERIALS AND METHODS
Because the nature of our task was spatial, the need for GIS systems for presenting and modelling data was a must. We used GIS systems provided by ESRI – GIS ArcView 3.2 system in connection with ArcGIS 9.2, for specific purposes ArcGIS Spatial Analysis and ArcGIS Geostatistical Analyst extensions applied used using common methods of GIS analyses described in Johnston et al. (2003), Maguire et al. (2005) and McCoy et al. (2002).
The first step was to specify all relevant phenom-ena which could lead to agricultural degradation threat. A set of phenomena was chosen: water erosion, wind erosion, loss of organic matter, heavy metal intoxication, acidification, soil compaction, dryness impact, and extreme – clay soils. Sandy bottom soils were not processed within the ex-treme soils, but in dryness impact areas which have a great effect on total desertification. All these phenomena were investigated independently in individual institutes at nationwide level. The scale which was used mostly corresponded to one cadastre unit. In this way the overall area of the Czech Republic could be processed.
The next step was to obtain the data from all sources available – mostly from the institutes of
Soil and Water Conservation in Prague and from the Central Institute for Supervising and Testing in Agriculture in Brno. Because of the non unique format of the data provided these had to be uni-fied into a form acceptable for the subsequent GIS evaluation.
All these raster sources constituted the so called representation models – models which show some distribution of the types of degradation threat within the Czech Republic. The minimum area unit processed is cadastre which applies also for newly created models. The models methodology corresponds to the common use of the model-ling technique described in Skidmore and Prins (2002).
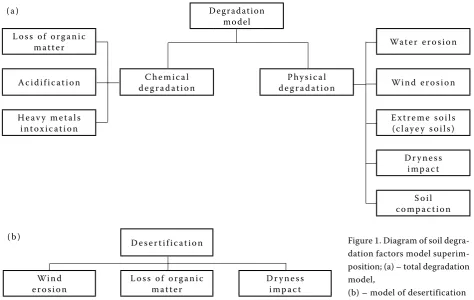
These models were divided into two groups ac-cording to the model type (see Figure 1). Chemical models (loss of organic matter, acidification, and heavy-metal intoxication) and physical models (wind erosion, water erosion, extreme soils, soil compaction, and dryness impact). In addition the items which lead to the degradation threat were selected to achieve a secondary task – the creation of a degradation model.
[image:2.595.61.536.458.758.2]Then we created the process models – models that would describe some interactions between the superimposed representation models. The aim was
Figure 1. Diagram of soil degra-dation factors model superim-position; (a) – total degradation model,
(b) – model of desertification
(a) Degradation
model Loss of organic
matter Water erosion
Acidif ication deg radationChemical deg radationPhysical Wind erosion
He av y metals
intoxication E xtreme soils (claye y soils)
Dr y ness impact
S oil compaction
( b)
D eser tif ic ation
Wind
firstly to create a model of chemical degradation threat, secondly, models of physical degradation threat and a model of desertification. The last step was to create a model of the resulting degradation threat combining the process models of chemical and physical degradation.
A similar approach but with the combination of physical, chemical, and biological degradation was described by de Paz et al. (2006).
The process model functions were specified as: CHM = a1 × LOM + a2 × A + a3 × HMI PHD = b1 × WIE + b2 × WAE + b3 × ES + b4 ×
SC + b5 × DI
RDM = c1 × CHD + c2 × PHD
DSM = d1 × WIE + d2 × LOM + d3 × DI
where:
CHM – chemical degradation LOM – loss of organic matter A – acidification
HMI – heavy metal intoxication WAE – water erosion
WIE – wind erosion
ES – extreme soils (clay soils) SC – soil compaction DI – dryness impact CHD – chemical degradation PHD – physical degradation
RDM – Resulting Degradation Model DSM – Desertification Model
Individual weightings a1–a3, b1–b5, c1, c2, d1–d3
[image:3.595.88.522.83.168.2]were specified by the judgment of an independent agricultural specialist.
Figure 2. Diagram of landscape protection model superimposition
Figure 3. Physical degradation of soil model
L andscap e prote ction
C HKO
[image:3.595.64.536.444.741.2]As we can see from the process functions, all sources in a group were overlaid and superimposed (by the methods of raster analysis map algebra) to obtain the final group raster map which showed the resulting situation in the Czech Republic in terms of the chemical, physical, and finally total endangerment of agricultural areas.
For the purposes of comparison the data concern-ing the environmental landscape protection was assessed (Figure 2). This data includes the maps of the Protected Areas (CHKO), National Parks, Natura 2000 Bird areas, and areas influenced by Nitrate Directive. These were evaluated and su-perimposed in the same way as the degradation factors described above to obtain the model of the landscape environmental protection. A diagram follows (Figure 2).
The hypothesis could be expressed by the fol-lowing sentence: The landscape protected areas should express a lower value of total degradation than the non-protected areas. This was statisti-cally evaluated.
The scale of legends was set up to five classes from safe to extremely high according to the resulting sum of all inputs affecting degradation expressed in degradation units. Maximum possible value of
the sum (all input degradation units have their maximum) divided by five (five classes of legend) gives the interval of one class.
RESULTS
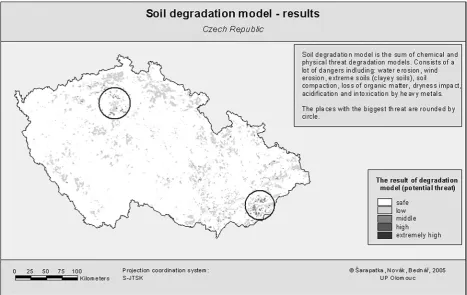
The results provided are in the form of maps which show the areas influenced by different rates of degradation processes. Figures 3 and 4 illustrate the results of two degradation models – physical and total degradation. The latter model helps to identify the areas where the total degradation sum involving all the degradation factors has reached a maximum.
Due to the fact that the soil protection manage-ment could significantly reduce the level of degrada-tion, we included a map showing both degradation and protection impacts by combining the degrada-tion and environmental protecdegrada-tion models.
[image:4.595.64.532.84.379.2]From the resulting landscape protection mod-el, the hypothesis of the effects of the landscape protected areas on the total sum of degradation was tested. The hypothesis was not proven. The mean degradation is similar for both categories of protected and non-protected land.
CONCLUSION
It can be seen from the results that most prob-lems reside in very intensively used agricultural production areas, which are not included in the less favoured areas (LFA). These are often the soils with signs of desertification (areas affected by dryness, water erosion and loss of humus).
Further investigation will concern organic farm-ing analysis. Considerate systems of agricultural practise will be proposed with respect for the en-vironment (for example organic farming according to EU Council Directive 2092/91) on the basis of the land use, soil degradation, investigation and further points of view including economic and social aspects.
We believe the methodology can quickly ad-dress the places with the most problematic soil degradation and can do this more precisely than the human eye. By pinpointing the problem areas, it can show where the environmental protection should be directed to.
References
De Paz J.M., Sanchez J., Visconti F. (2006): Combined use of GIS and environmental indicators for assess-ment of chemical, physical and biological soil degra-dation in a Spanish Mediterranean region. Journal of Environmental Management, 79: 150–162.
Doran J.W., Parkin T.B. (1994): Defining and assessing soil quality. In: Doran J.W., Coleman D.C., Bezdicek D.F., Stewart B.A. (eds): Defining Soil Quality for Sus-tainable Environment. Soil Science Society of America, Special Publication No. 35, Madison, 3–21.
Doran J.W., Parkin T.B. (1996): Quantitative indicators of soil quality. In: Doran J.W., Jones A.J. (eds): Meth-ods for Assessing Soil Quality. Soil Science Society of America, Inc., Madison, 25–38.
European Environment Agency (2000): Down to earth: Soil degradation and sustainable development in Eu-rope. Environmental Issue Series, No. 16.
Johnston K., Ver Houf J. M., Krivoruchko K., Lucas N. (2003): Using ArcGIS Geostatistical Analyst. Envi-ronmental Systems Research Institute, Redlands. Lal R. (1997): Degradation and resilience of soils.
Philo-sophical Transactions of the Royal Society of London, 352: 997–1010.
Lal R., Hall G.F., Miller F.P. (1989) Soil degradation: I. Basic processes. Land Degradation and Rehabilita-tion, 1: 51–69.
Maguire D.J., Batty M., Goodchild M.F. (2005): GIS, Spatial Analysis, and Modeling. Environmental Systems Research Institute, Redlands.
McCoy J., Kopp S., Johnston K. (2002): Using ArcGIS Spatial Analyst. Environmental Systems Research In-stitute, Redlands.
Oldeman L.R. (1994): The global extent of soil
degra-dation. In: Greenland D.J., Szabolcs I. (eds): Soil
Resilience and Sustainable Land Use. CABI, Walling-ford, 99–118.
Prince S.D., Becker-Reshef I., Rishmawi K. (2009): Detection and mapping of long-term land degrada-tion using local net producdegrada-tion scaling: Applicadegrada-tion to Zimbabwe. Remote Sensing of Environment, 113: 1046–1057.
Skidmore A.K., Prins H. (2002): Environmental Model-ling with GIS and Remote Sensing. 2nd Ed. CRC Press,
London.
Šarapatka B., Dlapa P., Bedrna Z. (2002): Soil Quality and Degradation. VUP, Olomouc. (in Czech)
Yansui L., Jay G., Yanfeng Y. (2003): A holistic ap-proach towards assessment of severity of land deg-radation along the Great Wall in northern Shaanxi province, China. Environmental Monitoring and As-sessment, 82: 187–202.
Received for publication September 14, 2009 Accepted after corrections January 8, 2010
Corresponding author:
Prof. Dr. Ing. Bořivoj Šarapatka, CSc., Univerzita Palackého v Olomouci, Přírodovědecká fakulta, katedra ekologie a životního prostředí, tř. Svobody 26, 771 46 Olomouc, Česká republika