2,2,2-Tribromo-
N
-phenylacetamide
B. Thimme Gowda,a* Sabine Foro,b P. A. Suchetanaand Hartmut Fuessb
a
Department of Chemistry, Mangalore University, Mangalagangotri 574 199, Mangalore, India, andbInstitute of Materials Science, Darmstadt University of Technology, Petersenstrasse 23, D-64287 Darmstadt, Germany
Correspondence e-mail: [email protected]
Received 7 August 2009; accepted 19 August 2009
Key indicators: single-crystal X-ray study;T= 299 K; mean(C–C) = 0.029 A˚; Rfactor = 0.079;wRfactor = 0.237; data-to-parameter ratio = 11.0.
In the title compound, C8H6Br3NO, the N—H bond isantito
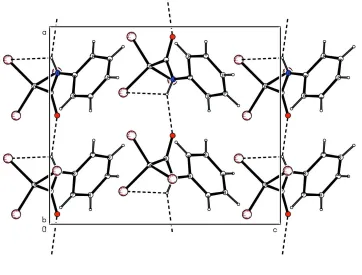
the carbonyl bond in the side chain. The N—H hydrogen atom is involved in a two-centered bond as it shows simultaneous N—H Br intra- and N—H O intermolecular interactions in the structure. In the crystal, molecules are packed into column-like chains along the b axis through the N—H O hydrogen bonds.
Related literature
For the preparation of the compound, see: Gowdaet al.(2003). For related structures, see: Brown et al. (1966); Dou et al.
(1994); Gowdaet al.(2007, 2009).
Experimental
Crystal data
C8H6Br3NO Mr= 371.87
Orthorhombic,Pca21 a= 10.1863 (8) A˚
b= 9.1483 (7) A˚
c= 11.8856 (9) A˚
V= 1107.59 (15) A˚3
Z= 4
CuKradiation = 13.22 mm1 T= 299 K
0.500.180.13 mm
Data collection
Enraf–Nonius CAD-4 diffractometer
Absorption correction: scan (Northet al., 1968)
Tmin= 0.037,Tmax= 0.178
2653 measured reflections
1311 independent reflections 1237 reflections withI> 2(I)
Rint= 0.052
3 standard reflections frequency: 120 min intensity decay: 1.5%
Refinement
R[F2> 2(F2)] = 0.079
wR(F2) = 0.237 S= 1.05 1311 reflections 119 parameters 25 restraints
H-atom parameters constrained
max= 1.86 e A˚
3
min=1.18 e A˚
3
Absolute structure: Flack (1983), 276 Friedel pairs
Flack parameter: 0.00 (13)
Table 1
Hydrogen-bond geometry (A˚ ,).
D—H A D—H H A D A D—H A
N1—H1N O1i
0.86 2.19 2.967 (13) 150 N1—H1N Br1 0.86 2.68 3.123 (13) 114 Symmetry code: (i)x1
2;yþ1;z.
Data collection:CAD-4-PC(Enraf–Nonius, 1996); cell refinement:
CAD-4-PC; data reduction:REDU4(Stoe & Cie, 1987); program(s) used to solve structure: SHELXS97(Sheldrick, 2008); program(s) used to refine structure: SHELXL97 (Sheldrick, 2008); molecular graphics:PLATON(Spek, 2009); software used to prepare material for publication:SHELXL97.
BTG thanks the Alexander von Humboldt Foundation, Bonn, Germany, for resumption of his research fellowship.
Supplementary data and figures for this paper are available from the IUCr electronic archives (Reference: FL2260).
References
Brown, C. J. (1966).Acta Cryst.21, 442–445.
Dou, S., Gowda, B. T., Paulus, H. & Weiss, A. (1994).Z. Naturforsch. Teil A, 49, 1136–1144.
Enraf–Nonius (1996).CAD-4-PC. Enraf–Nonius, Delft, The Netherlands. Flack, H. D. (1983).Acta Cryst.A39, 876–881.
Gowda, B. T., Paulus, H., Svoboda, I. & Fuess, H. (2007).Z. Naturforsch. Teil A,62, 331–337.
Gowda, B. T., Svoboda, I., Foro, S., Suchetan, P. A. & Fuess, H. (2009).Acta Cryst.E65, o1955.
Gowda, B. T., Usha, K. M. & Jayalakshmi, K. L. (2003).Z. Naturforsch. Teil A, 58, 801–806.
North, A. C. T., Phillips, D. C. & Mathews, F. S. (1968).Acta Cryst.A24, 351– 359.
Sheldrick, G. M. (2008).Acta Cryst.A64, 112–122. Spek, A. L. (2009).Acta Cryst.D65, 148–155.
Stoe & Cie (1987).REDU4. Stoe & Cie GmbH, Darmstadt, Germany.
Acta Crystallographica Section E Structure Reports Online
supporting information
Acta Cryst. (2009). E65, o2226 [doi:10.1107/S160053680903298X]
2,2,2-Tribromo-
N
-phenylacetamide
B. Thimme Gowda, Sabine Foro, P. A. Suchetan and Hartmut Fuess
S1. Comment
The structure of (I) has been determined (Fig. 1) as part of a study on the effect of ring and side chain substituents on the
structures of N-aromatic amides (Dou et al., 1994; Gowda et al., 2007, 2009). The N—H bond in (I) is anti to the C=O
bond in the side chain, similar to that observed in N-(phenyl)acetamide (Brown, 1966),
2,2,2-trichloro-N-(phenyl)-acetamide (Dou et al., 1994), 2,2,2-trimethyl-N-(phenyl)2,2,2-trichloro-N-(phenyl)-acetamide (Gowda et al., 2007) and other amides (Gowda et al.,
2009). The N—H hydrogen atom is involved as the donor in a two-centered bond; an intramolecular N—H···Br bond and
an intermolecular N—H···O bond (Table 1). The N1—H1N···O1 bonds involved in the formation of molecular chains in
the direction of the b-axis are shown Fig. 2.
S2. Experimental
The title compound was prepared from aniline, tribromoacetic acid and phosphorylchloride according to the literature
method (Gowda et al., 2003). The purity of the compound was checked by determining its melting point. It was further
characterized by recording its infrared spectra. Single crystals of the title compound used for X-ray diffraction studies
were obtained by a slow evaporation from petroleum ether at room temperature.
S3. Refinement
The H atoms were positioned with idealized geometry using a riding model [N—H = 0.86 Å, C—H = 0.93 Å]. All H
atoms were refined with isotropic displacement parameters (set to 1.2 times of the Ueq of the parent atom).
The Uij components of C2, C3, C4 and C5 were restrained to approximate isotropic behavoir.
The residual electron-density features are located in the region of Br3 and Br1. The highest peak is 1.25 Å from Br3 and
Figure 1
Molecular structure of (I), showing the atom labelling scheme. Displacement ellipsoids are drawn at the 50% probability
level and H atoms are represented as small spheres of arbitrary radii.
Figure 2
Molecular packing of (I) with hydrogen bonds shown as dashed lines.
2,2,2-Tribromo-N-phenylacetamide
Crystal data
C8H6Br3NO
Mr = 371.87
Orthorhombic, Pca21
Hall symbol: P 2c -2ac
[image:3.610.126.488.326.601.2]Z = 4 F(000) = 696
Dx = 2.230 Mg m−3
Cu Kα radiation, λ = 1.54180 Å Cell parameters from 25 reflections
θ = 4.8–20.7° µ = 13.22 mm−1 T = 299 K Needle, colourless 0.50 × 0.18 × 0.13 mm
Data collection
Enraf–Nonius CAD-4 diffractometer
Radiation source: fine-focus sealed tube Graphite monochromator
ω/2θ scans
Absorption correction: ψ scan (North et al., 1968)
Tmin = 0.037, Tmax = 0.178
2653 measured reflections
1311 independent reflections 1237 reflections with I > 2σ(I)
Rint = 0.052
θmax = 67.0°, θmin = 4.8°
h = −12→0 k = −10→10 l = −11→14
3 standard reflections every 120 min intensity decay: 1.5%
Refinement
Refinement on F2
Least-squares matrix: full
R[F2 > 2σ(F2)] = 0.079
wR(F2) = 0.237
S = 1.05 1311 reflections 119 parameters 25 restraints
Primary atom site location: structure-invariant direct methods
Secondary atom site location: difference Fourier map
Hydrogen site location: inferred from neighbouring sites
H-atom parameters constrained w = 1/[σ2(F
o2) + (0.1659P)2 + 2.9656P]
where P = (Fo2 + 2Fc2)/3
(Δ/σ)max = 0.002
Δρmax = 1.86 e Å−3
Δρmin = −1.18 e Å−3
Extinction correction: SHELXL97 (Sheldrick,
2008), Fc*=kFc[1+0.001xFc2λ3/sin(2θ)]-1/4
Extinction coefficient: 0.0035 (8)
Absolute structure: Flack (1983), 276 Friedel pairs
Absolute structure parameter: 0.00 (13)
Special details
Geometry. All e.s.d.'s (except the e.s.d. in the dihedral angle between two l.s. planes) are estimated using the full covariance matrix. The cell e.s.d.'s are taken into account individually in the estimation of e.s.d.'s in distances, angles and torsion angles; correlations between e.s.d.'s in cell parameters are only used when they are defined by crystal symmetry. An approximate (isotropic) treatment of cell e.s.d.'s is used for estimating e.s.d.'s involving l.s. planes.
Refinement. Refinement of F2 against ALL reflections. The weighted R-factor wR and goodness of fit S are based on F2,
conventional R-factors R are based on F, with F set to zero for negative F2. The threshold expression of F2 > σ(F2) is used
only for calculating R-factors(gt) etc. and is not relevant to the choice of reflections for refinement. R-factors based on F2
are statistically about twice as large as those based on F, and R- factors based on ALL data will be even larger.
Fractional atomic coordinates and isotropic or equivalent isotropic displacement parameters (Å2)
x y z Uiso*/Ueq
C1 0.2439 (16) 0.3139 (13) 0.6091 (14) 0.057 (3)
C2 0.1483 (19) 0.2891 (18) 0.6869 (19) 0.078 (4)
H2 0.0753 0.3500 0.6914 0.094*
C3 0.162 (3) 0.169 (3) 0.761 (3) 0.110 (7)
H3 0.1010 0.1557 0.8185 0.132*
C4 0.256 (3) 0.077 (2) 0.751 (2) 0.095 (5)
C5 0.3521 (19) 0.1043 (17) 0.6774 (19) 0.079 (4)
H5 0.4247 0.0427 0.6773 0.095*
C6 0.3495 (16) 0.2176 (13) 0.6019 (17) 0.065 (4)
H6 0.4153 0.2297 0.5484 0.078*
C7 0.3328 (12) 0.5181 (14) 0.5056 (12) 0.053 (3)
C8 0.3002 (15) 0.6556 (17) 0.4339 (16) 0.069 (4)
N1 0.2341 (10) 0.4331 (11) 0.5359 (12) 0.058 (2)
H1N 0.1579 0.4526 0.5085 0.069*
O1 0.4489 (8) 0.5008 (11) 0.5332 (12) 0.076 (4)
Br1 0.1668 (3) 0.6121 (3) 0.3197 (2) 0.0988 (9)
Br2 0.2294 (3) 0.80125 (17) 0.5320 (2) 0.1007 (10)
Br3 0.4497 (2) 0.7263 (3) 0.3550 (3) 0.1230 (14)
Atomic displacement parameters (Å2)
U11 U22 U33 U12 U13 U23
C1 0.049 (6) 0.064 (7) 0.059 (8) −0.012 (6) −0.003 (6) 0.003 (6)
C2 0.075 (8) 0.080 (7) 0.079 (8) −0.011 (6) 0.014 (7) 0.021 (6)
C3 0.112 (11) 0.110 (9) 0.108 (11) −0.016 (8) 0.014 (9) 0.020 (8)
C4 0.106 (9) 0.085 (7) 0.095 (10) −0.013 (8) −0.013 (8) 0.014 (7)
C5 0.082 (8) 0.069 (6) 0.087 (9) −0.002 (6) −0.016 (7) 0.004 (6)
C6 0.060 (8) 0.052 (6) 0.083 (10) 0.004 (5) −0.022 (7) 0.001 (6)
C7 0.038 (5) 0.066 (6) 0.054 (7) 0.001 (4) 0.005 (5) 0.017 (6)
C8 0.057 (8) 0.068 (7) 0.081 (11) 0.014 (6) 0.006 (7) 0.020 (7)
N1 0.037 (5) 0.068 (5) 0.068 (7) 0.005 (4) −0.007 (5) 0.008 (6)
O1 0.035 (4) 0.085 (6) 0.109 (10) −0.008 (4) −0.007 (5) 0.042 (7)
Br1 0.1101 (17) 0.1157 (14) 0.0705 (12) −0.0051 (11) −0.0328 (12) 0.0179 (10)
Br2 0.164 (2) 0.0664 (9) 0.0719 (12) 0.0155 (10) 0.0171 (14) 0.0000 (8)
Br3 0.0680 (11) 0.1321 (19) 0.169 (3) 0.0095 (10) 0.0356 (14) 0.091 (2)
Geometric parameters (Å, º)
C1—C2 1.36 (3) C5—H5 0.9300
C1—C6 1.39 (2) C6—H6 0.9300
C1—N1 1.399 (19) C7—O1 1.237 (16)
C2—C3 1.42 (3) C7—N1 1.321 (16)
C2—H2 0.9300 C7—C8 1.555 (18)
C3—C4 1.27 (4) C8—Br3 1.902 (16)
C3—H3 0.9300 C8—Br2 1.913 (17)
C4—C5 1.34 (4) C8—Br1 1.960 (19)
C4—H4 0.9300 N1—H1N 0.8600
C5—C6 1.37 (2)
C2—C1—C6 119.3 (15) C5—C6—C1 116.9 (18)
C2—C1—N1 120.1 (15) C5—C6—H6 121.6
C6—C1—N1 120.6 (15) C1—C6—H6 121.6
C1—C2—C3 118.7 (19) O1—C7—N1 125.5 (11)
C3—C2—H2 120.6 N1—C7—C8 117.5 (11)
C4—C3—C2 122 (3) C7—C8—Br3 111.9 (9)
C4—C3—H3 119.2 C7—C8—Br2 108.1 (11)
C2—C3—H3 119.2 Br3—C8—Br2 111.4 (9)
C3—C4—C5 119 (2) C7—C8—Br1 111.3 (11)
C3—C4—H4 120.3 Br3—C8—Br1 106.4 (9)
C5—C4—H4 120.3 Br2—C8—Br1 107.6 (7)
C4—C5—C6 123.6 (18) C7—N1—C1 125.0 (11)
C4—C5—H5 118.2 C7—N1—H1N 117.5
C6—C5—H5 118.2 C1—N1—H1N 117.5
C6—C1—C2—C3 2 (3) N1—C7—C8—Br3 −159.7 (12)
N1—C1—C2—C3 −179.1 (19) O1—C7—C8—Br2 −100.0 (14)
C1—C2—C3—C4 −5 (4) N1—C7—C8—Br2 77.2 (16)
C2—C3—C4—C5 8 (4) O1—C7—C8—Br1 142.1 (13)
C3—C4—C5—C6 −7 (4) N1—C7—C8—Br1 −40.7 (17)
C4—C5—C6—C1 4 (3) O1—C7—N1—C1 4 (3)
C2—C1—C6—C5 −2 (2) C8—C7—N1—C1 −173.4 (14)
N1—C1—C6—C5 179.6 (15) C2—C1—N1—C7 139.6 (18)
O1—C7—C8—Br3 23.1 (19) C6—C1—N1—C7 −42 (2)
Hydrogen-bond geometry (Å, º)
D—H···A D—H H···A D···A D—H···A
N1—H1N···O1i 0.86 2.19 2.967 (13) 150
N1—H1N···Br1 0.86 2.68 3.123 (13) 114