1876-6102 © 2017 The Authors. Published by Elsevier Ltd. This is an open access article under the CC BY-NC-ND license (http://creativecommons.org/licenses/by-nc-nd/4.0/).
Peer-review under responsibility of the scientific committee of the 8th International Conference on Applied Energy. doi: 10.1016/j.egypro.2017.03.552
Energy Procedia 105 ( 2017 ) 1883 – 1888
ScienceDirect
The 8
thInternational Conference on Applied Energy
–
ICAE2016
Control optimization of combined cooling and power system with prime mover
of solid oxide fuel cell-gas turbine for building application
X.J. Luo
a*, K.F. Fong
baDepartment of Architecture and Civil Engineering, College of Science and Engineering, City University of Hong Kong, Hong Kong, China b
Division of Building Science and Technology, College of Science and Engineering, City University of Hong Kong, Hong Kong, China
Abstract
This paper presents a control strategy for a combined cooling and power (CCP) system using a prime mover of solid oxide fuel cell (SOFC) with bottoming cycle of gas turbine (GT) for building application. Dynamic simulation model of the CCP system was developed in TRNSYS 17, and the control strategy was developed for year-round operation in response to the changing climatic and loading conditions. The capacity ratio of cells in operation; the ratio of exhaust heat delivered to GT; and the ratio of cooling load shared between absorption and compression chillers were chosen as the decision variables in the control strategy. In order to minimize the system energy consumption, particle swarm optimization (PSO) was constructed in MATLAB and coupled with TRNSYS 17 for control optimization. It was found that with the proposed control strategy, the yearly energy saving of the SOFC-GT CCP system would be 6.89% compared to the reference case.
© 2016 The Authors. Published by Elsevier Ltd. Selection and/or peer-review under responsibility of ICAE
Keywords: SOFC; Gas turbine; Combined cooling and power; Particle swarm optimization; Control optimization.
1. Introduction
Combined cooling and power (CCP) system has been proven to be an energy-efficient approach for providing cooling and electricity in building application [1-3]. Solid oxide fuel cell (SOFC) is a high-temperature prime mover with electrical efficiency above 40% and operating temperature around 1000 qC[4]. Bottoming cycle such as gas turbine (GT) can be energized by the high-grade waste heat from the exhaust flue gas of SOFC and used for additional electricity generation. After the bottoming cycle, the hot exhaust can still be used to drive absorption chiller for cooling generation. This would enhance both electrical and overall efficiencies of the CCP system. However, previous studies only focus on the system design and performance analysis, no control optimization was implemented for the year-round dynamic operation.
In the SOFC-GT CCP system investigated, SOFC and GT would share the electrical load, while two types of chillers, the absorption and compression chillers would share the cooling load. Since electrical efficiency of GT and coefficient of performance (COP) of both types of chillers decline in part load operation, it leads to a complex interaction among the prime mover, the bottoming cycle and the chillers in the changing building loads. Therefore, it is worth developing a control strategy to optimize the electricity and cooling load allocation, and ultimately minimize the energy consumption of the entire CCP system. As such, the objectives of this study are to develop an appropriate control strategy for operation optimization of the SOFC-GT CCP system, also to evaluate the effectiveness of the proposed system for building application from a year-round perspective.
2. Development of system model and control strategy
* Corresponding author. Tel.: +852-6584-9728; fax: +852-3442-0443. E-mail address: [email protected].
© 2017 The Authors. Published by Elsevier Ltd. This is an open access article under the CC BY-NC-ND license (http://creativecommons.org/licenses/by-nc-nd/4.0/).
Nomenclature
AbC Absorption chiller C Capacity (kJ·h-1) in Inlet CCP Combined cooling and power D Demand (kJ·h-1) is Isentropic CoC Compression chiller E Energy (kJ) N Nominal GT Gas turbine h Enthalpy (kJ·kg-1) out Outlet HX Heat exchanger m Mass flow rate (kg· h-1)
PSO Particle swarm optimization P Electrical power (kJ·h-1) γ Ratio of specific heats SOFC Solid oxide fuel cell r Expansion ratio η Electrical efficiency
T Temperature (qC)
x Heat ratio
The system model of SOFC-GT CCP was built on the component-based dynamic simulation platform TRNSYS 17 [5] and coupled with MATLAB [6], which contained the developed control strategy to minimize the yearly energy consumption of the CCP system.
[image:2.544.56.483.67.169.2]2.1 System configuration
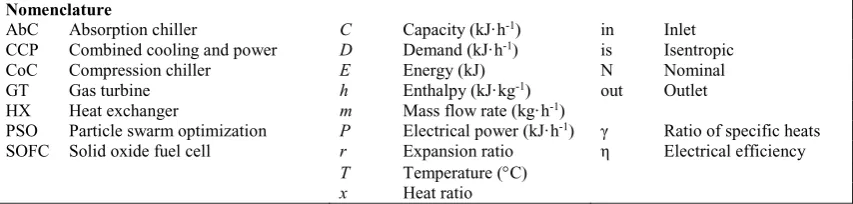
Fig. 1 shows the schematic design of the SOFC-GT CCP system, which was used to serve a 30-storey reference office building in the subtropical Hong Kong. The CCP system was mainly composed of a cluster of SOFC, a GT, pre-heaters, an air compressor, a fuel compressor, a reformer, a heat exchanger (HX), a burner, an absorption chiller (AbC), a compression chiller (CoC), an auxiliary air heater and the associated parasitic equipment. The building zone was served by air handling unit containing supply air fan and coil.
In the SOFC-GT CCP system, fuel and air were compressed, pre-heated and pre-reformed in fuel compressor, air compressor, pre-heaters and reformer, respectively. After that, fuel reacted electrochemically with air in the SOFC to generate electricity to the building zone. The unreacted fuel was burnt in the burner and the hot exhaust flue gas was used to supply heat for reformer and pre-heaters before passing to the GT. The hot exhaust after the bottoming cycle would pass to HX in which hot water was delivered to energize the absorption chiller. The compression chiller was adopted to supplement the total cooling capacity. Auxiliary air heater was used to provide heat to the absorption chiller when the exhaust heat from bottoming cycle was not enough. Typical operating temperatures of the SOFC-GT CCP system are also presented in Fig. 1.
In order to demonstrate the effectiveness of the SOFC-GT CCP system, two reference systems were constructed: the SOFC CCP system and the sole SOFC system. The SOFC CCP system was similar to the SOFC-GT CCP system, the only difference was no bottoming cycle of GT and the exhaust flue gas after the pre-heaters would directly pass through the HX. Therefore, electricity load was solely provided by SOFC in the SOFC CCP system. Another reference system, the sole SOFC system, was similar to the SOFC CCP system, except that the air compressor, the fuel compressor, the HX, the absorption chiller and the associated parasitic equipment were not included. In other words, the sole SOFC system was simply used to generate electricity for the building, and the cooling load was fully provided by the compression chiller in a conventional way.
2.2 GT model
The isentropic efficiency of GT is a function of the mass flow rate and it decreases in part load operation. An empirical equation from [7] was used in this study, and the thermodynamic model of GT was built as follows:
ηis,GT = (hin,GT – hout,GT) / (hin,GT – hout,s,GT) (1)
Tout,s,GT = Tin,GT (1/r)(γ-1)/γ (2)
PGT = mGT (hin,GT – hout,GT) (3)
where ηis,GT is the isentropic efficiency, hin,GT and hout,GT are the inlet and outlet turbine enthalpies (kJ·kg-1), respectively, hout,s,GT is the outlet enthalpy assuming isentropic expansion (kJ·kg-1). Tin,GT is the inlet turbine temperature (qC), Tout,s,GT is the outlet temperature assuming isentropic expansion (qC), r is the expansion ratio, and γ is ratio of specific heats of combustion gases. PGT is the electrical power of GT (kJ·h-1), and mGT is the mass flow rate of combustion gases in GT (kg·h-1).
Fig. 1. Schematic design of the SOFC-GT CCP system.
input heat rate to the nominal input heat rate as:
x = Qin,GT/QN (4)
where Qin,GT and QN are the operating and nominal input heat rates of GT (kJ
·
h-1), respectively. With thethermodynamic model of GT, the correlation between x and PGT can be calculated as:
PGT = -0.0064x4 + 0.014x3–0.0071x2 + 0.001x – 10-5 (5)
2.3 Details of other component models
In this study, the SOFC model introduced in [8] was used, it was assumed that the SOFC worked at constant voltage and electrical efficiency. The manufacturing data of absorption chiller and compression chiller were based on [9]. Each chiller was equipped with the corresponding chilled water pump, cooling water pump and cooling tower. Methane was used as fuel for both the SOFC and the auxiliary air heater. It was also assumed that the air compressor, the fuel compressor, the pre-heaters, the reformer, the burner and HX operated at constant efficiencies. The reference office building had 30 stories with area of 200 m2/floor. The building zone was developed according to the details
covered in [9].
2.4 Formulation of control strategy
2.4.1 Objective function
Total energy consumption was chosen to develop the objective function. Since the fuel methane was only supplied to the SOFC and the auxiliary air heater, the total energy consumption E (kJ
)
can be calculated as:E = (QSOFC + QAH) ∆t (6)
where QSOFC and QAH are energy consumption rates of SOFC and auxiliary air heater, respectively (kJ
·
h-1), ∆t is thetime step (h).
2.4.2 Decision variables Water
25 qC Methane 25 qC Air 25 qC
Pre-heater
Pre-heater
Pre-heater
Reformer
SOFC
BurnerCooling water pump
Cooling tower Absorption chiller Compression chiller HX Cooling tower Fuel compressor 5 C Water pumpfor reformation GT
Air compressor Cooling water pump Chilled water pump Chilled water pump Building zone Supply air coil Supply air fan Electricity supply Cooling supply Exhaust
To the associated parasitic equipment
Supply air valve 230 qC
182 qC
25 qC
800 qC
800 qC 800 qC
800 qC
886 qC
886 qC
1037 qC
T 436 qC 886 qC
998 qC 945 qC
913 qC
There were three decision variables (or optimization variables) in this optimization problem for the SOFC-GT CCP system, namely the capacity ratio of cells in operation a, the ratio of exhaust heat delivered to GT b, and the ratio of cooling load shared between absorption and compression chillers c. These decision variables are developed as follows:
a = CSOFC /CSOFC,N (7)
Qin,GT = b (QSOFC – CSOFC – Qpre-heater – Qreformer) (8)
where CSOFC and CSOFC,N are the hourly operating and nominal capacities of SOFC (kJ·h-1), respectively. Qpre-heater is the total heat consumption of the three pre-heaters. Qreformer is the heat consumption of reformer.
CAbC = (1 – c)D (9)
CCoC = cD (10)
where D is the hourly cooling demand (kJ·h-1). CAbCandCCoCare operating hourly cooling capacity of absorption chiller and compression chiller, respectively (kJ·h-1).
2.4.3 Constraints
The constraints consisted of the indoor condition, the bounds of decision variables and the energy balance relationships. The indoor condition is to maintain the dry-bulb air temperature not higher than 26 qC. For the decision variables a, b and c, their bounds [0,1]. The energy balance relationships cover the balance between the electricity supply of SOFC-GT and the building electricity demand as reflected in Eq. (11); while the balance between the heat consumption of absorption chiller and the heat supplies from the exhaust flue gas and the auxiliary air heater as indicated in Eq. (12):
CSOFC + CGT = Plight + Plift + Poff-equip + PCoC + Pair-comp + Pfuel-comp + Ppara-equip (11)
where Plight, Plift, Poff-equip, PCoC, Pair-omp, Pfuel-comp and Ppara-equip are hourly electricity consumption of lighting, lift, office equipment, compression chiller, air compressor, fuel compressor, and parasitic equipment (like pumps, fan, cooling tower, etc.) respectively (kJ·h-1). CGT is the hourly operating capacity of GT (kJ·h-1).
QAbC = ηHX (QSOFC – CSOFC – Cgt) + ηAH QAH (12)
where ηHX and ηAH are efficiencies of the HX and the auxiliary air heater, respectively. QAbC is the heat consumption of absorption chiller (kJ·h-1).
2.5 System parameters
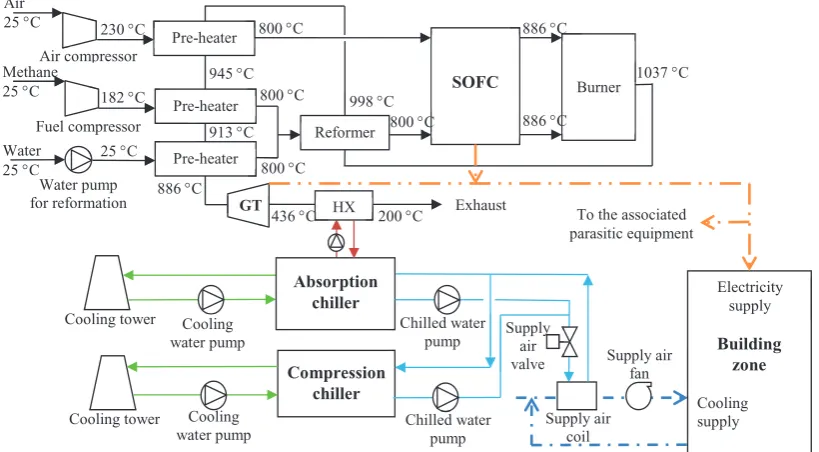
[image:4.544.59.480.486.586.2]The major parameters used for the CCP system design and PSO are given in Table 1. The other parameters were set according to [9].
Table 1. System design and PSO parameters.
2.6 Solution method
Dynamic system simulation was conducted in a simulation time step of 1 h for one year (i.e. 8760 hours) by using TRNSYS 17 and its component library TESS. In each time step, the three decision variables were optimized in order to obtain the minimum energy consumption of the SOFC-GT CCP system and the reference SOFC CCP system. The
Parameter of CCP system Value Parameter of PSO Value
Electrical efficiency of SOFC (%) 44 Population size 100
SOFC voltage (V) 0.73 Maximum number of iterations 100
Expansion ratio of GT 7 Cognitive parameter 1
Efficiency of pre-heater (%) 98 Social parameter 3
Efficiency of reformer (%) 90 Constriction factor 1
Efficiency of air/fuel compressor (%) 93 Efficiency of auxiliary air heater (%) 98
weather data of typical meteorological year of Hong Kong was used. Particle swarm optimization (PSO) was adopted since PSO is a robust algorithm in handling engineering problems [10]. PSO was constructed in MATLAB and coupled with TRNSYS 17 for this control optimization.
3. Results and discussion
3.1 Determination of capacities of SOFC, GT and chillers
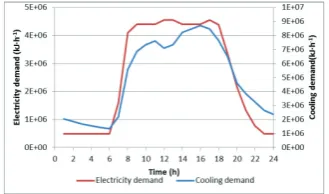
The design capacity of SOFC was determined in a way that it was enough to satisfy the peak electricity and cooling demands of the office building. Fig. 2 depicts the load profiles of design day, with the peak cooling load of 8.7×10⁶
kJ·h-1 and the simultaneous electricity demand of 4.6×10⁶ kJ·h-1. If the cooling demand was satisfied by either
absorption or compression chiller, and the electricity demand was fully provided by SOFC, then the nominal capacities of SOFC, absorption/compression chiller were determined to be 6.3×10⁶ kJ·h-1 and 8.7×10⁶ kJ·h-1,
respectively. Meanwhile, the capacity of GT was 1.5×10⁶ kJ·h-1, which was determined by the condition of exhaust
heat for full capacity operation of SOFC.
3.2 Performances of control strategy
[image:5.544.304.467.216.310.2]Fig. 3 illustrates the effectiveness of the control strategy to optimize the operation of SOFC-GT CCP system during the peak cooling demand on the design day. It is seen that the PSO can determine the minimum energy consumption effectively and the search convergence is found after about the 40 iterations. Fig. 4 summarizes the hourly results of the decision variables a, b and c of SOFC-GT CCP and SOFC CCP systems on the design day. It is seen that the operating time for a of SOFC-GT CCP system set at 1 was less than that of SOFC CCP system. It was because part of the electricity load could be supplied by GT in SOFC-GT CCP system. On the other hand, it is noted that b was generally equal or close to 1 in SOFC-GT CCP system. This showed that it was preferable for GT to operate around the full load condition due to its inherently low part-load efficiency. It is also observed that the operating time for c of SOFC-GT CCP system set at 1 was longer than that of SOFC CCP system. Actually, the yearly average values of c of SOFC-GT CCP and SOFC CCP systems were 0.910 and 0.629, respectively. It is because more electricity was produced in SOFC-GT CCP system, hence the compression chiller could handle more cooling load rather than the absorption chiller.
[image:5.544.86.251.217.314.2]Fig. 2. Electricity and cooling demands on design day. Fig. 3. PSO convergence in control optimization on design day.
[image:5.544.292.470.486.593.2]Fig. 4. Decision variables of SOFC-GT/SOFC CCP systems on design day.
[image:5.544.86.264.487.591.2]3.3 Year-round performance analysis
With the implementation of the control strategy, it was found that the yearly energy consumption of the SOFC-GT CCP system was 5.133×10¹⁰ kJ·year-1. Compared to those of the two reference cases, 5.378×10¹⁰ kJ·year-1of the SOFC CCP system and 5.513×10¹⁰ kJ·year-1 of the sole SOFC system, the yearly energy savings of the SOFC-GT CCP system would be 4.6% and 6.9%, respectively. By using GT as bottoming cycle, the overall electrical efficiency of the SOFC-GT CCP system would be increased. Besides, since the compression chiller could share more cooling load, it had better utilization, thus higher COP operation.
In order to demonstrate the effectiveness of control strategy implemented in the SOFC-GT CCP system, the year-round profile of the indoor dry-bulb air temperature of the building zone is shown in Fig. 5. It is seen that the temperature could be kept well below 26 °C, in particular the summer period between 2,881 and 6,552 hours (i.e. from May to September in the subtropical Hong Kong). This shows that the control strategy is useful to deploy the prime mover and the bottoming cycle, as well as the absorption the compression chillers, in providing electricity and cooling for the office building.
4. Conclusion
In this study, a control strategy for the SOFC-GT CCP system was developed for office building application in the subtropical climate. Dynamic simulation model was built in TRNSYS 17 and coupled with PSO in MATLAB for control optimization. It was found that the yearly energy saving of the SOFC-GT CCP system would be 6.9% against the sole SOFC system, as well as 4.6% against the SOFC CCP system. The 3 decision variables, the capacity ratio of cells in operation; the ratio of exhaust heat delivered to GT; and the ratio of cooling load shared between absorption and compression chillers, are useful in control optimization of the SOFC-GT CCP system.
Acknowledgements
This work described in this paper is fully supported by a grant from the Research Grants Council of the Hong Kong Special Administrative Region, China (Project No. CityU 11200315).
References
[1] Ondeck AD, Edgar TF, Baldea M. Optimal operation of a residential district-level combined photovoltaic/natural gas power and cooling system.
Applied Energy 2015;156:593-606.
[2] Han W, Chen Q, Lin RM, Jin HG. Assessment of off-design performance of a small-scale combined cooling and power system using an alternative operating strategy for gas turbine. Applied Energy 2015;138:160-8.
[3] Wang J, Wang J, Zhao P, Dai Y. Thermodynamic analysis of a new combined cooling and power system using ammonia–water mixture. Energy Conversion and Management 2016;117:335-42.
[4] Wu DW, Wang RZ. Combined cooling, heating and power: a review. progress in energy and combustion science 2006;32:459-95. [5] TRNSYS 17: A Transient System Simulation Program. Solar Energy Laboratory University of Wisconsin, Madison, USA. [6] MATLAB and Statistics Toolbox Release 2012b, The MathWorks, Inc., Natick, Massachusetts, United States.
[7] Jüdes M, Vigerske S, Tsatsaronis G. Optimization of the design and partial-load operation of power plants using mixed-integer nonlinear programming. Optimization in the Energy Industry 2009:193-220.
[8] Baghernejad A, Yaghoubi M, Jafarpur K. Optimum power performance of a new integrated SOFC-trigeneration system by multi-objective exergoeconomic optimization. International Journal of Electrical Power & Energy Systems 2015;73:899-912.
[9] Fong KF, Lee CK. Investigation on zero grid-electricity design strategies of solid oxide fuel cell trigeneration system for high-rise building in hot and humid climate. Applied Energy 2014;114:426-33.
[10]Wang LF, Singh C. Stochastic combined heat and power dispatch based on multi-objective particle swarm optimization. International Journal of Electrical Power & Energy Systems 2008;30:226-234.
Biography
X. J. Luo is a Ph.D candidate studying in Department of Architecture and Civil Engineering of City University of Hong Kong. Her research interest is trigeneration system, dynamic modeling and control strategy development. She aims at developing an effective and efficient control strategy for complex trigeneration systems.