I
The Association between Accruals, Economic Value
Added, and Cash Value Added and the Market
Performance of UK and US Firms
Ahmed Mushref Al-Omush
A thesis submitted in Partial Fulfilment of the requirements
of the Faculty of Business and Law of the University of the
West of England, Bristol for the degree of
DOCTOR OF PHILOSOPHY
I
DECLARATION
This work has not been previously accepted in substance for any degree and is not being concurrently in candidature for any degree.
Signed.…………...……… (Candidate)
Date.…………...………...
STATEMENT 1
This thesis is the result of my own investigations except where otherwise stated. Other sources are acknowledged by footnotes giving explicit references. A bibliography is appended.
Signed.…………...……… (Candidate)
Date.…………...………...
STATEMENT 2
I hereby consent for the thesis, if accepted, to be available for photocopying and inter-library loan, for the title and summary to be available to outside organisations.
Signed.…………...……… (Candidate)
II
Abstract
The main purpose of this thesis is to provide statistical evidence on the value relevance of a set of selected performance measures, to measure the performance of companies according to the traditional accrual measures and value added measures, and finally, to assess their information content and incremental information content. The study covers a sample of 986 UK companies listed in the London Stock Exchange (LSE) with an active share during the period 1990 to 2012.1 This thesis also provides evidence on the long-term impact of adopting economic value added (EVA) by 89 US companies on a set of important firm decisions, namely, the investing, financing and operating decisions. The time horizon of this analysis spans the period 1960 -2012.
The empirical evidence indicates that all the performance measures used in this thesis have a significant association with stock prices and returns. In addition, the results also reveal that when applying the price model, cash flows from operation (CFO) has the highest explanatory power among the variables considered. The remaining performance measures regarding their value relevance are in the following order: earnings before interest, tax, depreciation and amortization (EBITDA), earnings before interest and tax (EBIT), net income (NI), earnings before extra ordinary items (EBEI), cash value added (CVA) and EVA. Furthermore, the results show that EBITDA dominates other variables when the return model is used.
With regard to the incremental information content, there is significant evidence of the existence of incremental information content between paired measures. The best combination was between CFO and EBITDA and the lowest exists when NI is paired with EBEI. Furthermore, this study provides empirical evidence on the incremental information content of EVA and NI components with regard to explaining the variation in the annual stock return.
The final task involves the examination of the adoption of EVA as a performance incentive scheme and management tool. The results show that EVA firms outperform their matching firms and the market portfolio S&P500 index. In addition, it is found that adopting EVA significantly affects the adopting firm’s potential investing and financing and operating decisions. Several modifications to the model by Wallace (1997) are proposed. However, the results obtained regarding the long-term effects of EVA adoption are mixed regardless of the model applied. In particular, the new investment decision is the only one in the direction of Wallace (1997).
1
III
DEDICATION
IV
Acknowledgement
I would like to express my sincere thanks to my supervisor, Professor Cherif Guermat for his dedicated supervision, positive advice, support, valuable suggestions, constructive criticism, and continued encouragement that played a crucial role in the completion of this thesis. Also, my appreciation goes to my second supervisor Dr. Ismail Ufuk Misirlioglu for his thoughtful advice, encouragement, and useful information that enhanced this thesis.
My special appreciation and thanks are due also to Professor Jon Tucker, Dr. Salima Paul and Dr. Osman Yukselturk for their valuable suggestions and guidance. Notably worth thanking are the staffs of the Faculty of Business and Law at the University of the West of England. I am grateful to my colleagues for their valuable help especially my best friend Vasco Vendrame. I am grateful to all friends and colleagues especially Dr. Amer Al Shyshani, Dr. Fadi Al Shiyyab and Dr. Adel Masarwah for their support and encouragement. In addition my appreciation goes to Mr. Chris Foggin who helped me with the proofreading.
I would like to convey my special, deepest and honest appreciation to my friend Nayif Al Gaber for his assistance and concern. I would also like to thank my sponsor, The Hashemite University, for taking care of all my financial needs.
I am indebted to my father, for his love, patience and encouragement. This study would not have been completed without the support and encouragement of all members of my extended family.
Last but not least, my gratitude goes to my wife and children for being there to
make this possible.
Above all, I thank Allah, without Whom nothing is
V
List of Contents
Subject
Page
Author’s Declaration ……… I
Abstract ……….… II
Dedication ……….………..……… III
Acknowledgements...………... IV
List of Contents ……… V
List of Tables ……… VIII
List of Figures ……….. XI
List of Abbreviations ……… XII
List of Appendices ……… XVII
Chapter One: Introduction to the Research
11.1 Research Background --- 1
1.2 Motivation of the Research --- 6
1.3 Purpose of the Research --- 7
1.4 Contribution of the Research --- 8
1.5 Scope of the Research --- 9
1.6 Research Structure --- 9
Chapter Two: Literature Review
12 2.1 Introduction --- 122.2 Theory of performance measure --- 16
2.2.1 Theory of compensation --- 17
2.2.2 Characteristics of performance measures --- 23
2.2.3 The information content theory --- 26
2.2.4 The incremental information content --- 28
2.3 Previous studies --- 33
2.3.1 General overview of performance measures --- 33
2.3.1.1 Reconciliation of performance measures --- 34
2.3.2 Accruals versus cash flows measure --- 38
2.3.3 Value-based measure and residual income method --- 42
2.3.3.1 The validity of performance measure’s component--- 44
2.3.3.2 Performance measurement of productive activity ---- 47
VI
2.3.3.4 Modification of EVA as a performance measure --- 53
2.3.3.5 Individual focus of value-based measures --- 55
2.3.3.6 Cash value added as a performance measure --- 57
2.3.3.6.1 CVA versus EVA --- 61
2.4 Summary --- 63
Chapter Three:
Research Design and Methodology 653.1 Introduction --- 65
3.2 Development of hypothesis --- 65
3.2.1 Traditional measures versus cash flows and value added measures 71 3.2.1.1 The information content model--- 74
3.2.1.2 The incremental information content --- 81
3.2.2 Earnings versus earnings’ components --- 82
3.2.3 EVA versus EVA’s components --- 84
3.3 Hypotheses test--- 88
3.4 Variables measurement and definition --- 88
3.4.1 Controlling variables --- 91
3.5 Sample selection --- 92
3.6 Summary --- 93
Chapter Four: The value Relevance of Performance Measures
94 4.1 Introduction --- 944.2 Descriptive statistics --- --- 95
4.3 The relative information content of performance measures --- 98
4.4 The incremental information content of performance measures --- 102
4.4.1 The incremental information content of net income components 105 4.4.2 The incremental information content of EVA components ---- 110
4.5 Empirical results of the return model --- 117
4.6 Conclusion --- 124
Chapter Five: The impacts of Adopting Economic Value Added
(EVA) on Stock performance
1265.1 Introduction --- 126
5.2 Previous studies --- 128
VII
5.4 Methodology --- 138
5.5 Cumulative return results --- 144
5.6 Buy and Hold Return Results --- 156
5.7 Testing the Aggregate Abnormal Returns --- 163
5.8 Conclusion --- 167
Chapter Six: The impacts of adopting Economic Value Added
(EVA) on adopters’ potential decisions
169 6.1 Introduction --- 1696.2 The Wallace Study --- 170
6.3 Sample Selection --- 171
6.4 Methodology --- 172
6.4.1 The Wallace approach --- 173
6.4.2 A modified Approach (MODIF 1) --- 174
6.4.3 Test based on direct use of the control firms (MODIF 2) - 175 6.5 Empirical Results --- 180
6.6 Conclusion --- 198
Chapter Seven: Findings, Conclusion and Recommendation
203 7.1 Introduction --- 2037.2 Main research findings --- 203
7.2.1 Findings for the value relevance and incremental information content of performance measures --- 204
7.2.2 Findings for the main components of NI and EVA --- 205
7.2.3 Findings for the effects of adopting EVA --- 206
7.3 Research conclusion --- 208
7.4 Research contributions and recommendations --- 209
7.5 Research limitations --- 210
7.6 Future research --- 212
Bibliography
--- 213VIII
List of Tables
Table 2.1: Main valuation methods ……… 14
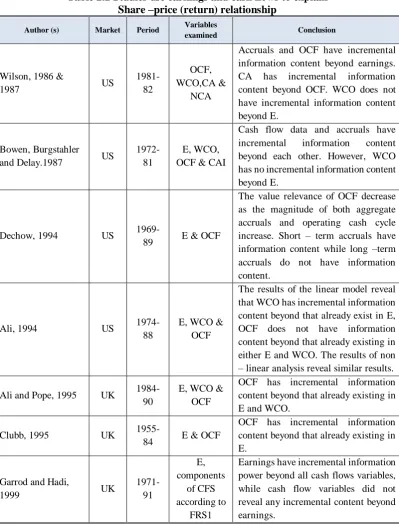
Table 2.2: Studies use earnings and cash flows to explain share-price (return) relationship ………. 32
Table 3.1: Distinctive features of deductive and inductive approaches ….. 66
Table 4.2.1: Selective descriptive statistics on the dependent and independent variables / pool data ……… 97
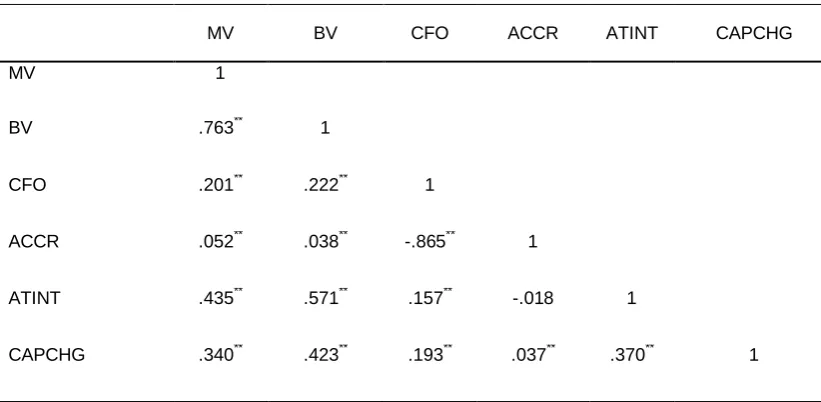
Table 4.2.2: Pair-wise correlation for all the variables ……… 97
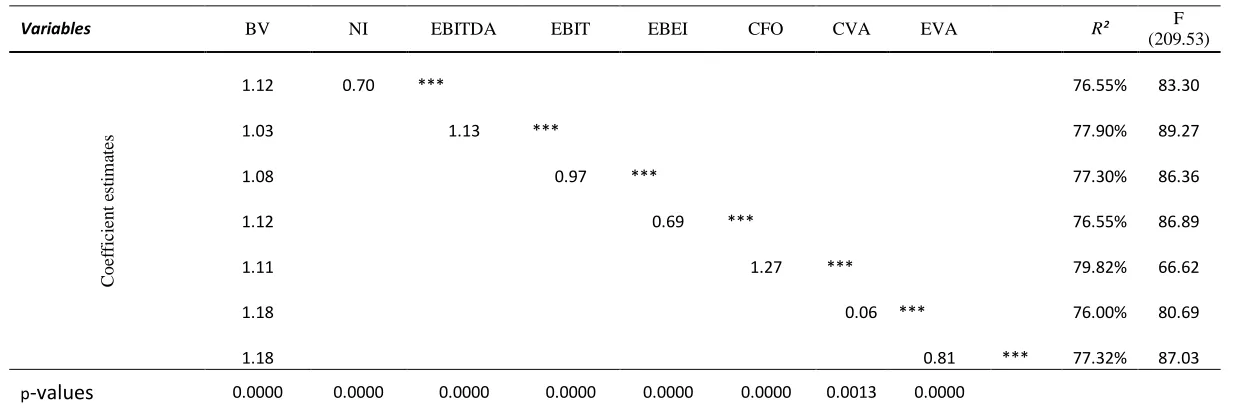
Table 4.3.1: Test results of the relative information content of independent variables using the panel data fixed effects model Undeflated Variables ……….. 100
Table 4.3.2: Test results of the relative information content of independent variables using panel data fixed effects model Variables deflated by Outstanding Share Number ……….. 101
Table 4.4.1: The Incremental Information Content of Performance Measures 103
Table 4.4.1: Descriptive statistics on the Net Income components …………. 106
Table 4.4.2: Pairwise correlation for Net Income components……… 106
Table 4.4.3: Test results of the relative information content of Net Income (NI) Components ………. 109
Table 4.4.4: Panel A: Descriptive statistics on the Economic value added (EVA) components ……….. 111
Table 4.4.5: Test results of the relative information content of Economic value added (EVA) Components ……… 114
Table 4.4.6: Tests of incremental information content of EVA ………. 115
Table 4.4.1: The Incremental Information Content of Economic value added (EVA) components ……….. 116
Table 4.5.1: Test results of the relative information content of independent variables using the Return Model and panel data fixed effects model (Time Effects). Variables are used in levels ………. 119
IX
Table 4.5.3: Test results of the relative information content of independent variables using return model and panel data fixed effects model
(Time Effects). Variables are used in changes …………. 122
Table 4.5.4: Test results of the relative information content of independent variables and BV using the return model and panel data fixed effects model (Time Effects). Variables are used in changes …. 123 Table 5.3: EVA Adopting companies 1987-2001 (USA)……… 135
Table 5.4: Codes and descriptive of delisting codes ……….. 144
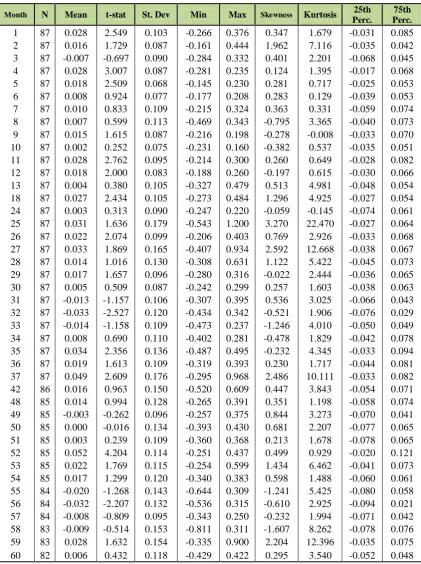
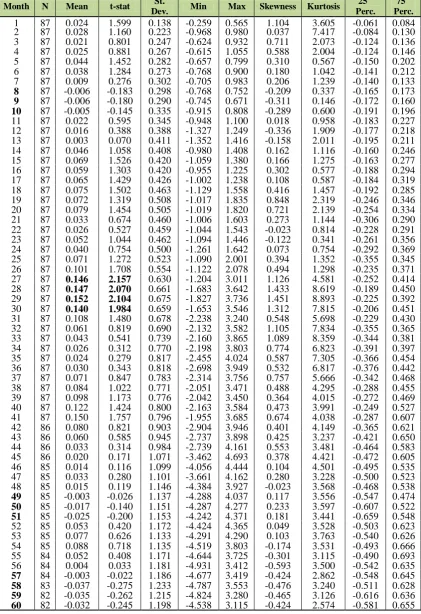
Table 5.5.1: Summary statistics for adopter firm return ………. 147
Table 5.5.2: Summary statistics for matching firms return……….. 148
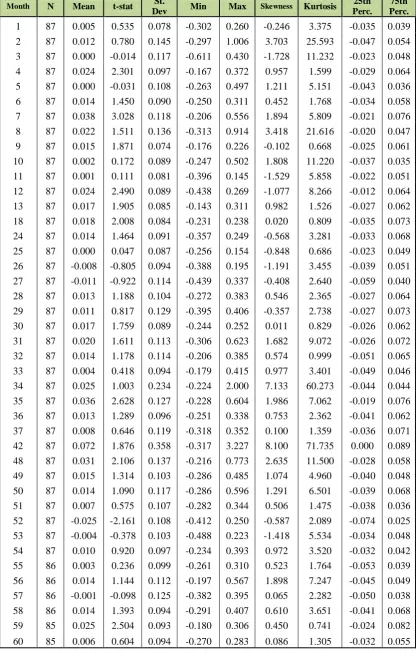
Table 5.5.3: Matching firm based abnormal returns (AR) ………. 149
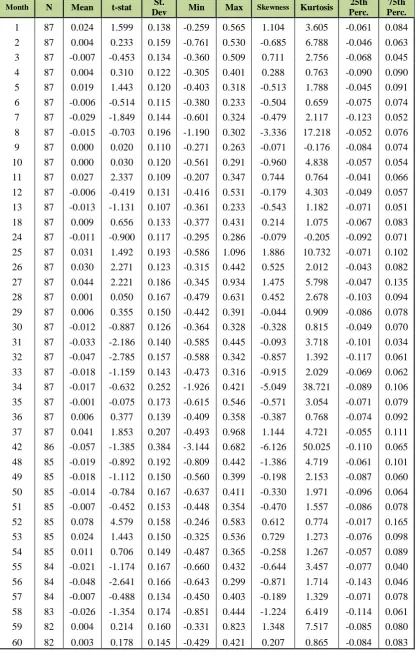
Table 5.5.4: Matching firm based cumulative abnormal returns (CAR) …… 150
Table 5.5.5: Summary statistic for market returns (S&P500) ……… 153
Table 5.5.6: Market benchmark based abnormal return ………. 154
Table 5.5.7: Market benchmark based cumulative abnormal return ………. 155
Table 5.6.1: Summary Statistic for BH: EVA adopter BH returns…………... 157
Table 5.6.2: Summary Statistic for BH: Match firm BH returns……….. 158
Table 5.6.3: Summary Statistic for BHAR Match firms……….. 159
Table 5.6.4: Summary Statistic for BH: Market returns ……….. 160
Table 5.6.5: Summary Statistic for BHAR: Using the market portfolio as a benchmark ……… 161
Table 6.4.1: Selected descriptive statistics on dependent and independent variable ……… 179 Table 6.5.1: Investing decisions (Wallace’s Model, Equation 6.2) ………. 182
X
Table 6.5.3: Investing decisions (New Model, Equation 6.4) ………. 185
Table 6.5.4: Financing decisions (Wallace’s Model, Equation 6.2) ……… 189
Table 6.5.5: Financing decisions (New Model, Equation 6.3) ……… 190
Table 6.5.6: Financing decisions (New Model, Equation 6.4) ……… 191
Table 6.5.7: Operating decisions (Wallace’s Model, Equation 6.2) ……. 195
Table 6.5.8: Operating decisions (New Model, Equation 6.3) ………….... 196
Table 6.5.9: Operating decisions (New Model, Equation 6.4) ……… 197
XI
List of Figures
Figure 2.1: Calculation of CVA --- 58
Figure 3.1: Components of economic value added (EVA) --- 85
Figure 5.3: Adoption date --- 133
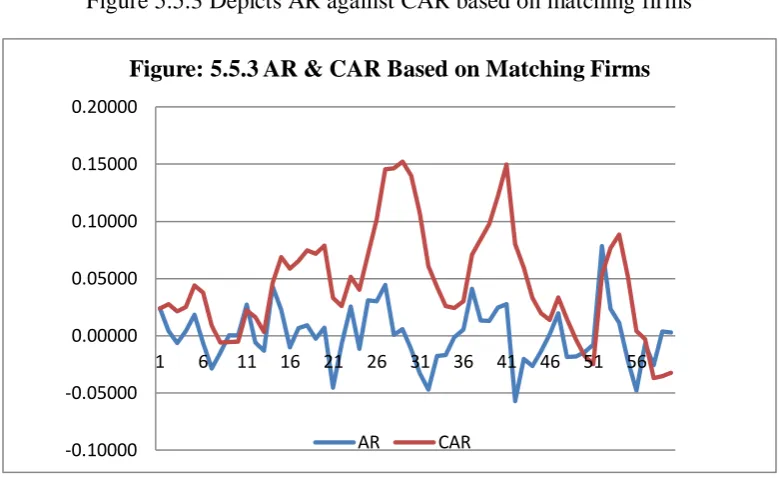
Figure 5.5.3: Depicts AR against CAR based on matching firms --- 151
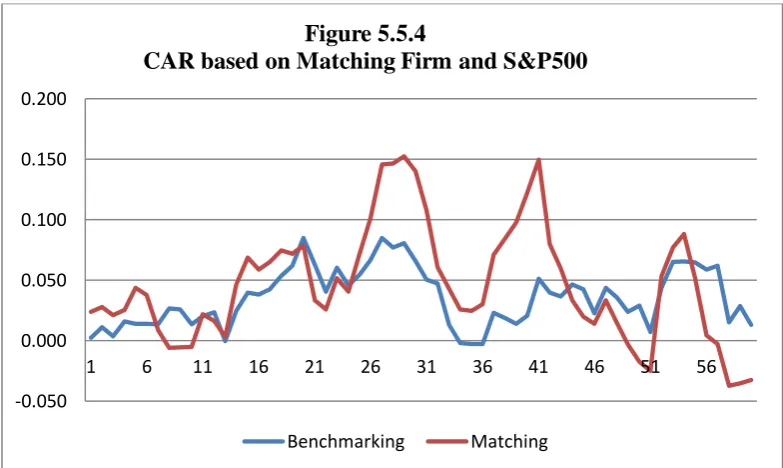
Figure 5.5.4: CAR based on matching firms and S&P500 --- 152
Figure 5.6.2: BHAR, CAR distribution using matching firms --- 162
Figure 5.6.3: BHAR, CAR distribution using benchmark market (S&P500) 162 Figure 5.6.3: BHAR distribution using matching firms and benchmark (S&P500) --- 163
Figure 5.7.1: Bootstrap BHAR using bench mark portfolio --- 164
Figure 5.7.2: Bootstrap BHAR using matching firms --- 165
Figure 5.7.3: Bootstrap CAR using bench mark portfolio --- 165
XII
List of Abbreviations
ACC Accruals
C Change in Cash and Short-term Marketable Securities
∆AP Changes in Accounts payable
∆AR Changes in Accounts Receivable
∆INV Changes in Inventory
ABC Activity-Based Costing System
AcctAdj Accounting adjustments
ADJ Adjustments
AMORT Amortisation
APV Adjusted Present Value
AR Abnormal Return
ATInt After Tax Interest
BHAR Buy and Hold Abnormal Return
BHR Buy Hold Return
BV Book Value
CA Current Asset
CAI Cash Flows After Investment
CAPCH Capital Charge
CAPM Capital Asset Pricing Method
CAR Cumulative Abnormal Return
CC Capital Charge
XIII
CFAI Cash Flows after Investment
CFF Cash Flows from Financing Activities
CFI Cash Flows from Investing Activities
CFO Cash Flows from Operations
CFS Cash Flows Statement
CML Capital Market Line
CVA Cash Value Added
DCF Discounted Cash Flows
DD Dividends
DEP (DP) Depreciation
E Earnings
EARN Earnings
EBDIT Earnings Before Depreciation, Interest and Tax
EBEI Earnings Before Extraordinary Items
EBIT Earnings Before Interest and Tax
EBITDA Earnings Before Interest Tax Depreciation and Amortization
EBO Edward-Bell-Ohlson Model
ECF Equity Cash Flows Method
ED Economic Depreciation
EP Economic Profit
EPS Earnings per Share
EVA Economic Value Added
FASB Financial Accounting Standards Board
XIV
FEM Fixed Effects Model
FIFO First in First out Inventory Evaluation Method
FRS Financial Report Standards
GAAP General Accepted Accounting Principles
I Interest
IAS International Accounting Standards
IASB International Accounting Standard Board
IC Invested Capital
IFC International Financial Corporation
IFRS International Financial Reporting Standard
IPO Initial Public Offering
LIFO Last in First out Inventory Evaluation Method
LIM Linear Information Model
LSE London Stock Exchange
LSPD London Share Price Database
M Materials and Services Purchased
MAR Annual Stock Returns
MV Market Value
MVA Market Value Added
MVE Market Value of Equity
NCA Nun-Current Asset
NCF Net Cash Flows
NI Net Income
XV
NIDPR Net Income plus Depreciation and Amortisation
NOPAT Net Operating Profit after Tax
NPV Net Present Value
NVA Net Value Added
OCFD Operating Cash Flows Demand
OI Operating Income
OIADJ Operating Income Adjustment
OLS Ordinary Least Squares
OM1 Ohlson Model One
OM2 Ohlson Model Two
OP Operating Profit
OCF Cash Flows From Operations
OTHER Other Accruals
PER Price-Earnings Ratio
RE Retained Earnings
REVA Refined Economic Value Added
RI Residual Income
RIM Residual Income Method
ROA Return on Assets
ROE Return on Equity
ROI Return on Investment
ROS Return on Sales
S Sales
XVI
T Tax
TA Total Assets
UCAI Unexpected Cash Flows After Investment
VA Value Added
VBM Value Based Measures
W Wages
WACC Weighted Average Cost of Capital
WCFO Working Capital from Operations
XVII
List of Appendices
Page
Appendix 1 Full 60 months event period for all cases --- 223
Appendix 2 The full version of the bootstrap test tables --- 231
1
Chapter 1
Introduction
1.1
Background
The measurement of a firm’s performance is a crucial issue to its stakeholders, especially its shareholders, directors, managers and debtors. Changes in a firm’s performance can be detrimental to its health, its profitability and ultimately its survival. The concept of maximizing shareholder wealth has been one of the driving forces in the change in current management practice. This is the wealth that is traditionally gauged by either a standard accounting magnitude such as profits, earnings and cash flow from operations or various financial statement ratios (e.g. earnings per share, returns on assets, and investment and equity). Managers, shareholders and other interested parties then use this financial statement information to assess and predict current and future performance.
Over the past decades, considerable attention has been paid to the relationship between accounting numbers and firm value. This attention to the relationship between theoretical firm value and the performance stream has attracted considerable researcher interest and resulted in a number of proprietary models being introduced. Ball and Brown’s research in 1968 was the first to discuss the information content of accounting numbers. They measured the association between annual earnings (cash flows from operations) and the abnormal return using the operating earnings as proxy for operating cash flows and they reported that earnings showed a higher correlation with abnormal stock return than cash flows.
2
attention has been paid to new financial performance measures as substitutes for traditional accounting-based measures.
However, after the cash flow statements gained the attention of the International Accounting Standard Board (IASB) more studies have been conducted to examine the incremental information content of cash flows over earnings (Finger, 1994; Clubb, 1995; Barth et. al, 2001). These studies concluded that cash flows have information content, but they reported mixed results regarding the incremental information content of cash flows over earnings. However, these studies did not attempt to investigate the role of aggregate accruals.
As there are no conclusive results regarding the usefulness of earnings and cash flow items, neither the accrual earnings, nor the cash flow items, were perfect methods for measuring management performance as an approach to evaluating the whole firm (shareholder wealth) (Bowen et al., 1987; Charitou et al., 2001). Nevertheless the bulk of empirical evidence indicates that the superiority of cash flow measures versus earnings (as variously defined) has not been demonstrated.
Management decisions – particularly the investment, financing, and operating decisions – affect shareholder value through their influence on such value drivers as value growth duration profit margin for the cash flows from operations or the cost of capital. The criterion has long persisted that in order for a company to create value and to generate wealth it must earn more than it costs (cost of capital employed) by way of debt and equity. The added value concept has been promoted strongly in performance measurement literature. This notion is historically referred to as the residual income (RI) method (a value added measure).
3
measures that shareholders used over a long period to guide and evaluate their investments are inefficient. This is a sufficient reason for shareholders and investors to contemplate other performance metrics, ones which may be objective and not manipulated. The best known example (at least from an EVA supporter’s viewpoint) is perhaps the developed version of the residual income method: the Economic Value Added or EVA model of Stern Stewart (1991).
EVA, as a periodic performance measure, was introduced by Stern and Stewart to replace earnings and cash flows from operations as a measure of performance. Stewart (1994, p.75) argued that ‘EVA stands well out from the crowd as the single best measure of value creation on a continuous basis’. In addition to this he also remarks that ‘EVA is almost 50% better than its closest accounting-based competitor (i.e. earnings), in explaining changes in shareholder wealth’ (p.75). EVA is defined as the profit earned by the firm less the cost of financing the firm’s capital. It is similar to RI but adjusted for net operating profit after tax (NOPAT) and invested capital where needed. It is also referred to as net operating profits less a charge for the opportunity cost of invested capital (West and Worthington, 2000).
Scholars have different points of view regarding the usefulness of economic value added (EVA) measures in explaining the variation of stock price performance. Thus as seen to date, the literature provides several studies questioning the claimed superiority of EVA to earnings and other performance metrics. Biddle et al., (1997) claim that both earnings before interest and tax (EBIT), and the residual income (RI) have the higher adjusted and outperform EVA in explaining variation in stock performances. Similarly, Lehn and Makhija (1997) argue that in spite of it having a higher correlation with stock return among the other performance measures, EVA and market value added (MVA) are not the most efficient metrics to evaluate a firm’s performance. Cahan et al., (2002) contend that EVA is the best reward system as it better aligns the interests of
4
Stewart’s claims that EVA is the only metric that best measures firms’ and manager performance.
However, as a result of the criticisms the traditional and value added measures have faced, particularly the earnings and economic value added (EVA). And also in response to the arguments rose by Young (1999) towards the Stern and Stewart adjustment. The adjustment that mainly intends to produce a modified version of the EVA measure that probably has the ability to mitigate the drawbacks of accrual based measures and in its essence is similar to cash flows measure, researchers have begun to rethink new performance measures that can better capture the performance of firms and managers.
In response, Ottosson and Wiessenrider (1996) proposed a new performance measure titled, cash value added (CVA)2 to replace the traditional accounting and value added measures, specifically the periodic measure EVA. They defined CVA as the difference between operating cash flows (OCF) and operating cash flows demand (OCFD). The first component basically represents the earnings before depreciation, interest and tax (EBDIT) adjusted for non-cash charges, working capital movements and non-strategic investments. The second component refers to investors’ capital cost, which is mainly the interest and dividends.
However, an empirical question arises here. Which measure has the better association with the stock return/ price? Unfortunately, the empirical literature to date suggests that there is no single accounting based measure upon which one can rely to explain changes in shareholder wealth.
The question that has received much concern in market-based accounting research is the relative information content of alternative performance measures (e. g. EVA, CVA, earnings, EBITDA, and cash flows). In evaluating various performance metrics, the criterion used must take into consideration the objective of a particular performance measure (Kothari, 2001). An important purpose of cash flow statements is that cash flow data are helpful in assessing the amount, timing, and uncertainty of future cash flows.
2
5
The majority of prior empirical studies have used the association with share price or stock return as the criterion to evaluate the different performance measures. Implicitly, the main assumption of share price studies is that in an efficient market, share prices reflect information about expected future cash flows (future benefits). However, this assumption has been challenged by market "anomalies". For instance, the results of Sloan (1996) indicate that investors appear to focus on earnings and investors were incapable of considering the differential persistence of their cash flows and accruals components. Thus, there is the opportunity that the share-price studies’ results may be affected by the possibility that the market is concentrating on bottom line earnings (the market is not efficient). In this context, Bernard (1995) described the limitation of share-price studies: "Preclude from the outset the possibility that researchers could ever disco ver so met hing t hat was not already known by t he market" (p. 735).
The value-relevance studies that investigate the empirical relation between stock market values, changes in values and different accounting numbers are important disciplines for accountant research. The price and return models are the most popular valuation methods in accounting literature (Barth et al., 2001). According to Christie (1987) both models are economically equivalent since they were derived from the same source which is the linear information model introduced by Ohlson (1995). This implies that the main inferences drawn from the two approaches should be the same- at least at the theoretical level.
6
variation in stock price performances. These performance measures are net income available to common shareholders (NI), earnings before interest, tax, depreciation and amortization (EBITDA), earnings before interest and tax (EBIT), earnings before extraordinary items (EBEI), net cash flows from operations (CFO), cash value added (CVA) and economic value added (EVA).
1.2
Motivation of the Study
Each time researchers investigate the association between different performance measures and the stock price (return) they arrive at different points of view regarding the superiority and ability of these metrics in explaining the variations of stock price (return) performances. However, they fell through because they could not assign the optimal and perfect accounting measure that better gauges the performances of firms and executive management (Lehn and Makhija, 1997; Barton et al, 2010).
Lee (1996, p. 32), for example, argues that ‘the search for a superior measure of firm valuation is a, if not the, key feature of contemporary empirical finance: For years, investors and corporate managers have been seeking a timely and reliable measurement of shareholders’ wealth. With such a measure, investors could spot over or underpriced stocks, lenders could gauge the security of their loans and managers could monitor the profitability of their factories, divisions and firms’.
7
Another powerful motivation for this research is that it intends to be the first research that utilises UK data to examine the value relevance of the new residual income method: the cash value added (CVA), a title coined by the Boston consulting group, to provide evidence on its ability to outperform other performance measures, namely the economic value and traditional accounting metrics.
1.3
Purpose of the Research
The main objectives of the study are:
To empirically investigate the association between a comprehensive set of performance measures and the stock price (return) performances to indicate which of these measures are better at explaining the variation in stock performance and have the ability to evaluate the management performances and the whole company performances. These measures are the traditional accounting measures: net income (NI); earnings before interest, tax, depreciation and amortization (EBITDA); and earnings before extraordinary items (EBEI). There is also the cash flows measure: cash flows from operation (CFO), the value added measures (residual income method) economic value added (EVA), and cash value added (CVA). This is achieved by employing a fixed effects model and running six regressions against the selected metrics. The dependent variable is the three month closing stock price following the reporting day and stock return respectively. The set of independent variables is constructed from the review of extant literature.
To empirically examine the incremental information content of the selected set of performance measures.
8
To utilise the event study methodology to examine the impact of adopting EVA as a compensation plan and management tool on the performance of US firms after the adoption date. The BHAR and CAAR are the aggregation methods used. This includes comparing the performance of event firms to that of both the matching firms and benchmark portfolio index, the S&P500.
To extend the work of Wallace (1997) by proposing three econometric models to investigate the long-terms effects of EVA adoption on US firms’ material decisions. These are the investing, financing and operating decisions which it is claimed would increase the value of the company.
1.4
Contribution of the Study
This research will contribute to prior UK studies in three major respects:
I. Unlike previous research, it will employ UK data for the selected period and adopt a unified econometrics model to examine and test the association of a set of performance measures, being the focus of past literature, and the variation in annual stock price performances. From the research point of view, this will eliminate the controversies embedded in the findings of previous UK and US studies regarding the use of different samples and econometric models to conduct their research (Garrod et al., 2000). Furthermore, this research will extend its goal to test for the incremental information content of earnings and EVA main components and examine whether any of these components has a greater contribution to the association between the prime performance measures and annual price performance.
9
III. In response to the adjustments Stern and Stewart applied to NOPAT and the capital employed, the main figures need to compute EVA, which aims to produce a performance measure that is equivalent to cash flows and less subject to the distortions of accrual accounting (Young, 1999). This research will contribute and enhance the theoretical aspect of the research with a broad empirical study of UK literature by using cash value added (CVA) as an alternative performance measure (initially proposed by Ottosson and Weissenrieder, 1997) and investigate its association with annual stock price performance and test whether CVA contains more information content than other performance measures.
IV. It will extend the work of Wallace (1997) by introducing three alternative models that the current research expect will more effectively capture the long term effects of adopting EVA as a compensation and management tool by different US firms.
1.5
Scope of the Research
The current research uses the empirical approach to fulfil its aims. The sources of data are DataStream, CRSP and Compustat. The data drawn from UK industrial companies will be used to run the empirical test. This study will cover the period from 1990 to 2012.
Furthermore, in order to empirically test the impacts of adopting the EVA compensation scheme on the treatment companies’ potential investment, a sample of 89 US firms over the period from 1960 to 2012 were selected. The sources of data are Compustat and CRSP.
1.6
Research Structure
Apart from this introductory chapter the thesis is organized into six main chapters:
10
also devoted to the discussion of certain economic theories in terms of its relation to the topic under investigation. These are the compensation theory, the information content theory and the incremental information content theory. Finally, this research will discuss and review the literature which has already been conducted in terms of the association between traditional measures, cash flows and value added measures and variations in stock price (return) performances.
Chapter Threediscusses the research methodology commencing with the review of the research design which included identifying the hypothesis development process and then addressing the research questions which follow the review of the literature. Following this the models adopted in the research will be introduced. These are the price model and the return model. The final part looks at the hypotheses of the research. The research methodology chapter discusses the main research variables, including their definitions and calculation.
The sample frame, the sample size, and the controlling variables are also discussed. In addition, the chapter discusses the procedures of measuring and ascertaining the reliability and relevancy of research variables. Finally, the chapter briefly discusses the statistical analyses tests that will be used in the research and which are explained in-depth in the next chapter.
Chapter Four develops tests for the hypotheses developed in Chapter Three and reports on the main body of results for the study. The value relevancy and incremental information content of performance measures will be evaluated by assessing their ability in explaining the variation in stock performances.
The results for the fixed effects models are reported in this chapter. These results provide evidence on the relative ability of net income (NI) versus the cash flows and accrual components and the relative information content of Economic value added (EVA) versus cash flows, accruals and other components.
11
the BHAR aggregation approaches are used to conduct the event study test. Furthermore it sheds light on the statistical properties of returns, abnormal returns and aggregate abnormal returns, BHAR and CAR, and the empirical results obtained.
Chapter Six extends the empirical test begun in chapter five. It replicates the same model applied by Wallace (1997). Three modifications were proposed to extend the original work of Wallace. First it is modified by introducing the market return index (S&P500) as a control variable to replace the change in ownership in Wallace’s original model. Second, a model is proposed that uses levels rather than differences. Third, a modified model is proposed that uses abnormal measures of dependent and independent variables. It then describes the sources of data and the collection process in terms of the set of variables used. Empirically, it tests the effects of adopting EVA on firms’ potential decisions taken to maximize the shareholders wealth, namely the investment, financing and operating decisions.
12
Chapter 2
Literature Review
2.1 Introduction
The delegation of management from investors to executive managers is one of the most important agency relationships in finance. Typically, the literature focuses on joint stock corporations with a large number of shareholders who delegate power to managers. These managers effectively control the company. Understandably, the appropriate compensation for these managers is an important topic of debate among practitioners and academics. On the other hand, there has been increasing pressure on managers to maximise shareholders’ wealth (Sharma, 2010).
The evaluation of a company’s performance is considered one of the most important challenges to researchers (Kaplan and Norton, 1992). This issue is becoming increasingly important to shareholders, and has been the subject of heated debates. To foster shareholders’ interest, managers adopt strategies to increase the value of their organisation, which leads to maximising shareholder wealth through the optimum allocation of resources. In order to assess whether managers are performing well, researchers and practitioners need to use appropriate measurements. Scholars have developed specific criteria relating to the validity, relevance, accountability, and globalism of the performance measure(s) that are used to assess managers’ or companies’ performance (Rappaport, 1986). Unfortunately, there is no general agreement as to which criterion is most suitable and accurate as far as the evaluation of the managers’ performance is concerned.
13
the validity of the released accounting information used later by various parties to assess the firm. Third, the selected performance measure should preserve accountability. This means that managers and executives will be responsible for those activities and investment decisions they have control over. The fourth criterion is the globalisation of the performance measure. The idea is that a firm does not work in isolation from other firms in the same industry or manufacturing segment. Consequently the performance measure should be able to maintain comparability between competitive firms within the same industry. Finally, the performance measure should be easily understandable by internal and external parties. It should be understood by the managers that the endorsement and selection of any performance measure means it will be used later to assess their performances (Bouckaret et al., 2010).
Generally, any research design that aims to evaluate a firm’s performance should adopt a valuation model that provides a better link between the firm’s value and the firm’s specific characteristics. Of particular importance is the link between a firm’s value and accounting figures. Researchers have used a wide diversity of valuation models, ranging from the very simple to the most sophisticated (Ball and Brown, 1968; Patell and Kaplan, 1977; Dechow, 1994, and Biddle et al., 1997). The main valuation models can be classified into four groups as shown in Table 2.1: balance sheet based (book value of equity); income statement based; value creation methods; and options (Fernandez, 2002). Obviously, there are practical considerations, such as the availability of information that may constrain the decision maker’s choice of performance measurement method.
14
Table 2.1 Main Valuation Methods
Balance sheet Income
statement Mixed (Goodwill)
Discounted Cash flows
Value
creation Options
Book value Multiples Classic valuation Free cash
flows EVA Black & Scholes
Adjusted book value PER
Union of European accounting Experts Equity cash flows Economi c profit Investment option
Sales Dividends CVA Expand projects Liquidation value P/EBITD
A Abbreviated income Capital cash flows Delay the investment Substantial value Other
multiples Others APV CFROI Alternative uses Multiples: Multiplying production capacity (sales) by a ratio
EVA: Economic value added PER: price-earnings ratio CVA: Cash value added
P/EBITDA: Price per earnings before interest, tax, and depreciation and amortization APV: Adjusted present value
CFROI: Cash flows return on investment
Source:Demirakos, Strong and Walker (2004), Fernandez, 2002.
Unlike the adjusted book value the liquidation method represents the value of a company when its assets are sold in the market and all of its debts are paid off. Finally, the substantial value method represents the replacement value which is defined as the amount of money an identical firm needs to invest in order to establish a company that is similar to the company being valued.
Similarly, the income statement methods are based solely on income statement figures (revenue, earnings, and other indicators) to evaluate companies. The common and simplest method of valuation is the value of earnings in which the company value is equal to the amount earned by multiplying net income (NI) by the price-earnings ratio
(P/E ratio). Another method of evaluation is the value of dividend (the regular cash received by shareholder) in which the equity value is the net present value of the dividends share holder expect to obtain (Francis et al., 2000). In addition to the price earnings ratio (PER), some of the frequently used multipliers are: price/sales ratio, price/EBITDA, and the value of the company/operating cash flows, the market situation is the main criterion to choose between these different multipliers.
15
(Ohlson, 1995). However, this method can be classified as follows: (i) the classical method in which the company’s value is equal to its net assets plus the value of goodwill, (ii) abbreviated income method where the firm’s value is equal to the firm adjusted net worth plus the value of goodwill, and (iii) the Union of European accounting expert method (UEC) where the company’s total value is equal to its net assets plus the goodwill which, in turn, equals the excess of the cost of an acquired firm over the net values set to assets acquired and liabilities assumed3.
Another way to evaluate companies is the cash flow discounted-based method in which a firm’s value is determined by estimating future cash flows the company will generate in the future and then discounting at a proper discount rate that takes into account the risk and historic volatilities of future cash flows (Penman, 2001). According to this method a firm’s future cash flows can be obtained by different methods, starting with the free cash flow (FCF) which refers to the cash flow the company generates from operations without taking into account financial debt and capital expenditures. Closely related is the equity cash flow method (ECF) which is calculated by deducting the after tax interest and principle paid to the debtors from the FCF and adding new debt provided to the company. Thus, the capital cash flow method defines the future cash flow as the sum of debt cash flow plus equity cash flow (Penman).
The fifth evaluation method, which is discussed in-depth in the current chapter, is the value creation method that takes into their consideration the cost of capital used to generate profit. These methods are: economic value added (EVA), cash value added (CVA). All of these measures will be discussed later in this chapter.
Finally there is the real options method, the option that only exists when there are future possibilities for action. There are different types of option: expanding option when the company intended to expand its production facilities, and delay option depending on the market’s future growth. Usually the net present values (NPV) were used to evaluate these options. Basically, Black and Schole’s formula4
is the proper method to value the financial option in which the value of a call on a share, with an exercise price K and which can be exercised at time t, is the present value of its price at time t. The main assumption of this formula is that the option can be replicated (El Karouiet al., 1998).
3
As mentioned in IFRS3.
4
16
The measurement of a firm’s performance is a crucial issue to its stakeholders, especially its shareholders, directors, managers and debtors. Changes in a firm’s performance can be detrimental to its health, its profitability and ultimately its survival (Francis et al., 2003). Thus, valuation methods are tools that help identify the sources of economic value creation and destruction within the specific company (Fernandez, 2002).
For many decades accounting earnings, the accrual performance measure, had been the most popular approach to evaluate management performance. This seems to have been superseded by evaluation models based on cash flow items (Board and Day, 1989). Earnings, a traditional performance measure, has come under increasing attack over the past few years because it relies heavily on historical cost concepts and ignores the cost capital (Mehdi and Iman, 2011), and as an alternative, performance measures that take into account the cost of capital and are used to generate value have received more attention (Garvey and Milbouran, 2000; Stewart, 1991). This has encouraged researchers to examine whether the residual income method and the value added method are superior to, and more reliable than, traditional methods (Dechow et al., 1999; Rajan, 2000; Francis et al., 2003). This debate will be discussed in detail in the next section.
This chapter begins by highlighting, in Section 2.2, the main theories that have been developed to explain the value relevance of accounting numbers. We also shed light on the appropriate characteristics of a good performance measure. Section 2.3 will discuss the main results of previous studies that have investigated the value relevance of different performance measures and the association between traditional and value based performance measures with annual stock price and return. Finally Section 2.4 summarises the chapter.
2.2 Theory of Performance Measures
The use of optimal performance measures has received much attention in accounting and finance, but there is still no consensus regarding the appropriate specification. In the accounting literature, the relationship between a firm’s accounting numbers and its value is typically investigated using a number of different valuation models (Barth et al., 2001). Price and return are the most widely used proxies for value nowadays.
17
2.2.1
Theory of Compensation
Managers’ interests, in some situations, are different from those of the company’s shareholders. Furthermore, managers sometime conduct work operations and activities in a manner that benefits their own interests, especially when their remuneration scheme is linked to current earnings (short-run compensation schemes). One of the best ways of inducing top management to adopt shareholder orientation is through a compensation system tied to the shareholder value creation (Rappaport, 1986). Indeed, “the theory of market economy is, after all, based in the individuals promoting their self interest via market transaction to bring about an efficient allocation of resource” (Rappaport, p.3).
The split between the firm’s ownership and the firm’s management gives rise to a variety of “principal-agent” relationship (Berle and Means, 1932). Theoretically, shareholders, as owners of the firm, have a claim on the firm’s generated income even if they do not run their firm by themselves. For example, investors or financiers (principals) hire managers (agents) to operate the firm on their behalf as they need managers (specialized human capital) to generate profit on their investments, and managers may need the investors’ funds since they may not have enough capital of their own to invest.
18
Furthermore, when an agency relationship exists, it also tends to give rise to agency costs, which, as any other costs, reflects the value loss to shareholders, arising from divergences of desires between shareholders and corporate managers. Overall, the agency cost’s main components are the monitoring costs, bonding costs, residual loss and any other expenses the firm has to incur in order to maintain an effective agency relationship to promote managers to act in favour of the shareholders' interests (Jensen and Meckling, 1976). Theoretically, there are more than one fundamental ways the owners able to take in order to mitigate the agency problem. According to Jensen and Meckling, the principal can restrict divergences from his interest by establishing appropriate incentive schemes for the agent and paying monitoring costs designed to limit the aberrant activities of the agent. In other words, a firm (owners) has to control and monitor managers’ performance (behaviour) and reward them based upon the performance they achieved. However, these methods are effective only if the key actions taken by managers can be easily observed by shareholders; it is costly and a hard task for the shareholder to verify what the managers are actually doing or whether the managers have been behaved in proper way as assumed to be (Eisenhardt, 1989).
19
Compensation is considered one of the most material cost categories in most organisations. The efficiency with which this amount of compensation is allocated to different executive managers and targeted employees will enhance the firm performances and is likely to have a favourable impact on organisational behaviour (Gomez et al., 2010). The critical question that has raised much concern is how the use of compensation influences the behaviour of employees and decision makers, and what would the implications be for a firm’s performance (Gomez-Mejia et al., 2010). Traditionally, compensation, as an academic topic has attracted the interest of both social psychology (motivation theories) and labour economics (labour market) (Gomez et al).
The relationship between compensation and performance measures has been studied for a long time (Stewart, 1989). As a result of the way incentive schemes affect value creation within firms, many researchers (Stewart, 1991, 1994) target the heart of management motivation with performance evaluation and compensation schemes that are central to the value creation process. They contend that the most direct means of linking management’s interests with those of shareholders is to design a compensation system where the incentive portion is based on the market returns that shareholders realise.
Closely related to the last point regarding a revised managerial compensation plan and an amended internal benchmark for corporate performance, are material assumptions for implementing Stern and Stewart’s compensation system. In this context, Lehn and Makhija (1997) enrich this debate by raising the question as to which performance measure best predicts the performance of executive officers (CEOs). They claim that even though EVA appears to be a considerably more reliable indicator of CEO turnover than traditional measures, EVA and MVA are not the relevant criteria.
20
(moral hazards) will lead them to choose those efficient investments that meet the shareholder perspective.
Rogerson (1997) concludes that among the many alternative evaluation methods used to allocate the cost of investment, the preferred approach that best allocates the cost of investment and helps managers to choose the most efficient level of investment is the adoption of the developed version of the residual income method (RI), the economic value added EVA as a performance measure.
The concept of pay-for-performance is widely accepted by board members, top management, compensation consultants, and stockholders (Jensen and Murphy, 1999). However, firms may achieve their goals but at the same time suffer from declining stock values which can be easily recognised as a mismatch between performance evaluation and the measurement standards employed in the planning system. This lack of association between shareholder returns and the compensation system has triggered heated debate as to whether the performance measures adopted by the existing compensation programmes motivate executives to adopt strategies that create economic value for the shareholder.
In a related work, Gomez-Mejia et al., (2010) argue that when performance is used as a basis to distribute rewards, payment is provided for individual or group contributions to the firm’s value. “In general, a focus on performance to distribute rewards is most appropriate when the organization’s culture and national or regional cultures emphasise a performance ethos, competition among individuals and groups is encouraged” (p. 27).
Consistent with the above premise, a number of empirical studies (Wallace, 1997, 1998: Kleiman 1999: Sharma and Kumar, 2010) investigated whether the inclusion of traditional performance measures or new value-based measures such as the residual income method (implicitly EVA) would add efficiency and reliability to the compensation systems adopted and tried to show how to combine stock prices with other performance measures (at least two) to produce an optimal compensation scheme.
21
plans. His findings are consistent with what Sharma and Kumar (2010) concluded which is that in regard to the operating decisions, executive managers of a firm adopting residual income method, mainly the EVA as a compensation and management tool, will make the decisions that would increase the assets disposition and decrease the new investment. As a result “Shareholders get what they pay for” (p.205).
Wallace (1998) provides survey evidence on firms that have adopted EVA-based compensation systems. While he shows that such systems can change and enhance managerial behaviour in general, he does not afford any indication of the individual manager’s performance.
Dissatisfaction with traditional measures has triggered a heated debate among researchers (Ittner and Larcker, 1998) as to whether EVA as an alternative to traditional measures or earnings will better capture the managerial contribution to the firm’s value and whether it has a significant association with the annual stock price. Academic researchers have put potential weighting on different tools to test this association; these tools are the correlation between these variables and annual stock return (Garvey and Milbouran, 2000) and the variances of performance measures to gauge their relative accuracy.
Generally, corporate governance describes the mechanisms that help align the interests and actions of managers with shareholders’ interests and the performance-based compensation system and is a critically important mechanism of such governance
(Jensen and Murphy, 1990; Rappaport, 1986). Opinions about how to design the compensation contract differ widely among firms.
In this context, Garvey and Milbouran (2000) introduce a relatively standard principal-agent model as a different approach to address the historical debate between traditional and new performance measures. In this model the compensation scheme can be based on any set of two accounting–based performance measures and stock price rather than depending heavily on stock price alone as the optimal tool for compensation schemes. Doing this will shed light on the exact information content of each performance measure rather than on it is observable variability.
22
between these performance measures and stock return was examined. Accordingly, they claimed that the most useful measure of value-added is the percentage reduction in compensation variance when EVA is added to the wage contract. Garvey and Milbouran have estimated this reduction and the relative for over 500 US companies for the period 1986-1987 finding that EVA adds little or no value (consistent with Biddle et al., 1997). He contends that a firm’s value is determined both by managers’ efforts and choices and by other elements beyond managers’ control (randomness).
However, the model proposed by Garvey and Milbouran treat both EVA and earnings as alternative performance measures regardless of how they treat the cost of capital. Furthermore, Garvey and Milbouran introduce two unverifiable explanatory variables that are “non-contractible but which are observed by capital market investors and revealed indirectly through the stock price” (Garvey and Milbouran, 2000, p.217).
Garvey and Milbouran conclude that the accounting measure of performance (earnings) continues to explain variances in compensation even when the stock return is included as an explanatory variable and firms do not use exactly the same weightings as the stock market in determining compensation. But what is important for companies is to know the circumstances under which EVA beats earnings. Garvey and Milbouran’s paper restrict attention to the use of EVA as a measure for compensation even though the emphasis is at odds with the evidence that states that most firms use EVA for business planning and financial management purposes rather than in incentive plans. Although the contribution of Garvey and Milbouran enriched academic research with work on new performance metrics, his findings have been criticised.
In line with the argument put forward by Garvey and Milbouran, Rajan, (2000) argues that Garvey and Milbouran’s analysis mainly accommodates the assumption that the shareholders observe other variables that are not contractible. This refers to the sensitivity of the accounting metrics to changes in stock price. It is unclear how the model would work if these parameters were not observed by the market since this information is essential for specifying the weighting of the relevant contracting variables for the purposes of compensation.
23
order to make it more representative of economic earnings. For example, R&D costs might be capitalised in the EVA metric so as to capture the long-term nature of those investments (Stern, 1991), while such costs are considered a burden when computing earnings in accordance with GAAP. Garvey and Milbouran’s paper, however, makes no effort to capture any of these key institutional features. There is also no modelling of the process by which actions are transformed differentially into earnings numbers and EVA numbers.
Earnings and EVA are simplistically viewed as equivalent linear signals of some underlying component of value, with differential noise terms attached to them. In that sense, this model is potentially guilty of a "naming fallacy": what the model calls EVA could instead be expressed equivalently as “comprehensive income” or “earnings before interest, tax, depreciation, and amortisation (EBITDA)” or any other metric that is related to, yet distinct from, earnings.
Moreover, Rajan argues that Garvey and Milbouran (2000) do not actually resolve the question he sets out to answer with regard to EVA versus earnings: that is ‘does it matter which is more highly correlated with stock returns?’ In addition, as Garvey and Milbouran assumed, it seems reasonable that a consultant implementing EVA in a firm would have access to sufficient data about the metrics to obviate the need for information. His message, then, appears most relevant for the (uninformed) researcher. While this is an important constituency, it is perhaps a smaller audience than the one the author had set out to target.
In conclusion, from the highest level (executive managers) to the lowest level (unskilled hourly workers) in the pyramid, organisation members respond to how they are rewarded, and hence, the design of the compensation system influences strategic choices made by top executives as well as how those choices are eventually implemented throughout the entire firm. Coupled with the fact that pay is the most important single expense in most organisations, in the long run a firm’s performance depends on whether or not compensation is used effectively.
2.2.2
Characteristics of the Performance Measures
24
entity’s owners and the interests of shareholders, which are managed by professional managers, (or are expected to be), are considered one of the main reasons for creating performance measures.
Furthermore, shareholders try to prevent managers from using the entity’s resources for the managers’ own benefit and this will be established from the point of view of shareholders, through the creation of a performance measure which is used later for establishing a compensation system.
According to Rappaport (1986), the best compensation system is the one that aligns managers’ and shareholders’ interests. Unfortunately such alignment is difficult in the real world because conflict often exists between them.
Lambert and Larcker (1985) list at least three main types of conflict between shareholders’ interests and managers’ interests. First, managers and shareholders have different attitudes toward risk. Managers, acting only as economic agents, have a lower tolerance of risk than have shareholders. A second source of this conflict is the difference in decision-making time-horizons of managers and shareholders. Sometimes executive managers are evaluated by the board over a shorter time period than that used by shareholders for evaluating the same investment decisions. This will encourage managers to place emphasis on short term earnings rather than assess the value creation potential over the full life of the investments. The third potential conflict stems from the fact that shareholders focus on generating profit without paying any attention to costs incurred while managers try to get a pecuniary advantage for the company’s benefit.
The performance measure is considered the most fundamental requirement for both successful planning and performance evaluation, but before going through its characteristics in depth, one fact in particular should be raised here: there are many factors that affect the value of the whole company which are beyond the manager’s control (Rappaport, 1986). The manager is held responsible for only those activities that he /she can maintain control over.
25
should be verified and computed from one set of true and clear numbers and therefore not easily manipulated. Third, accountability, which is classified as the only activities that managers have control over, should be used to assess their performance. Fourth, the globalism of the performance measure: the company as a whole should be evaluated in order to assess the executive performance and should be compared with the performance of competitors within the same industry sector and similar accounting standards used by accountants in different countries to calculate the value of the performance measures. Furthermore, firms must cope with accounting standards that are enforced by different international accounting bodies (e.g. IASB) in order to maintain easy access to, and understanding of, its realised accounting and financial data by different users of financial statements, while at the firm level doing this will make it an easy task for executive managers to analyse the extent to which globalization of the region in which a firm operates affects the firms’ performance. Finally, the performance measure should be introduced in a manner that makes it easily understood by executives and top management and easily communicated to external parties, particularly the shareholders who can affect the election of the board of directors (Rappaport, 1986).
Stated equivalently, the performance metrics, in order to gain more value relevance, should consider the following factors. First, a measure should be insensitive to the choice of accounting approach- there should be free choice of accounting methods. Regardless of the accounting treatment followed by the accountants in various countries the performance measure must have the ability to accurately measure the performances under investigation. Second, the performance metric should evaluate the firm’s current decision in the light of the expected future results. Third, it should carefully consider the inherent risk associated with the firm’s decision. Fourth, the performance metric should neither penalize nor reward the decision maker for factors over which he or she has no control.
26
2.2.3
The Information Content Theory
Ball and Brown (1968, p.161) stated that “an observed revision of stock prices associated with the release of the income report would thus provide evidence that the information reflected in income numbers is useful.”
It is not easy to disclose all the information about a company and its activities in the annual report. However, the IFRS (IASB) and stock markets regulations in adopting countries force firms to release sufficient information in its annual reports (now on a quarterly basis) to help external users of the financial statements, specifically the shareholders and creditors to help decide whether or not to invest in, or lend to, a firm (the general purpose financial report standard).
The IFRS (IASB) are firmly of the view that financial reporting is not an end in itself but is intended to provide information that is useful for making business and economic decisions (Ahmed, 2004).
Thus, financial reporting is intended to provide information to help investors, creditors and other parties to assess the stewardship of the entity’s management and the amounts, timing and uncertainty of prospective cash flows to the related enterprise. The financial information released is considered to have information content if it is useful for economic decision making and it has some impact on the firm’s share price. Hence, unlike previous research, the current research will use the accounting figures needed to investigate the association of performance measures with stock price and stock returns as published in the financial lists rather than the use of proxies. The fact should be raised here that it is quite difficult to understand the information content of the accounting figures without considering the characteristics of the reliability and relevancy of this accounting information. Financial information is said to be relevant if it influences the economic decisions of users, which can be achieved by helping them to evaluate past, present, and futur