Terms and Conditions of Use of Digitised Theses from Trinity College Library Dublin Copyright statement
All material supplied by Trinity College Library is protected by copyright (under the Copyright and Related Rights Act, 2000 as amended) and other relevant Intellectual Property Rights. By accessing and using a Digitised Thesis from Trinity College Library you acknowledge that all Intellectual Property Rights in any Works supplied are the sole and exclusive property of the copyright and/or other IPR holder. Specific copyright holders may not be explicitly identified. Use of materials from other sources within a thesis should not be construed as a claim over them.
A non-exclusive, non-transferable licence is hereby granted to those using or reproducing, in whole or in part, the material for valid purposes, providing the copyright owners are acknowledged using the normal conventions. Where specific permission to use material is required, this is identified and such permission must be sought from the copyright holder or agency cited.
Liability statement
By using a Digitised Thesis, I accept that Trinity College Dublin bears no legal responsibility for the accuracy, legality or comprehensiveness of materials contained within the thesis, and that Trinity College Dublin accepts no liability for indirect, consequential, or incidental, damages or losses arising from use of the thesis for whatever reason. Information located in a thesis may be subject to specific use constraints, details of which may not be explicitly described. It is the responsibility of potential and actual users to be aware of such constraints and to abide by them. By making use of material from a digitised thesis, you accept these copyright and disclaimer provisions. Where it is brought to the attention of Trinity College Library that there may be a breach of copyright or other restraint, it is the policy to withdraw or take down access to a thesis while the issue is being resolved.
Access Agreement
By using a Digitised Thesis from Trinity College Library you are bound by the following Terms & Conditions. Please read them carefully.
Trinity College Library
Dublin
University of Dublin
Modelling the Dublin Housing Market
A Time Series Analysis
by
Loretta O’Sullivan
Submitted to the Department of Economics
in fulfilment of the requirements for the degree of
Doctor of Philosophy
at the
UNIVERSITY OF DUBLIN
,INITY CC
Declaration
Summary
Applying a range of time series econometric techniques, this thesis comprehensively models the Dublin market for new, private sector housing over the period 1980-2000.
Chapter 1 details the rationale for the study and outlines the structure of the remaining chapters. An overview of the theoretical functioning of the market for housing, along with the baseline model that underlies the empirical sections of the thesis, is provided in Chapter 2.
To facilitate the identification of variables that could potentially influence demand, supply and price inflation in the Dublin marketplace, Chapter 3 presents the empirical findings of
selected Irish and international studies that adopt a time series, macroeconomic approach to modelling housing. Overall, the literature appears to be in agreement as to the key factors at play in the housing market. These include price, income, interest rates, building costs, the existing housing stock, demographics, land and government policies.
Chapter 4 provides a detailed description of the data series that feed into the empirical sections, while Chapter 5 presents a synopsis of the modelling techniques applied in the study.
Chapter 6 undertakes an empirical analysis of the Dublin market for new, private sector housing with the aim of uncovering the nature of the long run relations at play in this
marketplace. Econometric modelling adopts the Johansen cointegration approach and in line
which is normalised on the housing stock variable, shows that the stock of housing was below its desired level - that is the level consistent with the prevailing level of house prices, income, mortgage interest rates and demographics - over the time periods 1986-1989, 1993-1997 and
1999. The supply vector is normalised on house prices and suggests that from the end of 1987 to 1989, and from 1994 onwards, prices were relatively high given the prevailing level of mortgage interest rates, building costs and land. However, an analysis of the adjustment properties of the above relationships reveals a failure on the part of both the stock and price of housing to adjust to steady state deviations and restore the market to equilibrium.
Accordingly, Chapter 7 considers adjustment behaviour in the Dublin market for new private sector housing in greater detail. In doing so, short run house price determination is modelled within a linear and non-linear error correction framework. The resultant findings indicate that a range of explanatory variables including income, demographics, the housing stock, government interventionist policies and mortgage interest rates are significant determinants of price inflation. Moreover, house prices are found not to adjust in either of the extreme regimes of the smooth transition regression model. As such, it may be concluded that the long run demand and supply relations identified in Chapter 6 do not define equilibrium for the
Dublin market.
Finally, as the existence of a bubble could potentially account for the part of house price determination that is left unexplained by the models estimated in Chapter 7, Chapter 8 examines the Dublin new private sector housing market for evidence of speculative behaviour. The regime-switching approach applied suggests the presence of a fad. Fads give
rise to a situation whereby prices deviate temporarily from, but will eventually revert to, underlying fundamentals. On this basis, a ’soft landing’ may be anticipated for the future path of the Dublin housing market rather than the collapse type scenario associated with a bubble.
Acknowledgements
I would like to express my sincere gratitude to my supervisor Professor P.J. Drudy for his kindness, support and supervision over the past years.
The financial support of a Government of Ireland Research Scholarship in the Humanities and Social Sciences, an Urban Institute Ireland Scholarship, and a Trinity College Postgraduate Award is gratefully acknowledged.
During my time in the Department of Economics, I have benefited from the help and encouragement of many staff members and postgraduate students, to whom I extend my gratitude. In particular, I would like to thank Professor Alan Matthews, Mr. Michael Harrison and Dr. Jacco Thijssen for their generous advice; and Colette Ding, Orla Doyle and Liam Delaney for their ongoing friendship. I would also like to thank the examiners of this thesis, Dr. Andrew Somerville and Professor Heino Bohn Nielsen.
For further stimulating my interest in economics and econometrics, I thank the lecturers and participants at the LSE, University of Oxford and University of Copenhagen Summer and Easter Schools in Econometrics. The support I received whilst a visiting Marie Curie student at the University of Cambridge is much appreciated.
Table of Contents
Summary ...i
Acknowledgements ...iii
Table of Contents ...iv
List of Tables and Figures ...vii
List of Variables ...xi
Chapter 1: 1.1. 1.2. Introduction ...1
Study Rationale ...1
Study Structure ...2
Chapter 2: 2.1. 2.2. The Theoretical Framework ...6
Introduction ...6
Housing Attributes ...7
2.3. The Theoretical Model ...9
2.4. Theoretical Relationships ...13
2.5. Conclusion ...14
Chapter 3: 3.1. 3.2. 3.3. 3.4. Literature Review ...15
Introduction ...15
A Priori Expectations ...16
Empirical Research on Ireland ...16
3.5. Conclusion ...30
Chapter 4: 4.1. 4.2. Data Description ...31
Introduction ...31
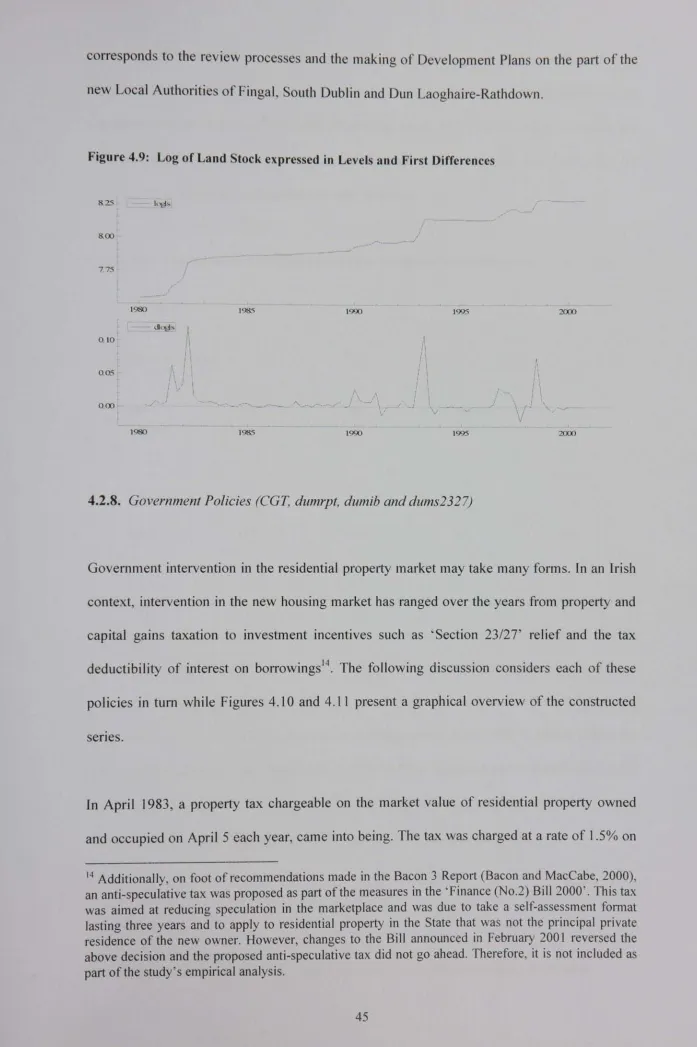
Data Description ...31
4.3. Conclusion ...49
Chapter 5: 5.1. 5.2. 5.3. 5.4. 5.5. 5A. Methodology ...50
Introduction ...50
Cointegration Methodology ...50
Smooth Transition Regression Methodology ...66
Regime-Switching and Bubble Testing Methodology ...74
Conclusion ...82
Appendix ...83
Chapter 6: 6.1. 6.2. 6.3. A Long Run Analysis of the Dublin Housing Market ...89
Introduction ...89
A Priori Expectations ...90
Data Properties ...91
6.4. The Statistical Model ...92
6.5. Model Selection and Misspecification Testing ...94
6.6. 6.7. 6.8. 6.9. 6.10. Determination of the Cointegrating Rank ...105
Model Specific Data Properties ...108
The Partial Model ...110
Long Run Identification ...113
Chapter 7:
7.1.
7.2.
7.3.
7.4.
7.5.
7.6.
7A.
An Analysis of Adjustment in the Dublin Housing Market ...121
Introduction ...121
The Statistical Model ...122
A Priori Expectations ...124
The Linear Error Correction Model ...125
The Non-Linear Error Correction Model ...133
Conclusion ...146
Appendix ... ...148
Chapter 8: 8.1. 8.2. 8.3. 8.4. 8.5. Testing for the Presence of a Bubble in the Dublin Housing Market ...155
Introduction ...155
The Statistical Model ...155
Modelling Fundamental House Prices ...158
The Non-Fundamental Component of House Prices ...182
The Regime-Switching Model ...183
8.6. Conclusion ...185
Chapter 9: Conclusion ...187
List of Tables and Figures
Tables
3.1.
5.1.
5.2.
5.3.
5.4.
5.5.
5A.1. 5A.2.
6.1.
6.2.
6.3.
6.4.
6.5.
6.6.
6.7.
6.8.
6.9,
6.10. 6.11. 6.12. 6.13.
Key Factors Affecting Housing Demand, Supply and Prices ...16
Cointegration Testing - A Comparison of Methods ...52
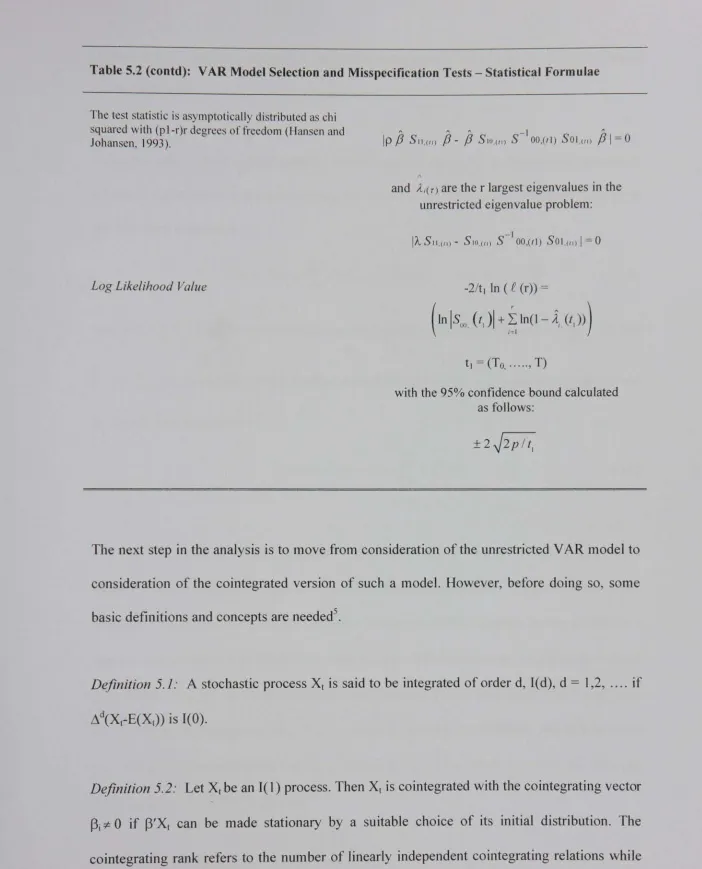
VAR Model Selection and Misspecification Tests - Statistical Formulae ...55
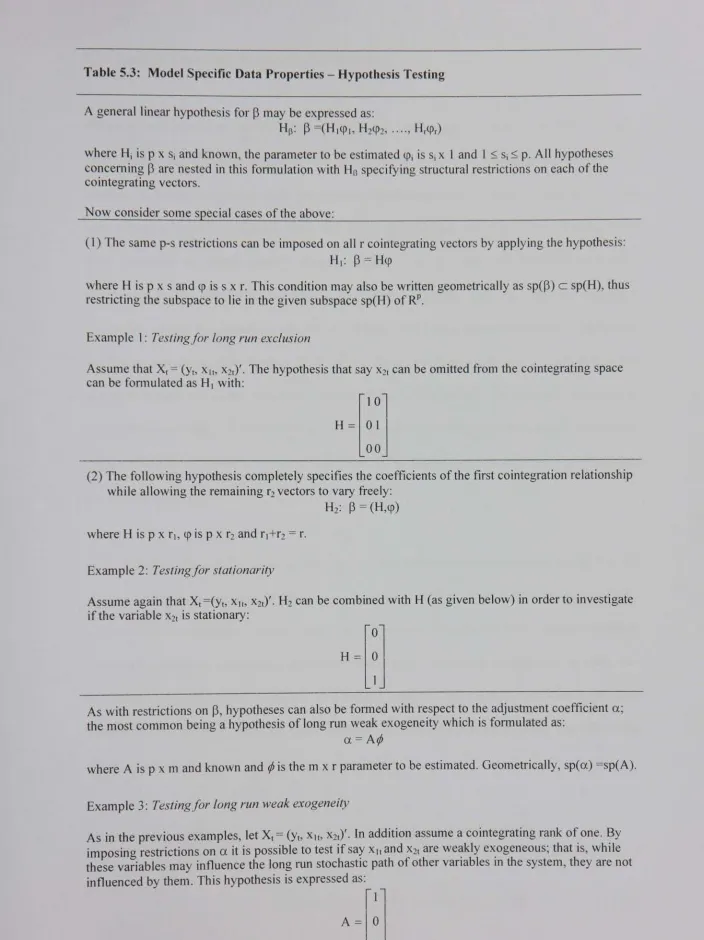
Model Specification Data Properties - Hypothesis Testing ...65
STR Model Misspecification Tests - Statistical Formulae ...72
Switching Regression Hypothesis and Misspecification Tests - Statistical Formulae.. 80
Large Sample Assumptions ...85
OLS Model Selection, Hypothesis and Misspecification Tests - Statistical Formulae. 86 Unit Root Testing and Degree of Integration ...91
Information Criteria for Choice of VAR Lag Length - No Dummies ...94
Likelihood Ratio Test for Model Reduction - No Dummies ...95
Testing for Serial Correlation in the VAR Residuals - No Dummies ...95
Testing for Normality in the VAR Residuals - No Dummies ...96
Testing for Heteroscedasticity in the VAR Residuals -No Dummies ...96
Information Criteria for Choice of VAR Lag Length - Dummies ...98
Likelihood Ratio Test for Model Reduction - Dummies ...98
Testing for Serial Correlation in the VAR Residuals - Dummies ...99
Testing for Normality in the VAR Residuals - Dummies ...99
Testing for Heteroscedasticity in the VAR Residuals - Dummies ...99
Estimated VAR(2) Model - Correlation Matrix ...101
6.14. 6.15. 6.16. 6.17. 6.18. 6.19. 6.20. 6.21. 6.22. 6.23. 6.24. 7,1. 7.2. 7.3. 7.4. 7.5. 7.6. 7.7. 7.8. 7A. 8.1. 8.2. 8.3. 8.4. 8.5. 8.6, 8.7. 8.8.
Estimated VAR(2) Model - Univariate Statistics ...102
Testing for the Cointegrating Rank - The Trace Test ...106
Testing for the Cointegrating Rank - Roots of the Companion Matrix ...106
Testing for the Cointegrating Rank - Unrestricted Estimates of the VAR(2) Model.. 107
Estimated VAR(2) Model - Model Specific Data Properties ...109
The Partial Model - Short Run Matrices ...111
The Partial Model - Multivariate Statistics ...112
The Partial Model - The Correlation Matrix ...112
The Partial Model - Univariate Statistics ...113
The Exactly Identified Model ...114
The Over-Identified Model ...115
The Linear Error Correction Model - Initial Estimation ...127
The Linear Error Correction Model - Final Model ...128
Estimated Linear Error Correction Model - Residual Statistics ...129
Testing Linearity Against STR - P Values ...134
The Smooth Transition Regression Model - Initial Estimation ...137
The Smooth Transition Regression Model - Final Model ...138
Estimated Smooth Transition Regression Model - Residual Statistics ...140
Testing for No Remaining Non- Linearity - P Values ...141
The Linear Error Correction Model - Specification Testing ...148
Information Criteria for Choice of VAR Lag Length - No Dummies ...162
Likelihood Ratio Test for Model Reduction - No Dummies ...162
Testing for Serial Correlation in the VAR Residuals - No Dummies ...163
Testing for Normality in the VAR Residuals - No Dummies ...163
Testing for Heteroscedasticity in the VAR Residuals - No Dummies ...163
Likelihood Ratio Test for Model Reduction - Dummies ...164
Information Criteria for Choice of VAR Lag Length - Dummies ...165
8.9, 8.10. 8.11. 8.12. 8.13. 8.14. 8.15. 8.16. 8.17. 8.18. 8.19. 8.20. 8.21. 8.22. 8.23. 8.24. 8.25. 8.26.
Testing for Normality in the VAR Residuals - Dummies ...166
Testing for Heteroscedasticity in the VAR Residuals - Dummies ...166
Estimated VAR(2) Model - Multivariate Statistics ...167
Estimated VAR(2) Model - Univariate Statistics ...168
Estimated VAR(2) Model - Correlation Matrix ...168
Testing for the Cointegrating Rank - The Trace Test ...171
Testing for the Cointegrating Rank- Roots of the Companion Matrix ...171
Testing for the Cointegrating Rank - Unrestricted Estimates of the VAR(2) Model.. 172
Estimated VAR(2) Model - Model Specific Data Properties ...174
The Partial Model - Short Run Matrices ...175
The Partial Model - Correlation Matrix ...176
The Partial Model - Multivariate Statistics ...176
The Partial Model - Univariate Statistics ...177
The Exactly Identified Model ...178
The Over-Identified Model ...179
Estimated Regime Switching Model - Coefficient Restrictions ...183
Estimated Regime Switching Model - Nested Specifications ...184
Estimated Regime Switching Model - Misspecification Testing ...185
Figures 2,1. 2.2. 4.1. 4,2. 4.3, 4.4. 4.5. Long Run Housing Equilibrium ...11
Short Run Housing Equilibrium ...12
Log of New House Prices expressed in Levels and First Differences ...32
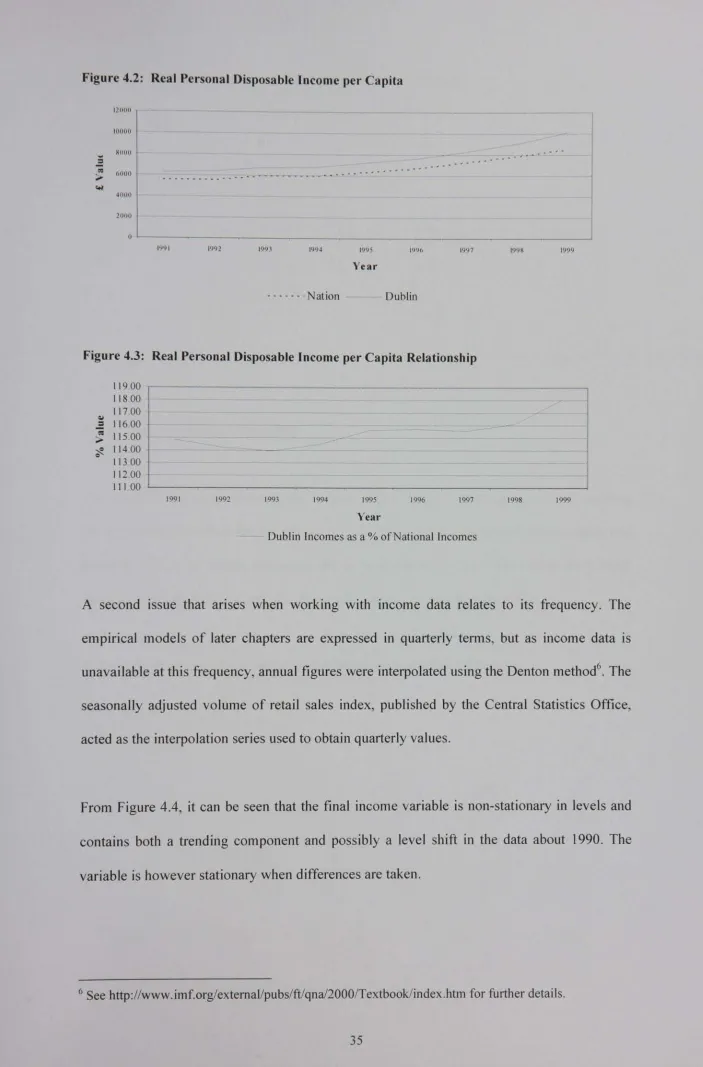
Real Personal Disposable Income per Capita ...35
Real Personal Disposable Income per Capita Relationship ...35
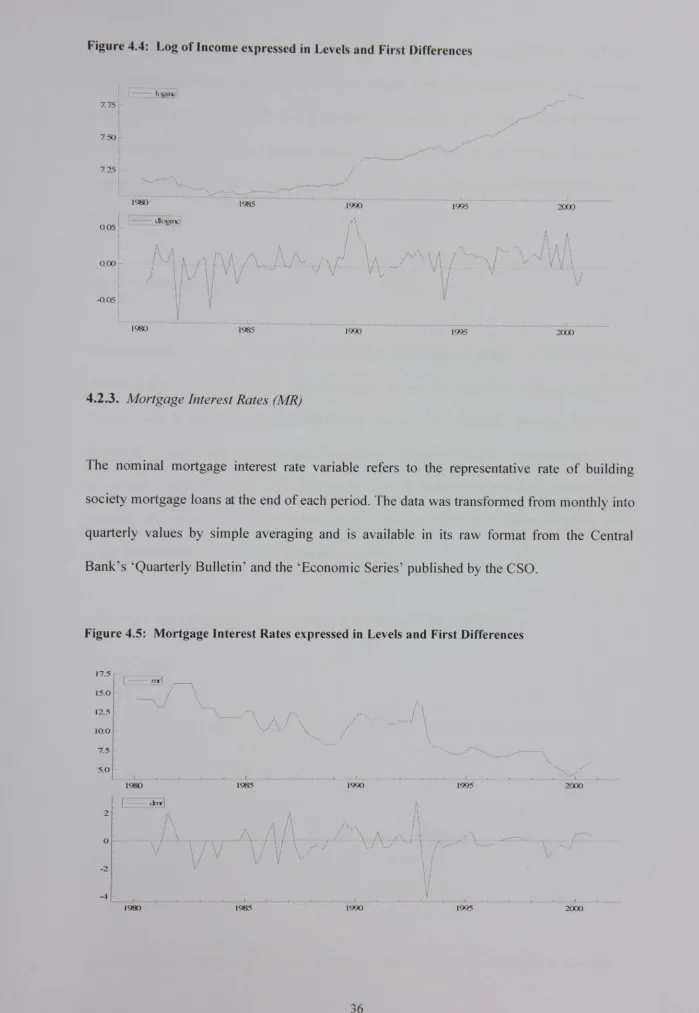
Log of Income expressed in Levels and First Differences ...36
4.6,
4,7.
4,8,
4,9.
4.10. 4.11. 4.12.
5.1.
6,1.
6.2.
Log of Building Costs expressed in Levels and First Differences ...37
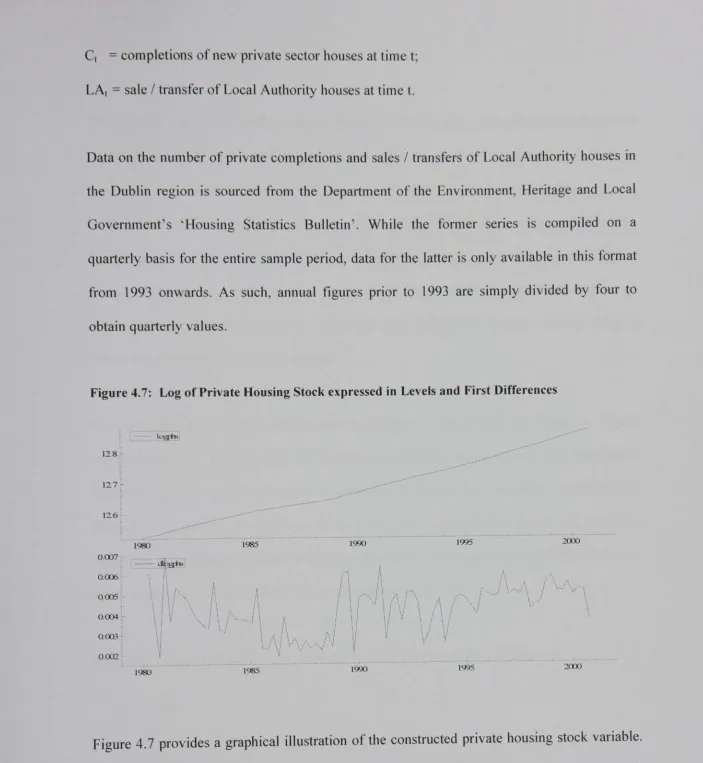
Log of Private Housing Stock expressed in Levels and First Differences ...39
Log of Household Formation expressed in Levels and First Differences ...40
Log of Land Stock expressed in Levels and First Differences ...45
Capital Gains Tax Rates expressed in Levels and First Differences ...46
Intervention Dummy Variables expressed in Levels ...47
Log of Consumer Price Index expressed in Levels and First Differences ...48
Pushing and Pulling Forces ...61
Recursive Analysis - Trace Test (Base Sample 1980:3 to 1993:4) ...103
Recursive Analysis - Test of Known Beta, rank =2 (Base Sample 1980:3 to 1993:4) ... °°" .... °’° ... *°°°°°°°*° ... *°° ... "’°°oo°°°°°o .... °°°. ... °°°°.o ... °o°°°°°° ... °°°°°°*°o° ... °° 104
6.3. 6.4. 6.5. 7°1. 7.2. Recursive Analysis - The Log Likelihood Value (Base Sample 1980:3 to 1993:4) ... 104
The Cointegrating Vectors - Beta 1 and 2 ...107
Long Run Demand and Supply ...118
The Estimated Linear Error Correction Model - Actual and Fitted Values ...129
The Transition Variable ...135
7.3. 7.4o The Estimated Smooth Transition Regression Model - Actual and Fitted Values ...139
Values of the Transition Function of the Estimated STR Model ...143
7.5. The Transition Function of the Estimated STR Model as a Function of the Transition Variable ...144
7.6. Residuals of the Linear Error Correction and STR Models ...145
8,1, 8,2° 8,3, 8.4, Recursive Analysis - Trace Test (Base Sample 1980:3 to 1993:4) ...169
Recursive Analysis - The Log Likelihood Value (Base Sample 1980:3 to 1993:4) ... 170
Long Run House Price Relation ...180
List of Variables
nph inc MR
bc
phs hf
ls
CGT Dumrpt Dumib
Dums2327 =
CPI Dumlbc Dumlls Dum21s Dum31s Dum4ls
= real new house prices
= real personal disposable income per capita = nominal mortgage interest rates
= real building costs
= the stock of private housing = household formation
= the stock of zoned housing land = capital gains tax rates
= a dummy = 1 for the years in which property taxes applied and 0 otherwise = a dummy = 1 for the years in which interest on borrowings was tax deductible
and 0 otherwise
a dummy = 1 for the years in which ’Section 23/27’ relief covered all rental income and 0 for the years in which it either did not apply or related solely to rental income from the residential property in question
= consumer price index
= a transitory shock dummy = 1 for 2000:4 and 0 otherwise = a permanent shock dummy = 1 for 1982:2 and 0 otherwise = a permanent shock dummy = I for 1993:2 and 0 otherwise = a permanent shock dummy = 1 for 1998:3 and 0 otherwise = a permanent shock dummy = 1 for 1981:3 and 0 otherwise
Dum2bc
Uummr
Dum3bc ecm° ecms Dq
R
b
= a transitory shock dummy --- 1 for 1981:2, 0 for 1981:3, -1 for 1981:4 and 0 otherwise
= a transitory shock dummy = 1 for 1992:4, -1 for 1993"1 and 0 otherwise = a permanent shock dummy = 1 for 1985:2 and 0 otherwise
= an error correction term capturing deviations from the long run demand relation = an error correction term capturing deviations from the long run supply relation = seasonal dummies
= the return from investing in housing
= the non-fundamental / bubble component of real new house prices
Chapter 1:
Introduction
1.1. Study Rationale
Developments ill national and regional housing markets have a number of implications for the wider economy. From a macroeconomic perspective, investment in housing directly contributes to economic growth, while the wealth effects associated with rising prices may impact on consumer behaviour. At a micro level, the purchase of a house is typically the most important transaction made by a household. Rising prices can therefore lead to affordability concerns which limit access to the marketplace or alternatively, distort household location
choice with knock-on effects for physical and social infrastructure.
In an Irish context, the Dublin market has periodically experienced incidents of excess demand, supply constraints and rising house prices; the latest of which has persisted since the mid-nineties. Given the dominance of this marketplace, such incidents can be expected to
have had significant economy wide effects. However, before considering the broader impact of housing market disequilibria, a clear understanding of the empirical conditions that
characterise the Dublin marketplace is first needed.
period 1980-2000. Specifically, the empirical work presented in later chapters seeks to identify the nature of the long run demand and supply relations at play in the Dublin marketplace, model short run house price determination and test for the possibility of speculative behaviour. In doing so, a range of time series econometric techniques are adopted.
1.2. Study Structure
An overview of the structure of the study, along with a brief outline of the content of each chapter and its contribution to the literature where relevant, is set out below.
Chapter 2. The Theoretical Framework
As any empirical analysis must be conducted within the framework of economic theory, Chapter 2 begins by considering the theoretical functioning of the housing market. In particular, the special characteristics associated with housing are discussed, as is the manner in which these characteristics are modified so as to enable standard time series modelling of the housing market. The baseline model that underlies the empirical sections of the study is then presented, along with the key theoretical relationships that apply in a housing context.
Chapter 3." Literature Review
Chapter 3 draws together the empirical findings of various Irish and international studies that adopt a time series, macroeconomic approach to modelling housing. The intention in detailing these findings is to facilitate the identification of appropriate factors for inclusion when modelling the Dublin housing market. To this end, attention is paid to the nature of the
Chapter 4." Data Description
Chapter 4 provides a detailed description of the data series that feed into the empirical sections of the study. Given the limitations of the available information, it proved necessary to refine much of the data and to generate a measure of the stock of zoned housing land. The
methodology and refinement techniques applied when doing so are set out in this chapter. An overview of the data sources and time series properties of the constructed variables is also
presented.
Chapter 5. Methodology
Chapter 5 presents a technical synopsis of the modelling techniques adopted in the course of the study’s empirical analyses of the Dublin market; namely, the Johansen cointegration
methodology, smooth transition regression modelling and regime-switching tests for stochastic bubbles. These techniques draw on the time series properties of the data.
Chapter 6. A Long Run Analysis of the Dublin Housing Market
Chapter 6 undertakes an empirical analysis of the Dublin market for new, private sector housing within a long run framework. Econometric modelling adopts the Johansen cointegration approach and applies it to the time-series dataset described in Chapter 4. A priori, the presence of two equilibrium relations is postulated, one for the demand-side of the
market and one representing supply.
In terms of its contribution to the literature, this chapter represents the first attempt to include a land availability variable in a long run model of the housing market. The potentially important role of land is often referred to in international studies, but due to a lack of data on
incorporated somewhat crude measures of land prices, no effort has been made to consider land in empirical studies of the Dublin marketplace. Moreover, the shortage of zoned and serviced housing land in the Dublin area implies that availability rather than price is the appropriate land measure in this context.
Chapter 7." An Analysis of Adjustment in the Dublin Housing Market
Building on the preceding analysis, Chapter 7 seeks to examine adjustment behaviour in the Dublin market for new private sector housing. In particular, it seems appropriate to examine the response of prices to deviations from the long run relations. As such, this chapter models short run house price determination within an adjustment type framework. In doing so, error correction models of both a linear (ordinary least squares estimation) and non-linear (smooth transition regression modelling) nature are developed and applied to the dataset detailed in Chapter 4.
The estimation of error correction models goes considerably beyond the scope of current empirical work on the Dublin housing market, and in the case of the non-linear model, also beyond that at national level. Indeed, the study’s use of the smooth transition regression modelling approach is only the second time in which this technique has been applied in a housing framework. Furthermore, by including a range of variables designed to capture the effectiveness of government interventionist policies, this chapter allows for a more complete modelling of house price determination than has been undertaken to date.
Chapter 8." Testing for the Presence of a Bubble in the Dublin Housing Market
determination that
examines the Dublin new private sector housing market for evidence of speculative behaviour. A regime-switching approach which enables testing of the hypothesis that house prices are being driven solely by fundamental market factors, against the alternative of a bubble, is adopted for this purpose.
The contribution of Chapter 8 to the wider literature centres on the attention paid to modelling the fundamental component of house prices. Whereas existing empirical research has modelled underlying fundamentals in the Dublin marketplace on a partial basis, this study includes both demand and supply-side variables. Most notably, the fundamentals model presented here is the first to incorporate a measure of land availability.
Chapter 9: Conclusion
Chapter 9 concludes with a summary of the main comprehensive modelling of the Dublin housing market.
findings arising from the study’s
Chapter 2:
The Theoretical Framework
2.1. Introduction
From a theoretical perspective, housing can be viewed as a commodity that is, in a similar manner to other goods and services, subject to the rigours of the market process. However, in contrast to most commodities, it is a good that embodies a number of distinct attributes, the interaction of which serves to complicate economic analyses. While the heterogeneity and durability properties of housing are foremost amongst its distinguishing characteristics, features such as spatial fixity and government involvement also identify it as a unique commodity (Smith, Rosen and Fallis, 1988). Given that an appreciation of both the theoretical and empirical functioning of the housing market requires an understanding of these attributes, the main aim of this chapter is to discuss the special characteristics of housing. Building on this discussion, the modelling implications of housing market peculiarities are then considered, particularly the need for simplifying assumptions. The latter arise from the difficulties associated with any attempt to combine the above diverse range of concepts into a single model. Thus, a further objective of the chapter is to describe the simplified housing model that is typically applied in time series studies of the type undertaken in this thesis.
underlies the empirical estimations presented in Chapters 6 and 7. The theoretical relationships applicable in a housing context are set out in Section 2.4. Section 2.5 concludes.
2.2. Housing Attributes
Housing may be distinguished from other goods and services on the basis of its heterogeneity, durability, spatial fixity and the extensive involvement of government in its marketplace. As noted overleaf, a necessary prerequisite for appreciating the complexity of housing market economics is an understanding of the various attributes of housing, and the means by which the interaction of these features complicates theoretical and empirical analyses of the market. Fortunately, such an understanding has been aided by the emergence of a large volume of literature - the different strands of which ’may be categorised according to which of these characteristics is emphasized and formally modelled in the analysis’ (Smith, Rosen and Fallis,
1988). The principal concerns of the literature, as they relate to each characteristic of housing, are briefly summarised below. In addition, the following sub-sections define these attributes.
2.2.1. Heterogeneity
Heterogeneity implies that no two houses are the same in every respect. This assertion is borne out by the fact that it is possible to differentiate between dwelling units on many grounds, including those of size, age and design. With regard to the explicit modelling of heterogeneity, housing economics tends to adopt one of two methods; either a characteristics based approach or an approach that focuses on the quantity and quality aspects of housing (Smith, Rosen and Fallis, 1988)~. The former encapsulates the idea of hedonic pricing in that
each housing unit is described in terms of a bundle of characteristics that commands a price in the marketplace. This price is subsequently regressed on the individual characteristics of the
bundle so as to reveal their implicit or hedonic prices. In contrast, the second approach tbrms part of the literature concerned with the maintenance and renovation decisions of house owners.
2.2.2. Durability
A second feature contributing to the distinctiveness of housing is that of durability. This refers to the long lasting nature of housing and implies that ’the existing stock is quite important relative to the flow of newly constructed stock’ (Smith, Rosen and Fallis, 1988)2. A partial treatment of durability allows for stock-flow adjustment in the housing market, with the intersection of demand and a perfectly inelastic short run supply curve for housing stock / services yielding the unit price of the latter. A capital value per unit of housing stock is then determined by the interaction of the unit price of housing services and factors such as risk premia and the yields on various other assets. Ultimately, the flow of new construction depends on the supply price of new stock relative to the capital value derived above. However, Smith, Rosen and Fallis (1988) argue that a full treatment of durability requires more than an inelastic short run supply curve, and that the markets for housing stock and housing services need to be thought of as distinct concepts. Furthermore, they suggest that these two markets can again be differentiated by means of tenure choice; a topic that in itself has given rise to a huge body of literature.
2.2.3. Spatial Fixity
The uniqueness of housing is also reinforced by the importance of the location of the physical stock. This characteristic, known as spatial fixity, is related to the heterogeneity of housing and suggests that housing units, physically similar but located in different neighbourhoods,
may sell for different prices. Location in this context comprises three aspects, namely the distance from important areas such as the employment centre, shopping facilitates and transport routes, the nature of land use in the relevant neighbourhood, and local government services and tax levels. Modelling the first aspect of spatial fixity can be undertaken within a general equilibrium framework as proposed by the new urban economics school or
alternatively, via computer simulation. In examining the second aspect, the hedonic pricing technique mentioned earlier may be adopted, whereas the third is often discussed as part of the literature arising from Tiebout’s (1956) paper on local government.
2.2.4. Government Involvement
The final attribute associated with housing is the extent of government involvement in this marketplace. While the intervention mechanisms pursued across countries differ considerably - ranging from taxation and regulatory control to non-market provision - ’the
level of involvement compared to other product markets is uniformly high’ (Smith, Rosen and Fallis, 1988). The volume of literature in this area is extensive, although it is possible to broadly categorise it in terms of studies that take a normative perspective and those that adopt a positive economics approach. Typically, the latter aim to analyse the end affects of various policy measures and housing programmes whereas, the more normative studies are largely concerned with issues such as what the role of the government vis-~,-vis housing ought to be.
2.3. The Theoretical Model
Given the impossibility of incorporating all of the above characteristics into a single model, empirical analyses of housing
relationship between the price
markets based on time series data and focussing on the or quantity of housing and an array of other variables,
is to firstly set out these assumptions, and secondly, to present the theoretical housing model that they give rise to.
Principal amongst the employed assumptions is the existence of a theoretical and unobservable homogeneous commodity called housing service. Allowing for each dwelling unit ’to yield some quantity of this good during each time period’, and assuming that it is ’the only thing in a dwelling unit to which consumers attach value’, enables the issue of heterogeneity to be successfully overcome (Olsen, 1969). However, as housing service is an unobservable entity, it is not possible to directly test this proposition, though arguably, a relationship between housing service and certain observable phenomena may be defined and then tested (Muth, 1960 and Olsen, 1969).
In terms of accounting for the durability characteristic of housing, empirical analyses usually consider some variant of the adjustment process discussed in Section 2.2.2. The key assumption made in this regard concerns the flow of services provided by housing. This flow is assumed to be proportional to the stock of housing whereas a full treatment of durability requires that the markets for housing stock and housing services be further distinguished.
Lastly, the spatial aspects of housing are generally ignored.
The theoretical model derived as a result of combining the above assumptions is discussed in Hendry (1984). This model is commonly adopted as the starting point of time series studies of the housing market, including those undertaken in Chapters 6 and 7 of the present research.
Such analyses begin with an equilibrium model for the demand and supply of housing, where the term equilibrium refers to ’no inherent tendency to change’ (Hendry, 1984). Within this
Depreciation of the existing stock is exactly offset by new construction such that C -- 6.H,
where C is new construction, 6represents depreciation and H is the physical stock of housing. Demand is downward sloping and the intersection of demand and supply determine the equilibrium price Phl,~e and quantity Hl~e. At this price, perfect competition implies that the construction market is earning a normal profit. As a result, the stock and flow markets are in long run equilibrium and demand is said to determine quantity but not price (Hendry, 1984).
Figure 2.1: Long Run Housing Equilibrium
Ph
PhLR
\
\
\ Hd
SLR
HLR H
In practice, it is unlikely that supply is perfectly elastic even in the long run. Miles (1994) and Poterba (1984) consider an upward sloping long run housing supply schedule, suggesting that such a schedule can be derived under the assumptions of either diminishing or constant returns to scale - a binding land availability constraint can give rise to the second outcome - and in this case house prices should exhibit some response to changing demand conditions. In an Irish context, the notion of such a constraint is readily applicable given the shortage of zoned and serviced land, especially in the Dublin area (IMF, 2000).
na’fve, uncertainty can be incorporated into the model (see for example, Salo (1994)) and the impact on the supply of housing of exogenous variables such as land availability and the proportion of production pre-sold, can also be assessed.
The short run situation differs from that of the long run in the sense that supply is assumed to be perfectly inelastic or fixed initially. Therefore, an increase in the demand for housing
necessitates an increase in price in order to restore equilibrium to the market. In this framework changing demand conditions drive house price determination. However, disequilibrium is likely to prevail in the market for new construction given that the short run price Ph.v~ exceeds Phzj~e resulting in positive profits, which in turn, entice entry and an outward shift of the supply curve for construction flows. Eventually supply increases sufficiently to satisfy demand, excess profits are eliminated and the flows market balances at the long run price.
Figure 2.2: Short Run Housing Equilibrium
Ph
PhsR2
PhsRI
\ \
SSR
HSR H
Figures 2.1 and 2.2 respectively illustrate the above verbal descriptions of the long and short
2.4. Theoretical Relationships
Drawing on the above, this section sets out the key theoretical relations that apply in a
housing context. The intention in doing so is to provide some indication as to the nature of relationships that might be expected when it comes to the empirical analysis of the Dublin housing market. While comprehensive, note that the list of variables presented below is not exhaustive-~.
where:
Hd
ph Y
MR D
P M
T
Ha = f {ph, Y, MR, D, p, M, T)
= housing demand; = real house prices; = permanent income;
= nominal mortgage interest rates; = demographics;
= the real rental rate; = the stock of mortgages;
= the tax rate;
(2.1)
where:
HS
5
Ht_l
Ct
LAt
Hs = (l-8)Ht_l + Ct + LAt
= stock supply of housing;
= the rate of depreciation;
= housing stock in the previous period;
= completions of new private sector houses at time t;
= sale / transfer of Local Authority houses at time t;
(2.2)
C = f {MR, credit, bc, Is, Ip} (2.3)
where: C
credit
be
Is
lp
= completions of new private sector houses;
= availability of credit; = real building costs;
= the stock of zoned housing land; = real land prices;
where: Ph
Ph = f {Y, MR, D, p, M, T, credit, bc, Is, Ip}
= house prices.
(2.4)
2.5. Conclusion
Chapter 3:
Literature Review
3.1. Introduction
A testimony to the growth of academic and policy interest in housing market economics over the past decades is the extensive body of literature that currently exists in this field. To date, housing research covers a broad spectrum of topics ranging from analyses of price determination and tenure and location choice to issues such as urban regeneration, neighbourhood externalities, densities and the housing needs of the under-privileged. While each of these strands is of interest, the focus of the present study is such that it is considered appropriate to limit the following discussion to a review of literature that is of a time series econometric and macroeconomic orientation. Accordingly, this chapter presents the empirical findings of relevant Irish and international studies that adopt a time series, macro approach to modelling housing. In presenting these findings, the intention is to facilitate the identification of variables that could potentially influence demand, supply and price inflation in the Dublin marketplace, bearing in mind the theoretical relationships set out in Chapter 2.
The chapter is structured as follows: to begin with, Section 3.2 provides a brief overview of a priori theoretical expectations. Respectively, Sections 3.3 and 3.4 then consider the findings of recent empirical research on the Irish housing market and the results of selected international studies. Section 3.5 concludes with a summary of the variables, which in terms
3.2. A Priori Expectations
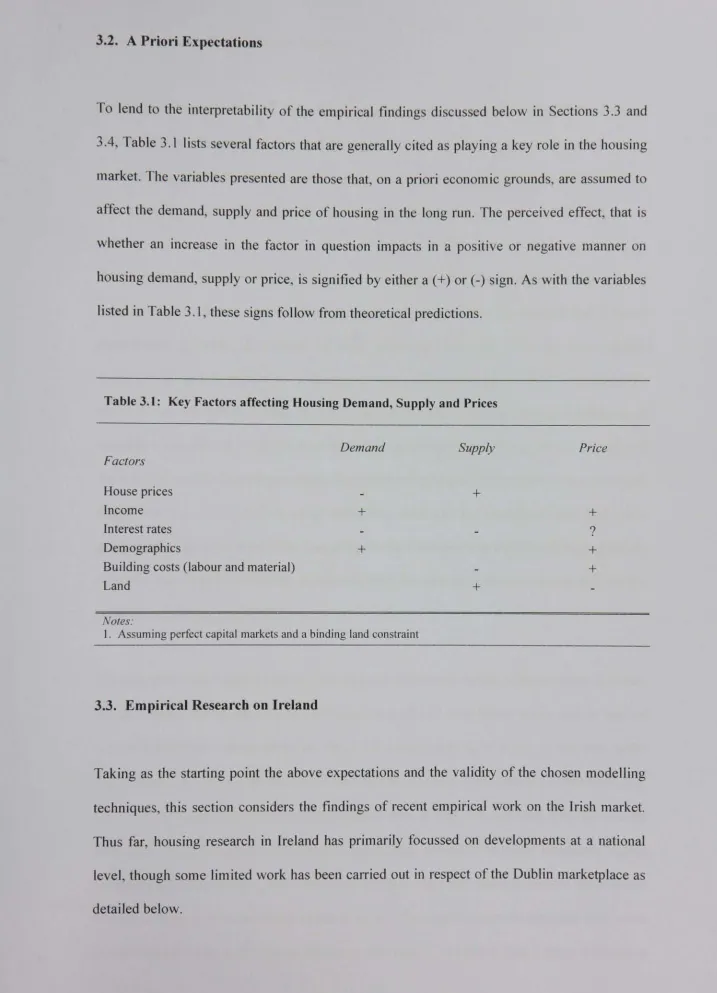
[image:35.727.1.718.39.1032.2]To lend to the interpretability of the empirical findings discussed below in Sections 3.3 and 3.4, Table 3. ! lists several factors that are generally cited as playing a key role in the housing market. The variables presented are those that, on a priori economic grounds, are assumed to affect the demand, supply and price of housing in the long run. The perceived effect, that is whether an increase in the factor in question impacts in a positive or negative manner on housing demand, supply or price, is signified by either a (+) or (-) sign. As with the variables listed in Table 3.1, these signs follow from theoretical predictions.
Table 3.1: Key Factors affecting Housing Demand, Supply and Prices
Factors
Demand Supply Price
House prices _ +
Income + +
Interest rates - 9
Demographics + +
Building costs (labour and material) +
Land + _
Notes:
1. Assuming perfect capital markets and a binding land constraint
3.3. Empirical Research on Ireland
3.3.1. National Housing Market Studies
The most prominent study on the national housing market to date is a series of three reports known as the ’Bacon Reports’. Of these, the 1998 and 2000 papers (Bacon 1 and 3 respectively) undertake an econometric analysis of house price determinants while the 1999 report provides a descriptive update of the post Bacon 1 situation.
Bacon 1 (Bacon et al., 1998) adopts an econometric approach to the modelling of the national housing market that is
completions equation. methodology and is
comprised of two parts, namely Estimation of both equations applied to a dataset covering the
an inverse demand and a house uses the ordinary least squares period 1974-1996. As regards the inverted demand model, the log of real second-hand house prices is taken as the dependent variable while the set of explanatory variables incorporates the change in the log of real
personal disposable income per capita, the log of real personal disposable income per capita lagged, the log of per capita housing stock, user costs and the population aged 25-34 as a percentage of the total population. Excepting the first independent variable, all regressors are correctly signed and statistically significant, with the overall model explaining 86% of the variation in existing house prices.
Turning next to the supply equation, the empirical estimation - which relates the log of private house completions to the current and lagged log of real new house prices and to lags of logged completions - gives rise to an adjusted R squared statistic of 0.821. In line with initial expectations, the above explanatory variables are found to be significant and correctly signed.
On the other hand, when potential determinants such as real building costs and real interest
rates were tested for possible explanatory power, they proved to be either incorrectly signed or statistically insignificant. The authors also point out that the failure to include the real cost of land as a regressor in the model is due to the fact that a time series of residential land prices
would be necessary to allow for high short run correlation between residential land and house prices given that "the demand for residential land is a derived demand’ (Bacon et al, 1998).
Overall, Bacon 1 (Bacon et al., 1998) presents a standard textbook model of the housing market, the results of which appear plausible. However, important limitations of the analysis
are the incomplete modelling of the supply-side of the market and the failure to consider the time series properties of the data. As the model is expressed in levels, the presence of non-stationary variables could give rise to spurious regression. In this case, inference using the usual OLS procedures may be misleading. As such, it would have been desirable to test for the possibility of unit roots amongst the data series.
Murphy and Brereton (2001) seeks to update and expand the empirical aspect of the Bacon 1 study. The data range is increased to 1999 and the econometric analysis presents a model of the second-hand housing market using the same technique and variables as in the previous
report. Unsurprisingly, the findings are close to those of Bacon 1; though the adjusted R squared statistics appear to be higher for both the inverted demand and house completions equations over the extended sample period. In light of the above discussion, these results should be treated with caution.
Similar to its predecessor, Bacon 3 (Bacon and MacCabe, 2000) estimates an inverse demand and a completions equation. Data for the former is annual and covers the years 1972-1996 and
1972-1999. For both time periods, the inverted demand equation seeks to explain logged second-hand house prices in terms of the current and lagged log of the stock of housing, logged personal disposable income, the base mortgage rate, population aged 25-34 and the log
of lagged second-hand prices. Estimation again applies the ordinary least squares technique. Subsequent empirical results indicate adjusted R squared statistics of 0.755 and 0.949 for the respective sample periods. For the years 1972-1996, the income and demographic variables
statistically significant and correctly signed parameter estimates include those of income, mortgage rates and lagged house prices. With respect to the latter, the authors consider "gathering momentum in demand, based on price expectations’ to be ’consistent with the emergence of a significant speculative or transitory demand factor in the Irish housing market’ (Bacon and MacCabe, 2000).
in terms of the supply-side of the market, the private house completions equation incorporates as explanatory variables the log of current and lagged house prices, the log of current and
lagged building costs (where such costs include material and labour expenses but not land costs) and the log of lagged completions. While the resultant empirical findings reveal an adjusted R squared value of 0.879, only current prices and lagged completions emerge as statistically significant from zero and correctly signed.
In commenting on these results, the starting point is again the failure to examine the statistical properties of the underlying data series. If these are non-stationary in nature, the OLS inference procedures applied in the analysis are likely to be misleading. This calls into question the reliability of the resultant findings. In addition, the incompleteness of the supply-side equation is notable.
In contrast to Bacon 1 and 3, Kenny (1998) does consider the statistical properties of the data and finding evidence of non-stationary behaviour, models the interaction between house prices and a range of macroeconomic factors within a cointegration framework. For the sample period 1975 (first quarter) to 1997 (last quarter), the empirical results identify the presence of two long run / equilibrium relations, one for the demand-side of the market and
of real house prices, the building society mortgage interest rate and the log of a composite index of costs that includes material, labour and development land costs. The end results are
plausible with each variable bearing the anticipated sign.
in order to capture the dynamic nature of the housing market, the paper also examines the matrix of alpha coefficients in the vector error correction model and undertakes an impulse response analysis. The former reveals that house prices adjust positively (albeit reasonably
slowly) to situations of excess demand whereas the latter indicates that in response to a shock to income, "the stock of housing increased by only 1/10th of the proportional increase in the demand for housing’ (Kenny, 1998). The author suggests that severe supply-side constraints, such as a lack of available land or services infrastructure, offer a possible explanation for this occurrence.
While the choice of cointegration as a modelling tool is appropriate in this case, one aspect of the above analysis is questionable, namely the derivation of the land cost measure from house prices.
More recently, the Irish housing market has been re-modelled by McQuinn (2004) who presents an econometric analysis based on quarterly data covering the period 1980:1 to 2002:4. As in Kenny (1998), the Johansen technique is adopted to test for possible cointegration. The empirical findings identify two forms of a long run inverted demand /
market, the uncovered equilibrium vector is comprised of the log of total house completions (private and Local Authority), average house prices logged, the log of house prices divided by an index of builders’ costs and land costs. These variables enter the supply relation signed as expected a priori.
Building on the above cointegration analysis, the paper then estimates error correction models that incorporate the identified long run relationships. As in the static framework, two short run specifications are estimated for the change in the log of house prices while one such equation is estimated for the change in log of total completions. In terms of the impact of deviations from the equilibrium house price and supply relations on the respective dependent variables, the empirical findings indicate that the house price error correction term enters both house price equations significantly and negatively signed, while the supply-side term similarly enters the completions equation significantly and bearing the expected negative sign.
Lastly, the paper plots the fitted values of the second house price error correction model against actual prices. On the basis of this graph, it is suggested that as actual prices were in excess of the fitted ’fundamental’ house price for 1998 and 1999, some degree of over-valuation may have existed. However, from late 2000 onwards, the series are ’practically the same’ implying that recent movements in the housing market have been motivated by fundamentals (McQuinn, 2004).
Overall, McQuinn (2004) presents a comprehensive model of the Irish housing market, the
results of which appear plausible. While the chosen statistical technique is also appropriate, the issue of potential endogeneity between land and house prices is again relevant and merits
attention going forward.
this case, the observed house price is decomposed into a ’fundamental’ and
’non-fundamental’ component and a regime-switching approach is adopted to test the market for evidence of speculative behaviour. The reduced form ~fundamentals’ model (which is [bund to be a long run cointegrating relationship) takes real new house prices as the dependent variable and is estimated using ordinary least squares over the sample period 1979:1 to 2003:1. Explanatory variables include a combination of demand and supply factors, namely an index of builders’ costs, land costs, net immigrants, the loan amount, user costs, disposable income per capita and a trend to proxy influences such as household formation~. The resultant coefficients are correctly signed and significant.
The difference between the fit of the estimated ’fundamentals’ model and actual prices, - the non-fundamental price - acts as a measure of over or under-valuation. In order to examine the claims of the IMF (2003) and ’The Economist’ (2003) that Irish house prices were over-valued in 2002, the paper then proceeds to estimate two other models of ’fundamental’ house prices based on the methodologies employed by these bodies. Firstly, following the IMF (2003), second-hand house prices are related to real disposable income, real mortgage interest rates and the young house buying population as a percentage of the total population. The second additional specification seeks to explain real second-hand house prices using real personal disposable income per capita and is close to the non-econometric approach adopted by ’The Economist’ (2003). Subsequent empirical findings reveal that when Irish house prices in 2002 are modelled solely in terms of demand-side factors (as in the analyses undertaken by the IMF and ’The Economist’); they are over-valued by some 11% to 75%. In contrast, the use of both supply and demand factors (as in Roche’s model) confines the extent of over-valuation to between 0.2% and 4.6%.
With regard to testing |br the existence of a bubble in the new housing market (namely a
sharp rise in price, with the initial rise generating expectations of further increases - the probability of continued growth falls as the bubble expands and the rise is usually followed by a partial collapse), the fact that the estimated demand and supply ’fundamentals’ model constitutes a cointegrating relation suggests that a bubble is not present2. Further support for the lack of a bubble component is provided by the empirical outcome of the regime-switching model which finds evidence of a ~fad’ in the market (whereby prices deviate temporarily from underlying fundamentals but eventually mean revert) as opposed to a bubble.
On the contrary, Roche (1999) does find evidence of a speculative bubble in the Irish second-hand housing market for the sample period 1976:4 to 1998:4. Moreover, the paper suggests that the probability of a crash had increased to about 2 per cent by the late 1990s. Interestingly, the measures of the ’fundamental’ price in this paper assume a relatively
inelastic supply curve and therefore, estimate inverted demand type models that relate real second-hand house prices to real permanent income per capita, expected real mortgage rates, demographics and the real rental price.
3.3.2. Dublin Housing Market Studies
The variables adopted when analysing the Dublin housing market should in principle be the same as those applied in the above assessments of the national market. However, Bacon et al. (1998) found that gaps in the data prevented them from undertaking a carbon copy of their national analysis for the Dublin market. As such, they derive a model for logged Dublin house
prices relative to national house prices using an average of new and second-hand prices. The estimated OLS inverted demand equation for the sample 1974-1996 exhibits some evidence of instability, and hence, the empirical results are deemed ’suggestive but appear very
plausible" (Bacon et al., 1998). income and the population share relative to the rest of the country.
In particular, lagged real per capita personal disposable aged 25-34 were found to favour Dublin houses prices
In terms of modelling the supply-side of the market, the log of private house completions in Dublin is taken as the dependent variable with the explanatory variables including lagged completions, lagged real Dublin house prices (comprised of average new and second-hand house prices) and the change in the log of real Dublin house prices. With the exception of the
latter, the regressors are statistically significant and all are correctly signed. The adjusted R squared statistic indicates that the estimated model explains 57% of the variation in completions. Furthermore, the long run price elasticity of supply in the Dublin market is found to be roughly half the national figure. The authors note that ’this is consistent with the view that non-economic constraints reduce the elasticity of supply in the Dublin area’ (Bacon
et al., 1998).
Murphy and Brereton (2001) expand the timeframe of the above empirical house completions model from 1996 to 1999. As expected, the findings are much the same, though the estimated equation now explains 73% of the variation in the dependent variable.
However, to the extent that the models presented in these studies are expressed in levels and
include non-stationary variables; OLS is not an appropriate estimation technique and its use may undermine the reliability of the reported results. Furthermore, as in the national models, the supply-side equations are incomplete - no attempt made is made to include cost variables or a land measure. The latter is particularly striking given the above reference to the impact of non-economic constraints on housing supply in the Dublin area.
Roche (2001) seeks to explain whether bubbles, fads or fundamentals are driving new house
national market (1999 and 2003), the observed house price is decomposed into a ’fundamental’ and ~non-fundamental’ component and a regime-switching approach is adopted to test the market for evidence of speculative behaviour. With respect to the calculation of the
"non-fundamental’ price, four possible proxies are estimated. The first adopts an inverted demand type approach and relates real new house prices to expected real disposable income, expected real mortgage interest rates and net migrants. The resultant OLS coefficient estimates are statistically different from zero and are correctly signed. The residual from this ’fundamentals’ equation is then taken as a measure of the ’non-fundamental’ price. In contrast, the second proxy is based on the standard asset pricing model and defines the ’non-fundamental’ price as the real house price minus the mean price-rent ratio multiplied by the real rent. The third method assumes that the ’non-fundamental’ house price is correlated with the real growth rate of new house mortgages, while the last measure assumes a correlation between the ’non-fundamental’ house price and the new house price-building cost ratio (where development land prices are excluded).
These various measures of the ’non-fundamental’ price are subsequently fed into a general regime-switching model in order to test their predictive power. The overall empirical findings
indicate that there is some evidence of a speculative bubble in Dublin house prices.
While Roche’s (2001) analysis is thorough in the sense that alternative measures of the fundamental price are considered, when modelling underlying fundamentals in the Dublin
market, demand and supply variables should be considered in tandem. Moreover, the use of OLS as an estimation technique in this case is also questionable.
3.4. International Empirical Research
gained by considering the empirical results of relevant international research. Reflecting this, the following aims to provide an overview of the broader literature that informed the present study.
When considering international housing literature of a time series, macroeconomic nature, research undertaken in respect of the UK market represents a natural starting point given the structural similarities between the markets for housing in Ireland and the United Kingdom. For this same reason, empirical studies on the UK market also proved the most informative and consequently, account for the bulk of the international literature reviewed below.
Of the many studies carried out on housing in the United Kingdom, Hendry (1984) presents what is perhaps the best known econometric model of UK house prices3. Using quarterly data covering the period 1959:1 to 1982:2, the paper adopts an error correction approach that enables the estimation of a dynamic model of second-hand house prices, which in turn, is solved to yield a static equation. With regard to the latter, the empirical results find that the loan to income ratio, real income per household, the interest rate and the rate of inflation constitute the long run determinants of the average house price to household income ratio.
In terms of the dynamics, the estimated specification relates the change in the dependant variable to the lagged change in second-hand house prices, the change in real personal disposable income, an error correction term defined as the ratio of borrowing to own equity, the ratio of real personal disposable income to the stock of housing, retail prices, real lending and levels and differences of the interest rate. With the exception of the interest rate, all the
variables are expressed as logs. In addition, the coefficients are correctly signed, significant and explain some 78% of the change in second-hand house prices.
A particularly interesting feature of the above specification is the inclusion of a cubic price difference term, which allows for a non-linear response on the part of house prices to excess
demand. While the inclusion of this term is valid in so far as its coefficient is significant, Hendry (1984) asserts that ’in a sense, the cubic transformation is too extreme: for
IAlph] < 0.1, the effect of the cubic term is trivial, whereas it dominates for IA~phl > 0.3’.
Ter~isvirta (1998) re-estimates the dynamic equation for house prices set out in Hendry (1984) using a smooth transition regression (STR) model. The objective in doing so is to determine if an improved specification can be achieved using this specific non-linear technique. The author concludes that this is indeed the case, stating that the estimated STR model "contributes to the general understanding of the mechanism generating UK house price
expectations during 1960-1981’ ( Ter~isvirta, 1998).
Similar to Hendry (1984), Giussani and Hadjimatheou (1990) model the static and dynamic determinants of second-hand house prices in the United Kingdom. For the sample period 1961:1 to 1988:2, the empirical results suggest a long run relationship between the log of second-hand house prices and the log of the number of households, the log of real personal disposable income per capita, the log of new construction costs, the rental rate and the log of the housing stock. The potentially important role of land is also referred to, but due to a lack of data on costs and availability, is not modelled. The resultant coefficients all bear the expected sign and are statistically significant. Moreover, on the basis of the Dickey Fuller and Cointegrating Regression Durbin-Watson (CRDW) tests, the residuals of the estimated long
run equation are found to be stationary, implying that the above variables are in fact cointegrated. While valid, one drawback of the Engle-Granger approach adopted in this paper is the difficultly in testing for rank. This implies that the number of cointegrating relations
The associated short run model seeks to relate the change in logged second-hand house prices to changes in, inter alia, the log of second-hand house prices squared and cubed, the log of real personal disposable income per capita, the log of the stock of mortgages, the log of retail prices, the log of new construction costs, the log of net advances of mortgages and the rental rate. The lagged residuals of the estimated long run equation are also included as an error correction term. This term is negatively signed implying the gradual elimination of any deviations from the equilibrium house price relation. Overall, the coefficients of the dynamic
model are significant and signed as expected a priori.
Lastly, note that the presence of the squared and cubic terms in the short run specification gives rise to a non-linear relationship between current and lagged house price changes. The nature of this relationship is illustrated by Giussani and Hadjimatheou (1990) who, taking the range of values for Aph, from their sample as the starting point, show that ’for values in the range between 0 and O. 15, the relationship is positive, ie. increases in house prices will trigger expectations of even higher prices. For values outside this range, that is negative and larger than O. 15, the relationship is negative’.
In contrast to the Engle-Granger methodology adopted by Giussani and Hadjimatheou (1990), Drake (1993) models UK house prices using the Johansen cointegration technique. Over the period 1981:1 to 1990: 1, the findings identify a long run equilibrium relation between logged house prices and the log of real personal disposable income, the building society mortgage interest rate, the log of private sector housing starts and a dummy variable. The latter is designed to capture the impact on house prices of the 1988 Budget announcement that dual tax relief on mortgage borrowing would end later that year. The coefficients of the estimated
relation are all correctly signed.
lagged residuals of the cointegrating vector, enters significantly and bearing a negative sign as anticipated.
However, the use of the Johansen technique may not be appropriate in this case given the very small size of the sample. As Juselius (forthcoming) notes ’many simulation studies have demonstrated that the asymptotic distribution [of the Trace statistic] can be a poor approximation to the true distribution when the sample size is small resulting in substantial size and power distortions’4.
Finally, Salo (1994) presents two models of the Finnish housing market over the period 1960 to 1988. The first is a standard demand model based on slow adjustment, while the second
takes the form of a simultaneous model of demand and supply. Particularly noteworthy are the inclusion of an explicit land variable and the adoption of an inter-temporal focus when developing the supply-side equation. In this respect, the paper assumes that the firm’s production decision depends not only on current variables such as the real price of the existing stock, construction costs and an index of the price of building lots, but also on expectations concerning the future market situation5. Reflecting the fact that all dwellings
may not necessarily be sold in the period in which they are produced, a variable measuring the expected cost of unsold production is incorporated into the model. In addition, technological development is captured by the inclusion of a trend.
The empirical results indicate that the coefficients of the estimated supply equation are for the
most part significant and signed as expected a priori. Specifically, current house prices and technology play a positive role in influencing production, whereas the price of building lots is found to negatively impact on the decision to supply housing. On the other hand, the t value
4 [ ] parenthesis inserted.
for the variable capturing future market conditions is somewhat on the low side and the index of construction costs proves incorrectly signed throughout.
3.5. Conclusion
In keeping with the focus of the present research, this chapter sought to provide an overview of the findings of Irish and international studies that have adopted a time series,
macroeconomic approach to modelling housing. The aim in doing so was to facilitate the identification of appropriate factors for inclusion in the empirical models of the Dublin marketplace presented in later chapters. To this end, particular attention was paid to the nature of the explanatory variables put forward by the selected studies and to the validity of the modelling techniques used.
Overall, the literature appears to be in agreement as to the key factors at play in the housing market. Allowing for definitional variations, these broadly encompass price, income, interest rates, credit, building costs, the existing housing stock, demographics, land and government interventionist policies. As anticipated, the empirical findings in this respect also fit well with a priori theoretical expectations as to the determinants of housing demand, supply and price
inflation.
As such, the above variables can be viewed as representing a sound starting point when modelling the Dublin housing market. However, it should be noted that of these potential
Chapter 4:
Data Description
4.1. Introduction
The aim of this chapter is to provide a detailed description of the data series that underlie the
empirical sections of the study. Such an aim is motivated by the fact that it was necessary to refine much of the available data, the consequent result being a need to explain how the individual series are constructed.
The chapter is organised as follows: Section 4.2 defines the variables, data sources and based on a graphical analysis, discusses their time series properties~. Section 4.3 briefly concludes.
4.2. Data Description
The data needed to construct an econometric model of the housing market is reasonably extensive in nature. In identifying potential data series, Chapter 3’s analysis of existing housing literature proved useful as it facilitated the identification of a range of variables, which in terms of precedents, may act as key determinants of demand, supply and price
inflation in the Dublin housing market. A priori expectations in this respect posit that variables such as income, mortgage interest rates, building costs, the existing housing stock, demographics, land availability and government interventionist policies all play an important role in the market, and therefore, should be considered when modelling housing. The precise
definition of the variables used in this study, along with the time series characteristics of the
data, are outlined below for the sample period 1980 quarter one to 2000 quarter four. Note
that most variables are transformed into logs. This allows for the coefficient estimates
presented in later chapters to be interpreted as elasticities. For variables expressed in levels,
the corresponding coefficients are interpretable as semi-elasticities.
4.2.1. New House Prices (nph)
The variable nph measures the average price of new houses in Dublin in real terms. Nominal
house price data is available on a quarterly basis from the ’Housing Statistics Bulletin’
published by the Department of the Environment, Heritage and Local Government. These
figures are in turn derived from information on loan approvals supplied by the main mortgage
lenders. The data is not mix adjusted and therefore does not account for heterogeneity across
new completions.
Figure 4.1: Log of New House Prices expressed in Levels and First Differences
11.75
11.50
11.25 i1.00 10.75
O. 10
1980 19~,5
/"
1990 1995
0.05
0.00
-0.05¸
1980 1985 ItT’~ 1995 2000
While a mix adjusted series, beginning in 1996, is published by the Economic and Social