Original Article
Multivariate analysis for prognostic factors of 282
patients with hepatic encephalopathy
Qian Yang
1*, Rong-Kui Liu
2*, Xue-Mei Liang
3, Qian Han
3, Jun-Feng Wang
4, Lei Yang
51Department of Gastroenterology, Tianjin 4th Centre Hospital, The Clinical Medicine of Tianjin Medical University, Tianjin 300140, China; 2Department of Medical Clinic, Tianjin 4th Centre hospital, Tianjin 300140, China; 3 De-partment of Neurology, The 4th Central Hospital, Tianjin 300140, China; 4Department of Hepatobiliary Surgery, The First People’s Hospital of Yunnan Province, Kunhua Hospital Affiliated to Kunming Medical College, Kunming 650032, China; 5Department of Neurosurgery, Kunming Children’s Hospital, Kunming 650030, China. *Equal contributors.
Received November 19, 2015; Accepted February 3, 2016; Epub August 15, 2016; Published August 30, 2016
Abstract: Objective: To explore the prognostic factors of hepatic encephalopathy (HE) for survival. Methods: We retrospectively reviewed the clinical data of 282 hepatic encephalopathy patients from January 2012 to May 2014 in our hospital. Data base was built using Excel and SPSS 18.0. Multivariate logistic regression statistics were used to analyze 21 possible risk factors, including gender, age, ALB, ALT, K+, Na+, Cl-, PH, TBIL, TBA, PT, APTT, UREA, Ca+,
Mg+, P, NH
3, PaCO2, PaO2, HCO3- and TCO2. Results: The mortality rate of the 282 HE patients was 73.8%. There was
statistical difference in Na+, NH
3, APTT, UREA and ALT. These five factors indicated poor prognosis of patients with
hepatic encephalopathy, whose overall percentage correct was 83.0% and a predictive model: logit(P)=1.638×Na+
(mmol/L) - 2.295×NH3 (umol/L) - 1.812×APTT (sec) - 1.738×UREA (mmol/L) - 1.315×ALT (IU/L) + 3.340 was
devel-oped. Conclusion: The prognosis of patients with hepatic encephalopathy have a variety of factors, hyponatremia, hyperammonemia, prolonged APTT, high urea and high ALT were found to be potential risk factors for prognosis of hepatic encephalopathy. Monitoring these factors may be helpful to detect the development of hepatic encepha-lopathy in time.
Keywords: Hepatic encephalopathy, hyponatremia, multivariate analysis, risk factors, prognosis
Introduction
Hepatic encephalopathy is a common
compli-cations of hepatic diseases, which is defined as
a metabolically induced, potentially reversible
functional disturbance of the brain that may
occur in acute or chronic liver diseases [1]. It is
characterized by disturbances of
conscious-ness and other neuropsychiatric
manifesta-tions, which are due to metabolic disturbances
associated with liver disease or portosystemic
shunts [2]. Acute hepatic encephalopathy
asso-ciated with acute liver failure and characterized
by cerebral edema and raised intracranial
pres-sure [3, 4]. This is likely to be manifested as
hepatic coma. Subacute or subclinical hepatic
encephalopathy associated with hepatic
cirrho-sis and associated with abnormal findings on
neuropsychological testing. Chronic hepatic
encephalopathy associated with hepatic
cirrho-sis [4]. Encephalopathy often occurs together
with other symptoms and signs of liver failure.
These may include jaundice, ascites and
periph-eral edema [5, 6]. The tendon reflexes may be
exaggerated, and the plantar reflex may be
abnormal. When HE breaks out, patients
usu-ally feel fatigue and weak, and there is no omen
before outbreak. This is mainly because HE will
cause disorder of internal environment and
metabolic function.
Patients and methods
Subjects
From January 2012 to May 2014, a total of 282
HE patients admitted to our hospital were
enrolled in this prospective study. All patients
who were discharged home were followed in
the outpatient clinic for three months. All the
HE patients were inflicted with severe liver as
well as abnormal mental symptoms and
physi-cal signs. It is based on two kinds of symptoms
[7, 8]. Mental condition impairment is based on
Conn index, the damage of neuromotor
func-tion [9], which includes hyperreflexia, stiff
response, muscle cramps, and asterixis,
mea-sured by asterixis grade apparatus [10]. The
grade of liver function is according to
Child-TurcottPugh (abbreviated as Child grade) [11,
12]. HE grade adopts the West-Haven rating
method [13]. HE was divided into four types
from light mental change to deep coma
accord-ing to HE mental condition classification
stan-dard (
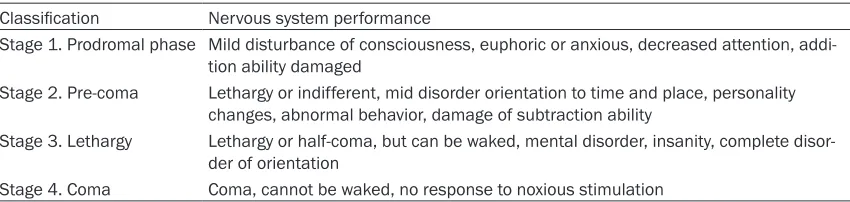
Table 1
).
Methods
282 clinical data were analyzed by SPSS 18.0
statistical software using the χ
2test, Student
t-test, or Wilcoxon rank-sum test. Risk factors
for HE were analyzed using multivariate logistic
regression. The goodness of fit was tested by
the Hosmer-Leme show test and predicting
veracity was verified by classification table.
Odds ratio (OR) values were calculated from
95% CI. Statistical significance was established
at P<0.05.
Results
Clinical findings
Among the 282 patients, 198 were male, 84
female, with the aged ranging from 14 to 87
(54.28±13.62) years old. The primary diseases
were cirrhosis after hepatitis in 84 patients,
pri-mary hepatic carcinoma in 60 patients, acute
hepatic failure in 40 patients, acute-on-chronic
liver failure in 34 patients, alcoholic cirrhosis in
28 patients, after TIPS operation in 18 patients,
drug cirrhosis in 12 patients, and biliary
cirrho-sis in 6 patients. Of the 282 patients with
hepatic encephalopathy, 208 patients (73.8%)
were dead within three months and 74 patients
(26.2%) survived. The clinical data of the 282
patients were listed in
Table 2
.
Multiple logistic regression analysis
To identify prognostic factors of 282 patients
with hepatic encephalopathy, we performed
stepwise multiple logistic regression analysis
using the data in
Table 2
. Among the 42
vari-ables, five independent factors (Na
+, NH
3
, APTT,
UREA and ALT) significantly correlated with
the development of hepatic encephalopathy, as
shown in
Table 3
, and prediction equation
was determined as follows: logit(P)=1.638×
Na
+(mmol/L) - 2.295×NH
3
(umol/L) - 1.812×
APTT (sec)-1.738×UREA (mmol/L) - 1.315×ALT
(IU/L) + 3.340.
Verification of equation
The specificity for predicting the development
of encephalopathy was very high, although the
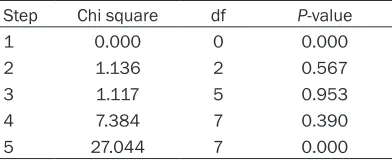
sensitivity was insufficient. The goodness of fit
was tested by the Hosmer-Lemeshow test
(
Table 4
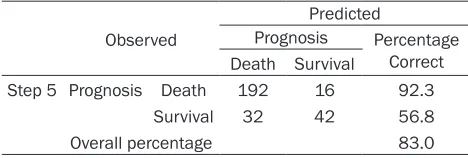
) and predicting veracity was verified by
classification table (
Table 5
), which suggested
that the overall percentage correct was 83.0%.
Discussions
[image:2.612.93.518.83.184.2]The pathogenesis of hepatic encephalopathy is
multifactorial and has not yet been completely
elucidated. In this study, the death rate of
patients with hepatic encephalopathy was
Table 1.
HE classification (West-Haven standard) based on mental condition
Classification Nervous system performance
Stage 1. Prodromal phase Mild disturbance of consciousness, euphoric or anxious, decreased attention, addi-tion ability damaged
Stage 2. Pre-coma Lethargy or indifferent, mid disorder orientation to time and place, personality changes, abnormal behavior, damage of subtraction ability
Stage 3. Lethargy Lethargy or half-coma, but can be waked, mental disorder, insanity, complete disor-der of orientation
Table 2.
The clinical data of the patients
Items* Classification Number Death Percentage Normal value
Gender Male 198 140 70.7%
Female 84 68 81.0%
Age (years) 10-30 years 8 6 75.0% 31-50 years 88 72 81.8% 51-70 years 152 110 72.4% 71-90 years 34 20 58.8%
ALB (g/L) Normal 20 16 83.3% 35-50 g/L Abnormal 262 192 67.8%
ALT (IU/L) Normal 138 88 63.8% 0-50 IU/L Abnormal 144 120 83.3%
K+ (mmol/L) Low 84 56 66.7% 3.5-5.5 mmol/L
Normal 186 142 76.3%
High 12 10 83.3%
Na+ (mmol/L) Low 194 170 87.6% 135-150 mmol/L
Normal 88 38 43.2%
Cl (mmol/L) Low 134 116 86.6% 96-108 mmol/L Normal 126 84 66.7%
High 22 8 36.4%
PH Acid 30 28 93.3% 7.35-7.45
Neutral 144 114 79.2%
Base 108 66 61.1%
TBIL (umol/L) Normal 12 2 16.7% 1.7-20 umol/L High 270 206 76.3%
TBA (umol/L) Normal 30 20 66.7% 0-15 umol/L High 252 188 61.0%
PT (sec) Normal 22 10 45.4% 9-14 sec High 260 198 76.2%
APTT (sec) Normal 66 38 57.6% 20-40 sec High 216 170 78.7%
Urea (mmol/L) Normal 110 62 56.4% 1.7-8.3 mmol/L High 172 146 84.9%
Ca+ (mmol/L) Low 180 140 77.8% 2-2.6 mmol/L
Normal 100 66 66.0%
High 2 2 100%
Mg+ (mmol/L) Low 26 16 61.5% 0.65-1.05 mmol/L
Normal 220 158 71.8%
High 36 34 94.4%
P (mmol/L) Low 104 82 78.8% 0.8-1.5 mmol/L Normal 156 112 71.8%
High 22 14 63.6%
NH3 (umol/L) Normal 182 114 62.6% 2-60 umol/L
High 100 94 94.0%
PaCO2 (mmHg) Low 224 174 77.7% 36-44 mmHg
Normal 52 32 61.5%
High 6 2 33.3%
PaO2 (mmHg) Low 90 74 82.2% 75-100 mmHg Normal 106 74 69.8%
Table 4.
Hosmer and lemeshow test
Step Chi square df P-value 1 0.000 0 0.000 2 1.136 2 0.567 3 1.117 5 0.953 4 7.384 7 0.390 5 27.044 7 0.000
Note: When P-value >0.05, no evidence of lack of fitting. When P-value <0.05, the model is rejected and try to put more explanatory variables. For step 5, it is used to confirm that step 4 is the best result.
HCO3- (mmol/L) Low 172 138 80.2% 22-27 mmol/L
Normal 88 56 63.6%
High 22 14 63.6%
TCO2 (mmol/L) Low 170 136 80.0% 23-27 mmol/L
Normal 76 52 68.4%
High 36 20 55.6%
Abbreviations: ALB: Albumin; ALT: Alamine aminotransferase; [Na+]: Serum sodium; [K+]: Serum potassium; [Cl]: Chlorine; TBIL:
total bilirubin; TBA: Total bile acid; PT: Prothrombin time; APTT: Activated partial thromboplastin time; [Ca+]: Calcium; [Mg+]:
Se-rum magnesium; [P]: SeSe-rum inorganic phosphorus; NH3: Blood ammonia; PaCO2: Artery carbon dioxide partial pressure; PaO2: Artery oxygen partial pressure; [HCO3-]: Blood bicarbonate. *All the items in the table are adjusted. Because of rounding, not all
percentages total 100.
87.6% among the 194 patients having
hypona-tremia. This is the first evidence for suscep-
tibility of prognosis of hepatic encephalopathy
determined on the basis of prospective
obser-vations. Hyponatremia is common in patients
with hepatic encephalopathy because of the
activation of antidiuretic hormone secondary
to decreased effective arterial volume [14-16].
Hyponatremia is the most common electrolyte
disorder in HE patients [17] and hyponatremia
can also induce and aggravate HE [18, 19].
Chronic hyponatremia depletes intracellular
[20, 21]. Although this test is not widely used in
general practice, the fact that two thirds of HE
patients with prolonged APTT died indicate that
prolonged APTT may predict the deterioration
of HE to some degree.
Our data also supported the findings and
recon-firmed the high death rate of HE patients with
hyperammonemia, which is the increase of
blood ammonia concentration caused by urea
synthesis obstruction when liver functions
badly damage [22]. Hyperammonemia is
con-sidered a main contributor to the neurological
alterations in hepatic encephalopathy [23].
Ammonia is assumed to play an important role
by either directly or indirectly affecting brain
metabolism and/or neurotransmission [22,
24-27]. Serious hyperammonemia patients
have distinct symptoms such as cerebral
atro-phy [28], thin and transparent cortex, the
expansion of tricorn and third ventricle.
Ammonia combines with α-ketoglutaric acid in
the brain and produces glutamic acid and
glu-tamine which will consume α-ketoglutaric acid.
This will cause the decrease of α-ketoglutaric
Table 3.
Multiple logistic regressions for predicting prognosis
of hepatic encephalopathy
Variants Correlation Coefficient Standard Error P Adjusted odds ratio (95% CI) Na+ (mmol/L) 1.638 0.516 0.001 0.194 (0.071, 0.534)
NH3 (umol/L) -2.295 0.743 0.002 0.101 (0.023, 0.432) APTT (sec) -1.812 0.649 0.005 0.163 (0.046, 0.583) UREA (mmol/L) -1.738 0.571 0.002 0.176 (0.057, 0.538) ALT (IU/L) -1.315 0.561 0.019 0.268 (0.089, 0.805) Constant 3.340 —— —— ——
Abbreviations: [Na+]: Serum sodium; NH
3: Blood ammonia; APTT: Activated
partial thromboplastin time; ALT: Alamine aminotransferase. Adjusted factors: ALB, ALT, [Na+], [K+], [Cl], TBIL, TBA, PT, APTT, [Ca+], [Mg+], [P], NH
3, PaCO2,
PaO2, [HCO3-].
organic osmolytes, including
myo-inositol, which regulates
intracel-lular water content so as to
aggra-vate brain edema and cause
ener-gy metabolism disorder in brain
cells by affecting osmotic
pres-sure [14, 15]. The result can be
fatal if correct diagnosis and
prop-er treatment do not proceed in
time.
[image:4.612.91.287.437.517.2]Table 5.
Classification table
aObserved
Predicted
Prognosis Percentage Correct Death Survival
Step 5 Prognosis Death 192 16 92.3 Survival 32 42 56.8 Overall percentage 83.0
a: The cut value is .500.
acid in brain and obstruction of tricarboxylic
acid cycle [22, 24, 29]. The brain tissue will
occur dysfunction even coma [28]. Therefore,
the detection system for blood ammonia
con-centration is required for the accurate
predic-tion of the development of hepatic encepha-
lopathy.
Urea is the end-product of protein metabolism,
mainly drained with urine after glomerular
fil-tration. Atiq. M [30] reported that deficiency of
any of the 5 enzymes in the urea cycle results
in the accumulation of ammonia, leading to
encephalopathy; which if untreated, can be
lethal and produce devastating neurologic
sequelae in long-term survivors. The increase
of blood urea is influenced by various factors,
such as high protein diet, hemorrhage of
diges-tive tract, wound and infection [31]. Increased
urea often suggests the diseases in liver and
kidney, as well as the damage of their
func-tions. The increase of blood urea often appears
in the early-stage of HE and predicts poor
prog-nosis in the end-stage. This is possibly
associ-ated with hyperammonemia because intestinal
bacteria can resolve amounts of urea into
blood ammonia in the long term and Atiq. M
[30] also reported an interesting case that
pre-sented with hyperammonemia and
encepha-lopathy; later found to have a urea cycle defect
in his paper, which consistent with our spe-
culation.
Alanine transaminase (ALT) mainly exists in
hepatic cells, which is recommended as the
most sensitive index to reflect hepatic
dysfunc-tion [32, 33]. When the hepatic cells damage,
ALT will release into blood and cause the
increase of serum ALT [33]. So the increase of
ALT is often associated with hepatic diseases
[34], such as hepatitis, cirrhosis and
hepato-cellular carcinoma. The harms of increased ALT
include hepatocellular constant injuries and
the dysfunction of hepatic metabolism and
In conclusion, through multivariate analyses in
our study, hyponatremia, hyperammonemia,
prolonged APTT, high urea and high ALT were
found to be potential risk factors for prognosis
of hepatic encephalopathy. Therefore, it is
nec-essary to establish a method of predicting
hepatic encephalopathy development and
monitoring these factors may be helpful to
detect the development of hepatic
encepha-lopathy in time.
Disclosure of conflict of interest
None.
Address correspondence to: Dr. Jun-Feng Wang, Department of Hepatobiliary Surgery, The First People’s Hospital of Yunnan Province, Kunhua Hospital Affiliated to Kunming Medical College, Kunming 650032, China. E-mail: wangjunfpok@163. com; Dr. Lei Yang, Department of Neurosurgery, Kunming Children’s Hospital, Kunming 650030, China. E-mail: [email protected]
References
[1] Cash WJ, McConville P, McDermott E, McCormick PA, Callender ME, McDougall NI. Current concepts in the assessment and treat-ment of hepatic encephalopathy. QJM 2010; 103: 9-16.
[2] Prakash R, Mullen KD. Mechanisms, diagnosis and management of hepatic encephalopathy. Nat Rev Gastroenterol Hepatol 2010; 7: 515-25.
[3] Desjardins P, Du T, Jiang W, Peng L, Butterworth RF. Pathogenesis of hepatic encephalopathy and brain edema in acute liver failure: role of glutamine redefined. Neuro Chem Int 2012; 60: 690-6.
[4] Rama Rao KV, Norenberg MD. Brain energy metabolism and mitochondrial dysfunction in acute and chronic hepatic encephalopathy. Neuro Chem Int 2012; 60: 697-706.
[5] Kapoor BS, Hunter DW, Greeno E, Pambuccian S, Sielaff T. Hepatic encephalopathy second-ary to transtumoral portal-hepatic venous
shunting. Hepatogastroenterology 2003; 50: 4-7.
[6] Wilkinson DJ, Smeeton NJ, Castle PC, Watt PW. Absence of neuropsychological impairment in hyperammonaemia in healthy young adults; possible synergism in development of hepatic encephalopathy (HE) symptoms? Metab Brain Dis 2011; 26: 203-12.
[7] Munoz SJ. Hepatic encephalopathy. Med Clin North Am 2008; 92: 795-812.
[8] Stewart CA, Malinchoc M, Kim WR, Kamath PS. Hepatic encephalopathy as a predictor of survival in patients with end-stage liver dis-ease. Liver Transpl 2007; 13: 1366-71. [9] Summerskill WH. Management of the Hepatic
Coma Syndromes. Mod Treat 1964; 15: 420-33.
[10] Conn HO, Leevy CM, Vlahcevic ZR, Rodgers JB, Maddrey WC, Seeff L, Levy LL. Comparison of lactulose and neomycin in the treatment of chronic portal-systemic encephalopathy. A double blind controlled trial. Gastroenterology 1977; 72: 573-83.
[11] De Rose M, Luzi M, Trignani R, Passamonti C, Zamponi N, Lavano A, Rychlicki F. Cingulate epilepsy in a child with a low-grade glioma. Childs Nerv Syst 2009; 25: 1507-11.
[12] Opiyo N, Shepperd S, Musila N, English M, Fretheim A. The “Child Health Evidence Week” and GRADE grid may aid transparency in the deliberative process of guideline development. J Clin Epidemiol 2012; 65: 962-9.
[13] Citro V, Milan G, Tripodi FS, Gennari A, Sorrentino P, Gallotta G, Postiglione A, Tarantino G. Mental status impairment in pa-tients with West Haven grade zero hepatic en-cephalopathy: the role of HCV infection. J Gastroenterol 2007; 42: 79-82.
[14] Yun BC, Kim WR. Hyponatremia in hepatic en-cephalopathy: an accomplice or innocent by-stander? Am J Gastroenterol 2009; 104: 1390-1391.
[15] Guevara M, Baccaro ME, Torre A, Gómez-Ansón B, Ríos J, Torres F, Rami L, Monté-Rubio GC, Martín-Llahí M, Arroyo V, Ginès P. Hyponatremia is a risk factor of hepatic en-cephalopathy in patients with cirrhosis: a pro-spective study with time-dependent analysis. Am J Gastroenterol 2009; 104: 1382-9. [16] Baccaro ME. Hyponatremia predisposes to
he-patic encephalopathy in patients with cirrho-sis. Results of a prospective study with time-dependent analysis. Hepatology 2006; 44: 233a-233a.
[17] Martín-Llahí M, Guevara M, Ginès P. Hyponatremia in cirrhosis: clinical features and management. Gastroenterol Clin Biol 2006; 30: 1144-51.
[18] Heins J, Zwingmann C. Organic osmolytes in hyponatremia and ammonia toxicity. Metab Brain Dis 2010; 25: 81-9.
[19] Córdoba J, Gottstein J, Blei AT. Chronic hypona-tremia exacerbates ammonia-induced brain edema in rats after portacaval anastomosis. J Hepatol 1998; 29: 589-94.
[20] Wiwanitkit V. Activated partial thromboplastin time abnormality in patients with cholangiocar-cinoma. Clin Appl Thromb Hemost 2004; 10: 69-71.
[21] Pagliano FM, Slucca P, Cestari G. A new system of analysis for partial thromboplastin time. Comparison with other blood coagulation tests in liver diseases. Arch Sci Med (Torino) 1976; 133: 321-325.
[22] Tranah TH, Vijay GK, Ryan JM, Shawcross DL. Systemic inflammation and ammonia in he-patic encephalopathy. Metab Brain Dis 2013; 28: 1-5.
[23] McKinney AM, Sarikaya B, Spanbauer J, Lohman BD, Uhlmann E. Acute hepatic (or hy-perammonemic) encephalopathy: diffuse cor-tical injury and the significance of ammonia. AJNR Am J Neuroradiol 2011; 32: E142 [24] Shawcross DL, Wright G, OldeDamink SW,
Jalan R. Role of ammonia and inflammation in minimal hepatic encephalopathy. Metab Brain Dis 2007; 22: 125-38.
[25] Butterworth RF. Pathophysiology of hepatic en-cephalopathy: a new look at ammonia. Metab Brain Dis 2002; 17: 221-7.
[26] Peltz S, Schwartzman S, Cohen B. Ammonia encephalopathy. N J Med 1989; 86: 554-6. [27] Butterworth RF, Giguère JF, Michaud J, Lavoie
J, Layrargues GP. Ammonia: key factor in the pathogenesis of hepatic encephalopathy. Neuro Chem Pathol 1987; 6: 1-12.
[28] McPhail MJ, Dhanjal NS, Grover VP, Taylor-Robinson SD. Ammonia and cerebral water. Importance of structural analysis of the brain in hepatic encephalopathy. J Hepatol 2012; 56: 506.
[29] Elgudin L, Hall Y, Schubert D. Ammonia in-duced encephalopathy from valproic acid in a bipolar patient: case report. Int J Psychiatry Med 2003; 33: 91-6.
[30] Atiq M, Holt AF, Safdar K, Weber F, Ravinuthala R, Jonas ME, Neff GW. Adult onset urea cycle disorder in a patient with presumed hepatic encephalopathy. J Clin Gastroenterol 2008; 42: 213-4.
[31] Abstracts of the 6th International Symposium on Ammonia--Advances in Hepatic Encepha- lopathy and Urea Cycle Diseases. The Ne- therlands, 27-29 April, 1987. J Hepatol 1987; 4 Suppl 1: S1-53.
Suzuki Y, Kawaguchi T, Chayama K, Tanaka S, Fujimoto K, Anzai K, Saibara T, Sata M, Itoh Y, Nakajima A, Okanoue T; Japan Study Group of NAFLD (JSG-NAFLD). Simple scoring system for predicting cirrhosis in nonalcoholic fatty liver disease. World J Gastroenterol 2014; 20: 10108-14.
[33] Moylan CA, Suzuki A, Papay JI, Yuen NA, Ames M, Hunt CM. A marketing ALT signal pre-dicts post-marketing liver safety. Regul Toxicol Pharmacol 2012; 63: 433-9.
[34] Lin CL, Tseng TC, Kao JH. What can we learn from hepatitis B virus clinical cohorts? Liver Int 2015; 35 Suppl 1: 91-9.
[35] Miyake T, Kumagi T, Hirooka M, Koizumi M, Furukawa S, Ueda T, Tokumoto Y, Ikeda Y, Abe M, Kitai K, Hiasa Y, Matsuura B, Onji M. Metabolic markers and ALT cutoff level for di-agnosing nonalcoholic fatty liver disease: a community-based cross-sectional study. J Gastroenterol 2012; 47: 696-703.
[36] Garcea G, Ngu W, Neal CP, Dennison AR, Berry DP. Bilirubin levels predict malignancy in pa-tients with obstructive jaundice. HPB (Oxford) 2011; 13: 426-30.
[37] Xie Q, Hu X, Zhang Y, Jiang X, Li X, Li J. Decreasing hepatitis B viral load is associated with a risk of significant liver fibrosis in hepati-tis B e antigen positive chronic hepatihepati-tis B. J Med Virol 2014; 86: 1828-37.