1
Synthesis of Metal-Organic Frameworks by Continuous Flow
Peter A. Bayliss,a Ilich A. Ibarra,a,b Eduardo Pérez,a Sihai Yang,a Chiu C. Tang,c Martyn Poliakoffa* and Martin Schrödera*
[a] School of Chemistry, University of Nottingham, University Park, NG7 2RD (UK)
[b] Instituto de Investigaciones en Materiales, Universidad Nacional Autónoma de México, Circuito Exterior s/n, CU, Del. Coyoacán, 04510, México D.F., Mexico
[c] Diamond Light Source, Harwell Science and Innovation Campus, Didcot, Oxfordshire, OX11 0DE, (UK)
[*] E-mail: Martyn.Poliakoff@nottingham.ac.uk; M.Schroder@nottingham.ac.uk; Fax: +44 115 951 3563
Keywords
2
Abstract
A continuous flow process for the synthesis of a metal-organic framework using only water as the reaction medium and requiring only short residence times is described. This affords a new route to scale-up of materials incorporating many of the principles of green chemistry. The process is demonstrated by the synthesis MIL-53(Al) via continuous flow reaction requiring only 5-6 minutes with a space time yield of 1300 kg m-3 d-1. We have demonstrated the synthesis of 500 g of MIL-53(Al) using this process, which can be scaled-up further by simply feeding further solutions of metal salt and ligand through the reactor. The product has a higher surface area and a better colour than a commercially produced sample of this MOF. In addition, a new and effective method for the extraction of terephthalic acid from within the pores of MIL-53(Al) using supercritical ethanol has been developed, representing a new methodology for activation and removal of substrates from porous hosts.
___________________________________________________________________________
Introduction
Metal-organic frameworks (MOFs) are currently the focus of intense scientific interest due to their wide range of potential applications in gas storage1,2 and separation,3 catalysis,4,5 drug delivery,6-8 and as thermo-active,9 conducting10,11 and electronic12,13 materials. Of particular interest to us is the potential of MOFs to store and purify fuel and exhaust gases.14 For industrial scale applications, MOFs must not only possess the desired functionality and properties, but their synthesis and processing must be scalable at low cost to give products in high yield and purity. Increasing environmental awareness and commercial constraints mean that synthetic processes must be as green as possible, and water is thus an attractive solvent for the synthesis of MOFs.15,16
3 using interfacial synthesis to produce hollow MOF capsules on a small scale,28 and utilising rapid solvent mixing.29,30 Significantly, however, these methods still make use of organic solvents such as 1-octanol,28 DMF29 and EtOH.30 One of our objectives is to completely eliminate the use of toxic/organic solvents by using high temperature water (HTW). In previous reports water has been successfully use as the reaction solvent for the synthesis of MOF materials.15,16,31 Herein we confirm that HTW can be used to reduce the reaction times from days to minutes in order to prepare porous materials rapidly and cleanly with excellent potential for scale-up, particularly under continuous flow. We demonstrate this methodology by using HTW to produce MIL-53(Al), a benchmark MOF that combines thermal stability with porosity32 and adsorption selectivity.33 We combine this with a new strategy for removal of guest molecule in MIL-53(Al) using supercritical EtOH.
Results and discussion
We have previously reported the use of HTW for the batch synthesis of MOFs, but the reaction generally required 48 hr for completion.15 We have now developed this further such that the batch reaction of Al(NO3)3 with terephthalic acid (H2L1) in HTW at 250 °C yielded porous MIL-53(Al) in 10 min. A molar ratio for Al(NO3)3: H2L1 of 2:3 was used with concentrations of 0.04 mol dm-3 and 0.06 mol dm-3, respectively. The identity and composition of the MIL-53(Al) produced by this method was confirmed by powder X-ray diffraction (PXRD) and characterised further by thermal gravimetric analysis (TGA) and gas adsorption isotherms. Given that this represents a reduction in reaction time from 3 days to 10 min., 34 we reasoned that this new approach could be developed further towards scale-up via continuous processing. However, H2L1 is insoluble in cold water and is thus difficult to use in a continuous flow process using water. Thus, a trial batch reaction was carried out using disodium terephthalate (Na2L1), which is water-soluble. This yielded MIL-53(Al) identical to the experiments using H2L1 (Scheme 1). Reactions in batch were then carried out to establish whether the reaction temperature could be reduced whilst still using reaction times of 10 minutes. Batch reactions at 200 °C afforded product that is less crystalline as confirmed by PXRD which shows significant peak broadening, while reactions at 150 °C afforded almost no MOF product and much of the H2L1 could be isolated as unreacted starting material.
4 temperature of the reactor is kept constant using resistance heaters and a temperature controller (Eurotherm 2216L), and downstream, the mixture is cooled by a heat exchanger. The solid product is recovered by a Tee filter (0.5 μm) and after filtration the liquid by-product stream enters a Back Pressure Regulator (BPR). The use of filtration enables the product to be recovered dry, and minimises the chance of BPR malfunctions. Two sets of filters and BPRs are installed in parallel to facilitate continuous operation of the system.
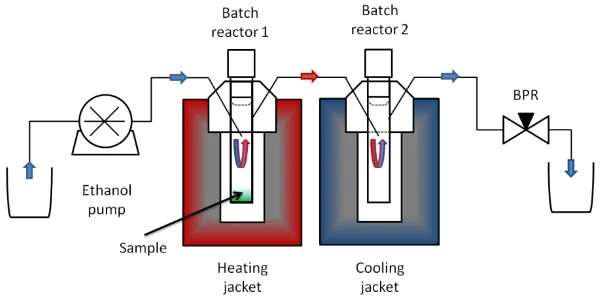
Reaction of Al(NO3)3 with Na2L1 in the continuous reactor in a 1:1 ratio at 0.05 mol dm-3 concentration gave high quality MIL-53(Al), and running the reaction for 20 minutes gave 0.5 g of product as a white powder (yield: 86% crude, 59% after removal of terephthalic acid from pores, based on Al utilisation and product [AlOH(L1)]n). Both the as-synthesised batch and continuous flow products are microcrystaline and match known MIL-53(Al) phases. MIL-MIL-53(Al) is known to exhibit a breathing effect and phase transitions induced by heating or by uptake and removal of guest species.34-38 Furthermore, the as-synthesised phase, MIL-53(Al)ta, contains uncoordinated H2L1 trapped within the pores and this requires removal to maximise its porosity. Usually removal of trapped H2L1 is achieved via calcination involving heating at 330 °C for 3 days34 or washing with DMF.35,36 In order to remove this uncoordinated ligand we developed a new procedure involving extraction of the product with supercritical ethanol (scEtOH) at 250 °C and 100 bar for 2 hr. This method effectively removes the uncoordinated H2L1 from within the pores without decomposing the material. The extraction rig (Figure 2) used liquid ethanol at a flow rate of 0.5 ml min-1, a back pressure of 100 bar with the first batch reactor held at 250 °C for 2 h. Removal of in-pore H2L1 could be readily monitored by by PXRD (Figure S3), TGA (Figure S14) and ATR-FTIR (Figure S16).
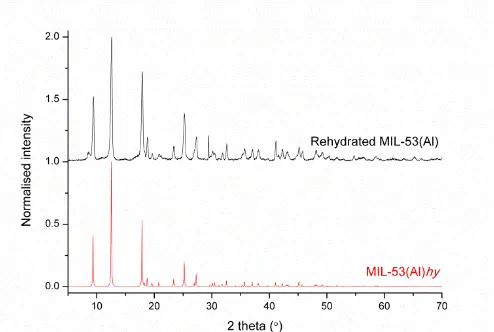
The removal of H2L1 causes a phase change to a more open structure, MIL-53(Al)op, and this converts to the hydrated form, MIL-53(Al)hy, upon adsorption of water. The major phase using HTW in batch reaction is MIL-53(Al)ta. In continuous flow, the same phase is isolated but MIL-53(Al)hy is also present in the product (Figure 3a). PXRD analysis of products obtained from batch and by continuous flow reactions shows no peaks for γ-AlO(OH), H2L1
5 al.34 where 0.7 equivalents of free H2L1 was observed in the material. The product formed by continuous process shows similar thermal stability and contains 0.41 equivalents of free H2L1 as determined by TGA.
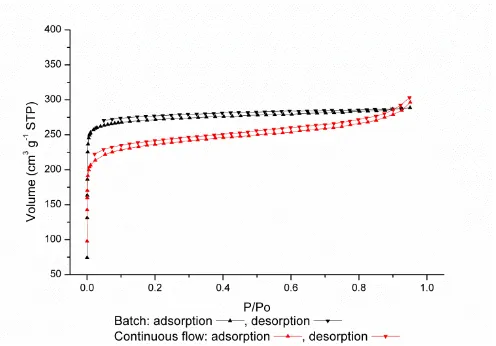
MIL-53(Al) prepared at 250 °C using batch and continuous flow processes was treated with scEtOH to remove free H2L1 from the pores (see ESI for details). This was followed by activation of the sample at 125 °C under vacuum overnight, and the N2 adsorption was recorded for samples. The isotherms are type I as expected for this microporous material and the maximum uptakes (at 0.95 P/P0) for the batch and continuous flow samples were 289 cm-3 g-1 and 296 cm-3 g-1, respectively (Figure 5). BET surface areas for the batch and continuous flow samples were 1097 m² g-1 and 919 m² g-1, respectively, consistent with previously reported values for MIL-53(Al) of between 1270 m2 g-1 and 933 m2 g-1.32,34,39 A significant feature of MIL-53 materials is their framework flexibility upon gas loading. Importantly, the desolvated MIL-53(Al) sample produced via continuous flow in HTW exhibits the same expected framework phase transition upon CO2 adsorption (Figure S17). Therefore, this HTW method does not alter the nature of the MOF material produced suggesting wider applicability of continuous flow to produce other MOFs. However, it is important to select the right reaction conditions to produce a highly porous material. The effect of temperature on the surface area and gas uptake of the material produced was investigated by performing the reactions between 200 and 300 °C. These results, summarised in Table 1, confirm that the optimum temperature for this system is 250 °C.
6 However at the current scale of MOF manufacturing, disposal of these wastes does not pose a significant problem.
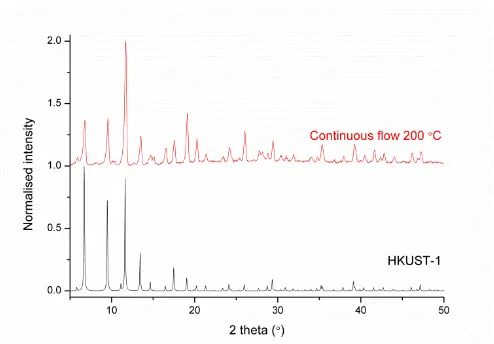
In order to demonstrate further the scope of the above methods, the MOF material HKUST-1 was synthesised in high temperature ethanol as the reaction solvent, first in batch and then using the continuous process. HKUST-1 has been synthesised previously in continuous flow,28,29,43 and using ethanol in batch.44 The process reported here combines the use of the green solvent ethanol and a continuous process, and PXRD of the isolated materials from this process confirms the formation of HKUST-1 (Figure 7). As both the trimesic acid ligand (H3L2) and Cu(NO3)2 are soluble in ethanol the use of ligand salts was not required in this case. No free ligand was recovered with the MOF material and so a second purification step was not necessary. The material produced by continuous process had a surface area of 1554 m2 g-1, a maximum N2 uptake of 417 cm3 g-1 (0.95 P/P0), and a pore volume of 0.62 cm3 g-1 (Figure S15). The space time yield of HKUST-1 in this process was 730 kg m-3 d-1.
Conclusions
7
Experimental
All reagents and solvents were used as received from commercial suppliers without further purification for both the batch and the continuous reactions.
Synthesis of MIL-53(Al)
Batch Synthesis: The synthesis of {[AlOH(L1)]·0.8 H2L1}n, MIL-53(Al)in water was carried out in a high-pressure stainless steel batch reactor (10 ml of internal volume). The reactor was located in an aluminium heating block surrounded by an electric band heater (1 kW) with a cooling jacket for rapid cooling. Details of the device have been previously reported.48 Al(NO3)3·9H2O (112.9 mg, 0.301 mmol), H2L1(75.0 mg, 0.451 mmol) and water (5.0 ml) were transferred into the reactor, and the reaction mixture rapidly heated by preheating the aluminium block 20 °C higher than the desired temperature. The time required to reach the target reaction temperature is ca 5 min, and the system was kept at the target reaction temperature for 10 min and rapidly quenched using the cooling jacket. The product was recovered by filtration, washed with water and acetone, and dried in air. The reaction gave a white powder with a yield of 54 mg (91%) and a purified yield after scEtOH extraction of 39 mg (66%).
Continuous Process: General conditions involved a flow rate of 1.0 ml min-1 to give a total flow rate of 3.0 ml min-1 of water. The pressure of the system (230 bar), and the temperature of the preheater and the reactor (300 °C and 250 °C, respectively) were set to the desired values. Once the temperatures were stable, the streams were changed to metal salt and ligand solutions and the flows passed through Filter 1 for 20 min. The three way valve was then switched to Filter 2 and next batch of product collected for 20 min, while product in Filter 1 was collected and a new filter inserted. After 20 min, the three way valve was switched back to Filter 1, new reaction conditions set and while the product in Filter 2 was collected and the filter, further product was collected in Filter 1. This process can be repeated for as long as sufficient metal salt and carboxylate ligand can be supplied.
Synthesis of HKUST-1
8 the concentration in the reactor was 0.05 mol dm-3 and 0.03 mol dm-3, respectively. After 15 minutes the reaction yielded 0.536 g of HKUST-1 as a blue powder. The powder contained 31.3% solvent as determined by TGA and so the yield of dry MOF was 63% with the product defined as [Cu3(C6H3(CO2)3]n.
Acknowledgments
We thank EPSRC and the University of Nottingham for support, and the CVCP and University of Nottingham (to EP) for funding. We gratefully acknowledge the receipt of an ERC Advanced Grant (to MS), a University of Nottingham 2012 EPSRC Doctoral Prize (to PAB), funding from CONACyT (to IAI), and a Leverhulme Trust Early Career Research Fellowship and a Nottingham Research Fellowship (to SY). We thank Diamond Light Source for access to Beamline I11.
References
1. S. Q. Ma and H. C. Zhou, ChemComm., 2010, 46, 44-53.
2. X. Lin, N. R. Champness and M. Schröder, Topics in Current Chem., 2010, 293, 35-76
3. J.-R. Li, R. J. Kuppler and H.-C. Zhou, Chem. Soc. Rev., 2009, 38, 1477 - 1504. 4. J. Lee, O. K. Farha, J. Roberts, K. A. Scheidt, S. T. Nguyen and J. T. Hupp,
Chem. Soc. Rev., 2009, 38, 1450-1459.
5. L. Ma and W. Lin, Topics in Current Chem., 2010, 293, 175-205 6. N. J. Hinks, A. C. McKinlay, B. Xiao, P. S. Wheatley and R. E. Morris,
Microporous and Mesoporous Mat., 2010, 129, 330-334.
7. R. C. Huxford, J. Della Rocca and W. Lin, Curr. Op. in Chem. Biol., 2010, 14, 262-268.
8. A. C. McKinlay, R. E. Morris, P. Horcajada, G. Férey, R. Gref, P. Couvreur and C. Serre, Angew. Chem. Int. Ed., 2010, 49, 6260-6266.
9. F. Jeremias, A. Khutia, S. K. Henninger and C. Janiak, J. Mat. Chem., 2012, 22, 10148-10151.
10. D. Umeyama, S. Horike, M. Inukai, Y. Hijikata and S. Kitagawa, Angew. Chem. Int. Ed., 2011, 50, 11706-11709.
11. J. A. Hurd, R. Vaidhyanathan, V. Thangadurai, C. I. Ratcliffe, I. L. Moudrakovski and G. K. H. Shimizu, Nature Chem., 2009, 1, 705-710.
12. N. Roques, V. Mugnaini and J. Veciana, Topics in Current Chem., 2010, 293, 207-258
13. M. Kurmoo, Chem. Soc. Rev., 2009, 38, 1353-1379.
9 15. I. A. Ibarra, P. A. Bayliss, E. Perez, S. Yang, A. J. Blake, H. Nowell, D. R. Allan,
M. Poliakoff and M. Schröder, Green Chem., 2012, 14, 117-122.
16. S. Yang, J. Sun, A. J. Ramirez-Cuesta, S. K. Callear, I. W. F. David, D. P. Anderson, R. Newby, A. J. Blake, J. E. Parker, C. C. Tang and M. Schröder, Nature Chem., 2012, 4, 887-894.
17. Y. Yan, S. Yang, A. J. Blake, W. Lewis, E. Poirier, S. A. Barnett, N. R. Champness and M. Schröder, ChemComm., 2011, 47, 9995-9997.
18. M. Kim, J. A. Boissonnault, C. A. Allen, P. V. Dau and S. M. Cohen, Dalton, 2012, 41, 6277-6282.
19. X. Lin, A. J. Blake, C. Wilson, X. Z. Sun, N. R. Champness, M. W. George, P. Hubberstey, R. Mokaya and M. Schröder, J. Am. Chem. Soc., 2006, 128, 10745-10753.
20. T. H. Kim and S. G. Kim, Safety Health Work, 2011, 2, 97-104.
21. D.-B. Shieh, C.-C. Chen, T.-S. Shih, H.-M. Tai, Y.-H. Wei and H.-Y. Chang, Chem-Bio. Interactions, 2007, 165, 211-219.
22. S. H. Jhung, J.-H. Lee, P. M. Forster, G. Férey, A. K. Cheetham and J.-S. Chang, Chemistry - Eur. J., 2006, 12, 7899-7905.
23. J. Klinowski, F. A. Almeida Paz, P. Silva and J. Rocha, Dalton, 2011, 40, 321-330.
24. J. Rocha, L. D. Carlos, F. A. A. Paz and D. Ananias, Chem. Soc. Rev., 2011, 40, 926-940.
25. S. L. James, C. J. Adams, C. Bolm, D. Braga, P. Collier, T. Friscic, F. Grepioni, K. D. M. Harris, G. Hyett, W. Jones, A. Krebs, J. Mack, L. Maini, A. G. Orpen, I. P. Parkin, W. C. Shearouse, J. W. Steed and D. C. Waddell, Chem. Soc. Rev., 2012, 41, 413-447.
26. T. N. Glasnov and C. O. Kappe, Macromolecular Rapid Commun., 2007, 28, 395-410.
27. M. Damm, T. N. Glasnov and C. O. Kappe, Org. Proc. Res. & Dev., 2009, 14, 215-224.
28. R. Ameloot, F. Vermoortele, W. Vanhove, M. B. J. Roeffaers, B. F. Sels and D. E. De Vos, Nature Chem., 2011, 3, 382-387.
29. M. Gimeno-Fabra, A. S. Munn, L. A. Stevens, T. C. Drage, D. M. Grant, R. J. Kashtiban, J. Sloan, E. Lester and R. I. Walton, ChemComm., 2012, 48, 10642-10644.
30. K.-J. Kim, Y. J. Li, P. B. Kreider, C.-H. Chang, N. Wannenmacher, P. K. Thallapally and H.-G. Ahn, ChemComm., 2013, 49, 11518-11520.
31. R. Lee, J. Kim and W.-S. Ahn, Korean J. Chem. Eng., 2013, 30, 1667-1680. 32. G. Férey, M. Latroche, C. Serre, F. Millange, T. Loiseau and A.
Percheron-Guegan, ChemComm., 2003, 2976-2977.
33. V. Finsy, L. Ma, L. Alaerts, D. E. De Vos, G. V. Baron and J. F. M. Denayer, Microporous and Mesoporous Mat., 2009, 120, 221-227.
10 35. E. Haque, N. A. Khan, J. E. Lee and S. H. Jhung, Chemistry – Eur. J., 2009, 15,
11730-11736.
36. P. Rallapalli, D. Patil, K. Prasanth, R. Somani, R. Jasra and H. Bajaj, J. Porous Mat., 2010, 17, 523-528.
37. Y. Liu, J.-H. Her, A. Dailly, A. J. Ramirez-Cuesta, D. A. Neumann and C. M. Brown, J. Am. Chem. Soc., 2008, 130, 11813-11818.
38. M. Vougo-Zanda, J. Huang, E. Anokhina, X. Wang and A. J. Jacobson, Inorg. Chem., 2008, 47, 11535-11542.
39. B. Panella, K. Hönes, U. Müller, N. Trukhan, M. Schubert, H. Pütter and M. Hirscher, Angew. Chem. Int. Ed., 2008, 47, 2138-2142.
40. Basolite® A100 produced by BASF | Sigma-Aldrich,
http://www.sigmaaldrich.com/catalog/product/aldrich/688738?lang=en®ion=G B,
http://www.sigmaaldrich.com/catalog/product/aldrich/688738?lang=en®ion=U S,
http://www.sigmaaldrich.com/catalog/product/aldrich/688738?lang=de®ion=D E, Accessed 09/01/2014.
41. L. F. Wu, P. C. Chen, A. P. Huang and C. M. Lee, Bioresource Technol., 2012,
113, 14-18.
42. A. Bhatnagar and M. Sillanpää, Chem. Eng. J., 2011, 168, 493-504. 43. K.-J. Kim, Y. J. Li, P. B. Kreider, C.-H. Chang, N. Wannenmacher, P. K.
Thallapally and H.-G. Ahn, ChemComm., 2013, 49, 11518-11520. 44. M. Hartmann, S. Kunz, D. Himsl, O. Tangermann, S. Ernst, A. Wagener,
Langmuir , 2008, 24, 8634-8642.
45. J. B. Dunn and P. E. Savage, Green Chem. 2003, 5, 649-655.
46. E. Perez, J. Fraga-Dubreuil, E. Garcia-Verdugo, P. A. Hamley, W. B. Thomas, D. Housley, W. Partenheimer and M. Poliakoff, Green Chem., 2011, 13, 2389-2396. 47. E. Perez, J. Fraga-Dubreuil, E. Garcia-Verdugo, P. A. Hamley, M. L. Thomas, C.
Yan, W. B. Thomas, D. Housley, W. Partenheimer and M. Poliakoff, Green Chem., 2011, 13, 2397-2407.
48. N. Stock and S. Biswas, Chem. Rev., 2012, 112, 933-969.
49. A. U. Czaja, N. Trukhan and U. Müller, Chem. Soc. Rev., 2009, 38, 1284-1293. 50. U. Mueller, M. Schubert, F. Teich, H. Puetter, K. Schierle-Arndt and J. Pastre, J.
Mat. Chem., 2006, 16, 626-636.
11
Figure and Legends
Scheme 1 Reaction scheme for batch reaction and continuous flow processes for the
synthesis of MIL-53(Al).
Figure 1 Schematic of the continuous process rig. The grey section represents the heated
[image:11.595.192.362.337.641.2]12
Figure 2 Diagram of extraction rig comprising of a pump, two batch reactors in series (1st
heated, 2nd cooled) and a back pressure regulator. Arrows indicate the flow direction; red and blue highlight heated and cold areas, respectively.
Figure 3 (a) PXRD patterns of as-synthesised MIL-53(Al) produced in batch (black) and
[image:12.595.176.424.337.681.2]13
Figure 4 TGA of as-synthesised MIL-53(Al) material prepared by batch reaction (250 °C) at
a heating rate of 5 °C min-1.The first step of 38.5% between 215 °C and 440°C is the loss of in-pore H2L1 and the second step of 39.2% between 500 °C to 690 °C is loss of coordinated ligand and decomposition of the material.
Figure 5 Comparison of N2 isotherms at 77K for activated MIL-53(Al) prepared by batch
[image:13.595.175.423.88.260.2](black) and continuous flow (red).
Table 1 Summary of surface areas and N2 uptake at 77K for MIL-53(Al) produced by
continuous flow at temperatures between 225 and 300 °C. Synthesis
temperature (°C)
BET surface area (m2 g-1)
Uptake at p/p0 =
0.95 (cm3 g-1)
225 459 223.5
250 919 296.4
275 804 258.7
[image:13.595.176.424.351.524.2]14
Figure 6 Photograph of the barrel containing a suspension of MIL-53(Al) formed by
continuous flow in our scaled-up reaction (centre), together with a commercial sample (bottom left) and dried MIL-53(Al) from the barrel (bottom right). A fifty pence piece is shown for scale (bottom centre).
Figure 7 Photograph of a commercial sample of MIL-53(Al) (left), and our scaled-up
[image:14.595.74.253.86.337.2] [image:14.595.74.326.460.563.2]15
Figure 7 Comparison of PXRD for as-synthesised HKUST-1 material produced by
[image:15.595.176.423.72.244.2]16
Table of Contents Graphic
17
Supplementary Information
Experimental Details
[image:17.595.176.422.176.343.2]A typical profile for P and T vs time for batch reactions is shown in Figure S1.
Figure S1 Plot of reactor internal temperature (black) and pressure (blue) against time for a
typical batch reaction for 10 min at 250 °C to form MIL-53(Al). Red dotted line shows target reaction temperature.
Flow reactions: A back pressure regulator (BPR, Tescom, model no. 26-1762-24-043) was used in the flow systems (Figure 1). For the reactions carried out at 200 °C, 225 °C, 275 °C and 300°C the same conditions as at 250 °C were used except the reactor heater was set to these temperatures. All yields are based on the target phase [Al(OH)(L1)]n. The crude yield is quoted before removal of free H2L1 for the pores; the pure yield refers to the overall yield after removal of in-pore H2L1. The collection of samples at steady state also allows accurate determination of the yield, Y, using the equation:
tM F C
m Y
L L
where m is mass collected, t is time of collection, CL and FL are the molar concentration and flow rate of the ligand solution, respectively. M is the molecular weight for [Al(OH)(C6H4(CO2)2)].
18 ethanol flow rate of 0.5 ml min-1 and a back pressure of 100 bar. Figure 2 shows a schematic of this extraction rig.
Volumetric Gas Adsorption
N2 isotherms were carried out on a Quantachrome Autosorb-1 (model no. As1-GYTKXL11, software ver. 1.61). Samples were degassed overnight, MIL-53(Al) material at 125°C and HKUST-1 at 100°C. The BET pressure range for the batch sample was 7.0 10-3 to 2.9 10-3 P/P0 and for the continuous process sample 2.5 10-3 to 5.3 10-2 P/P0, consistent with criteria used by Snurr and co-workers.1,2
Gravimetric Gas adsorption
CO2 and CH4 adsorption experiments were carried out using a Hiden Isochema Intelligent Gravimetric Analyzer (model no. IGA-003 system) at the University of Nottingham under ultra-high vacuum in a clean system with a diaphragm and turbo pumping system. IGASwin system software v.1.03.143 (Hiden Isochema, 2004) was used to fit all isotherm data points. All changes in sample weight were corrected for buoyancy effects.
PXRD
X-ray powder diffraction patterns were collected on a Pananalytical X’Pert Pro diffractometer operating at 160 W (40 kV, 40 mA) CuKα (λ= 1.5406 Å). High resolution powder diffraction data were collected on Beamline I11 at Diamond Light Source using multi-analysing-crystal detectors (MACs) and an in situ gas cell system.3
TGA
Thermogravimetric analyses were performed on a Perkin Elmer Thermogravimetric analyzer Pyris 1 TGA (model no. R1R151 TGA, software Ver. 11.0.0.0449). A heating rate of 5 °C min-1 was used from room temperature up to 700 °C.
Infrared (ATR-FTIR)
19
MIL-53(Al)
The phase referred to as MIL-53(Al)op (CDS ref. code SABVUN) and MIL-53(Al)hy (CDS ref. code SABWAU) were first reported by Loiseau et al.4 The phase referred to as MIL-53(Al)ta (CDS ref. code SABVOH01) was reported by Vougo-Zanda et al,5 and the phase referred to as H2L1 (CDS ref. code TEPHTH) was first reported by Bailey and Brown,6 with the phase referred to as γ-AlO(OH) (ICSD collection code Collection Code 59609) reported by Bokhimi et al..7 The simulated PXRD patterns were generated using Mercury 3.1.8
Figure S2 PXRD pattern of the reaction product MIL-53(Al) prepared by batch reaction at
150 °C (black), 200 °C (red) and 250 °C (blue) and simulated pattern for H2L1 (green).
Figure S3 PXRD patterns for MIL-53(Al) produced in batch at 250 °C; as-synthesised
[image:19.595.175.423.256.427.2] [image:19.595.176.422.487.657.2]20
Figure S4 PXRD pattern of MIL-53(Al) after washing with scEtOH. The shift in peak
[image:20.595.175.424.72.244.2]positions and absence of peaks from 14-16° confirms that this phase does not match previously reported phases, consistent with the formation of MIL-53(Al).xEtOH. MIL-53(Al) was produced in batch at 250 °C, before being washed with scEtOH for 2h.
Figure S5 PXRD pattern of MIL-53(Al) prepared in batch (250 °C), activated with scEtOH,
[image:20.595.177.424.359.525.2]21
Figure S6 PXRD pattern of MIL-53(Al) prepared in continuousflow, treated with scEtOH,
degassed and then partially rehydrated upon exposure to air (black).The sample matches the phases MIL-53(Al)op (red) and MIL-53(Al)hy (blue), and a minor phase γ-AlO(OH)(green) is present.
[image:21.595.175.424.93.264.2]A Le Bail refinement was performed on PXRD data for the degassed sample of MIL-53(Al) produced in batch at 250 °C. The refinement confirms that the bulk material matches with the known phase MIL-53(Al)op.
Figure S7 Le Bail profile fitting of MIL-53(Al) after degassing showing peaks at 2θ = 0-40°
shown, r_wp = 9.06, r_p = 6.24, gof = 5.53, cell parameters: Imma, V = 1423.87(11), a = 6.63198(25), b = 16.75117(61), c = 12.81691(69). The material was produced in batch at 250 °C, treated with scEtOH, and degassed in situ.
2Th Degrees 40 39 38 37 36 35 34 33 32 31 30 29 28 27 26 25 24 23 22 21 20 19 18 17 16 15 14 13 12 11 10 9 8 7 6 5 4 3 2 C o u n ts 290,000 280,000 270,000 260,000 250,000 240,000 230,000 220,000 210,000 200,000 190,000 180,000 170,000 160,000 150,000 140,000 130,000 120,000 110,000 100,000 90,000 80,000 70,000 60,000 50,000 40,000 30,000 20,000 10,000 0 -10,000 -20,000 -30,000
[image:21.595.77.518.440.625.2]22
Figure S8 Le Bail profile fitting of PXRD data for MIL-53(Al) after degassing showing
higher angle peaks with 2θ = 13-39°.
FigureS9 High resolution PXRD pattern (λ = 0.827107 Å) of partially hydrated MIL-53(Al)
(black), degassed in situ (red) and CO2 loading at 1 bar (blue). The material was produced in batch at 250 °C before treatment with scEtOH and drying. The PXRD data confirm that MIL-53(Al) exhibits the expected flexibility on degassing and CO2 adsorption.
2Th Degrees 39 38 37 36 35 34 33 32 31 30 29 28 27 26 25 24 23 22 21 20 19 18 17 16 15 14 13 C o u n ts 9,500 9,000 8,500 8,000 7,500 7,000 6,500 6,000 5,500 5,000 4,500 4,000 3,500 3,000 2,500 2,000 1,500 1,000 500 0 -500 -1,000 -1,500 -2,000 -2,500 -3,000
[image:22.595.83.528.74.238.2] [image:22.595.176.423.352.525.2]23
Figure S10 Comparison of PXRD patterns for products isolated from continuous flow
reactions at 200 °C, 225 °C, 250 °C, 275 °C and 300 °C. PXRD patterns for MIL-53(Al)ta, MIL-53(Al)hy, H2L1 and AlO(OH) are shown for comparison.
[image:23.595.143.455.71.285.2]24
Figure S11 TGA of the as-synthesised batch sample [Al(OH)(L1) + 0.8H2L1]n (black) with
derivative plot (blue) showing the rate of change of % weight loss with temperature.
[image:24.595.174.424.72.243.2]TGA for the as-synthesised MIL-53(Al) from the continuous flow process has a step of 23.6% between 215 °C and 440 °C attributed to the loss of in-pore H2L1 and is divided into three steps (Figure S12). From this it has been calculated that the as-synthesised product contains 0.41 H2L1 equivalents. The step of 36.4% from 500 °C to 690 °C corresponds to loss of ligand and structure decomposition of the framework to aluminium oxide.
Figure S12 TGA under N2 of as-synthesised MIL-53(Al) produced using the continuous flow
[image:24.595.176.424.420.591.2]25
Figure S13 TGA under air of as-synthesised MIL-53(Al) produced using the continuous flow
process; the derivative plot (blue) shows the rate of change of % weight loss with temperature.
The TGA for MIL-53(Al) produced in batch at 250 °C after treatment with scEtOH has an initial weight loss of 6.0% between 15 °Cat 100 °C corresponding to loss of ethanol trapped in the pores (Figure S14). The TGA shows a weight loss of only 2.4% in the region of 215 °C to 475 °C, confirming that in-pore H2L1 has been removed. The second step of 63.6% between 500 °C and 700 °C is due to the decomposition of the material.
Figure S14 TGA of MIL-52(Al) produced in batch after treatment with scEtOH to remove
[image:25.595.175.424.433.607.2]26
Figure S15 ATR-FTIR of MIL-53(Al) synthesised using HTW at 250 °C via batch (red) and
continuous flow process (blue) and of H2L1 (black) for comparison.
Figure S16 ATR-FTIR of MIL-53(Al) produced in batch; the as-synthesised (red) and
[image:26.595.177.423.313.486.2]27
Figure S17 CO2 and CH4 isotherms at 10 °C for MIL-53(Al) produced in batch at 250 °C.
The higher uptake of CO2 indicates selectivity for CO2 over CH4.
Figure S18 N2 isotherms at 77 K for products of continuous flow reactions at 225 °C,
250 °C, 275 °C and 300 °C. Prior to gas adsorption scEtOH treatment was used to remove unreacted H2L1. Note that the yield of the reaction at 200 °C was too low to produce sufficient material for gas adsorption.
[image:27.595.176.423.314.469.2]28
Figure S19 N2 isotherm at 77K for our scaled-up sample of MIL-53(Al) and for a
commercial sample. Uncoordinated H2L1 was removed from the scale-up sample by heating at 330 °C for 3 days.
HKUST-1
The synthesis of [Cu3(L2)2]n, HKUST-1, was achieved using the same procedure as with MIL-53(Al) except EtOH was used in place of water. Since both trimesic acid (H3L2) and Cu(NO3)2 are soluble in EtOH the use of ligand salts was not required. Thus, treatment of Cu(NO3)2·3H2O (86.2 mg, 0.357 mmol) with H3L2 (50.0 mg, 0.238 mmol) in EtOH (5.0 ml) at 200 °C for 10 minutes afforded a material the PXRD of which matches that of HKUST-1
(Figure S16). No free H3L2 was recovered with the material and so a further purification step
[image:28.595.174.424.72.244.2]was not necessary. The material produced by continuous process had a surface area of 1554 m2 g-1, a maximum nitrogen uptake of 416.9 cm3 g-1 (0.95 P/P0), and a pore volume of 0.62 cm3 g-1. The space time yield of HKUST-1 in this process was 730 kg m-3 d-1.
Figure S20 N2 gas sorption isotherm of HKUST-1 prepared by continuous flow reaction in
[image:28.595.175.423.556.722.2]29 The TGA for as-synthesised HKUST-1 produced by continuous flow exhibits the expected thermal behaviour with three steps (Figure S21). The first of 11.4% between 20 and 70 °C is the result of loss of EtOH from the pores. The second step of 19.7% between 70 °C and 220 °C is attributed to the loss of coordinated solvents with a total solvent loss of 31.1%. The third step of 30.7% between 295 °C and 450 °C corresponds to decomposition of the material.
Figure S21 TGA of as-synthesised HKUST-1 prepared by continuous flow (black); the first
derivative plot (blue) shows the rate of change of % weight loss with temperature.
Figure S22 ATR-FTIR of as-synthesised of HKUST-1 via batch (red) and continuous flow
process (blue) using EtOH at 200 oC, and of trimesic acid H3L2 (black).
References
1. K. S. Walton and R. Q. Snurr, J. Am. Chem. Soc., 2007, 129, 8552-8556.
30
3. S. P. Thompson, J. E. Parker, J. Potter, T. P. Hill, A. Birt, T. M. Cobb, F. Yuan and C. C.
Tang, Review of Scientific Instruments, 2009, 80, 075107.
4. T. Loiseau, C. Serre, C. Huguenard, G. Fink, F. Taulelle, M. Henry, T. Bataille and G. Férey,
Chemistry – Eur. J., 2004, 10, 1373-1382.
5. M. Bailey and C. J. Brown, Acta Cryst., 1967, 22, 387-391.
6. M. Vougo-Zanda, J. Huang, E. Anokhina, X. Wang and A. J. Jacobson, Inorg. Chem., 2008,
47, 11535-11542.
7. X. Bokhimi, J. Sánchez-Valente and F. Pedraza, J. Solid State Chem., 2002, 166, 182-190.
8. C. F. Macrae, I. J. Bruno, J. A. Chisholm, P. R. Edgington, P. McCabe, E. Pidcock, L.
Rodriguez-Monge, R. Taylor, J. van de Streek and P. A. Wood, J. App. Cryst., 2008, 41,
466-470.
9. S. S.-Y. Chui, S. M.-F. Lo, J. P. H. Charmant, A. G. Orpen and I. D. Williams, Science, 1999,
283, 1148-1150.
10. R. Ameloot, F. Vermoortele, W. Vanhove, M. B. J. Roeffaers, B. F. Sels and D. E. De Vos,
Nature Chem., 2011, 3, 382-387.
11. M. Gimeno-Fabra, A. S. Munn, L. A. Stevens, T. C. Drage, D. M. Grant, R. J. Kashtiban, J.
Sloan, E. Lester and R. I. Walton, ChemComm., 2012, 48, 10642-10644.
12. K.-J. Kim, Y. J. Li, P. B. Kreider, C.-H. Chang, N. Wannenmacher, P. K. Thallapally and
H.-G. Ahn, ChemComm., 2013, 49, 11518-11520.
13. M. Hartmann, S. Kunz, D. Himsl, O. Tangermann, S. Ernst and A. Wagener, Langmuir, 2008,