C
2014. The American Astronomical Society. All rights reserved. Printed in the U.S.A.
DISTRIBUTION OF ELECTRIC CURRENTS IN SOLAR ACTIVE REGIONS
T. T ¨or ¨ok1, J. E. Leake2, V. S. Titov1, V. Archontis3, Z. Miki´c1, M. G. Linton4, K. Dalmasse5, G. Aulanier5, and B. Kliem6
1Predictive Science, Inc., 9990 Mesa Rim Road, Suite 170, San Diego, CA 92121, USA 2College of Science, George Mason University, 4400 University Drive, Fairfax, VA 22030, USA 3School of Mathematics and Statistics, University of St. Andrews, North Haugh, St. Andrews, Fife KY16 9SS, UK
4U.S. Naval Research Lab, 4555 Overlook Avenue, SW Washington, DC 20375, USA
5LESIA, Observatoire de Paris, CNRS, UPMC, Univ. Paris Diderot, 5 place Jules Janssen, F-92190 Meudon, France 6Institut f¨ur Physik und Astronomie, Universit¨at Potsdam, Karl-Liebknecht-Str. 24-25, D-14476 Potsdam, Germany
Received 2013 September 26; accepted 2014 January 14; published 2014 January 27
ABSTRACT
There has been a long-standing debate on the question of whether or not electric currents in solar active regions are neutralized. That is, whether or not the main (or direct) coronal currents connecting the active region polarities are surrounded by shielding (or return) currents of equal total value and opposite direction. Both theory and observations are not yet fully conclusive regarding this question, and numerical simulations have, surprisingly, barely been used to address it. Here we quantify the evolution of electric currents during the formation of a bipolar active region by considering a three-dimensional magnetohydrodynamic simulation of the emergence of a sub-photospheric, current-neutralized magnetic flux rope into the solar atmosphere. We find that a strong deviation from current neutralization develops simultaneously with the onset of significant flux emergence into the corona, accompanied by the development of substantial magnetic shear along the active region’s polarity inversion line. After the region has formed and flux emergence has ceased, the strong magnetic fields in the region’s center are connected solely by direct currents, and the total direct current is several times larger than the total return current. These results suggest that active regions, the main sources of coronal mass ejections and flares, are born with substantial net currents, in agreement with recent observations. Furthermore, they support eruption models that employ pre-eruption magnetic fields containing such currents.
Key words: magnetohydrodynamics (MHD) – Sun: corona – Sun: coronal mass ejections (CMEs)
Online-only material:color figures
1. INTRODUCTION
The energy required to power solar flares and coronal mass ejections (CMEs) is stored in current-carrying magnetic fields in the corona. Active regions (ARs), the main source regions of eruptions, carry a total electric current of ∼1 TA (e.g., Wilkinson et al. 1992), which is commonly inferred from applying Amp`ere’s law, j = (∇ ×B)/μ0, to photospheric vector magnetograms. Since such data are hampered by limited resolution and various uncertainties (e.g., Wiegelmann et al.
2006), it is not yet well understood how AR currents are distributed.
The observations indicate that the currents in magnetically well-isolated ARs arebalancedto a very good approximation, i.e., the total current, I, calculated by integrating the vertical current density,jz, over thewholephotospheric AR extension
vanishes, as expected from∇ ·j = 0 (e.g., Georgoulis et al.
2012). What remains controversial is to what extent the currents are neutralized, meaning that I calculated over a single AR polarity vanishes as well. Full neutralization requires the main (or direct) currents, which connect the AR polarities, to be surrounded by shielding (or return) currents of equal total strength and opposite direction (see, e.g., Figure 1 in Melrose
1995). Both observations and theoretical considerations are not yet fully conclusive regarding the existence or amount of return currents in ARs, which has led to an ongoing debate (e.g., Parker
1996; Melrose1996; Georgoulis et al.2012).
AR currents are believed to be formed by two main mecha-nisms: (1) the stressing of the coronal magnetic field by photo-spheric and sub-surface flows (e.g., Klimchuk & Sturrock1992)
and (2) the emergence of current-carrying flux from the solar interior into the corona (e.g., Leka et al.1996). At first glance, mechanism (1) is expected to produce neutralized currents. To illustrate this, we show in Figures1(a) and (b) a simple AR model created from a bipolar potential field by photospheric vortex flows (Amari et al.1996; T¨or¨ok & Kliem2003; Aulanier et al. 2005; T¨or¨ok et al. 2013). Such an isolated, symmetric system must be current-balanced. To see if it is also neutralized, we calculateI =CB·dlinoneAR polarity along a photo-spheric pathCthat runs fully outside and sufficiently far from the vortex flows. Since the horizontal field components alongC
do not change much during the twisting (Figure1(b)) and the initial field is current-free,Iremains close to zero at all times, i.e., the generated currents remain nearly neutralized. However, as shown by T¨or¨ok & Kliem (2003), net currents develop in the system if the vortices are close enough to each other to also shear the magnetic field at the polarity inversion line (PIL). The resulting handedness is the same as in the core of the flux rope, i.e., the sheared flux carries direct current. Some recent observations, based on high-resolution vector magnetograms, indeed suggest the presence of substantial net currents in ARs with strong shear along their main PIL (Ravindra et al.2011; Georgoulis et al.2012).
As for mechanism (2), it is believed that flux ropes rising through the convection zone are magnetically well-isolated (Fan
(a)
(c)
[image:2.612.118.494.56.349.2](b)
Figure 1.Electric currents in two numerical models of AR formation. (a) Bipolar AR containing a flux rope (red field lines) created by photospheric vortex flows (green arrows). Black (white) colors outline negative (positive) vertical magnetic fields. Currents are visualized by transparent iso-surfaces ofα=(j·B)/B2, with
α= −2 (blue; direct current) and 0.65 (orange; return current). Black arrows show horizontal field components. The yellow line is an example path for calculating the total current in one polarity (see text). (b) Zoom into AR center, showing additionally the initial horizontal potential field (magenta arrows) and the polarity inversion line (white dotted line). (c) Buoyant flux rope from the simulation investigated in this Letter, before it emerges through the photosphere. Red (blue) colors outline direct (return) currents; field lines show the flux rope core.
(A color version of this figure is available in the online journal.)
be associated with the development of strong net currents and strong shear at the PIL. Longcope & Welsch (2000) suggested, based on a simplified analytical model, that return currents may even completely remain below the corona during the emergence of magnetically isolated flux tubes.
Improving our understanding of the current distribution in ARs is particularly important for theoretical and numerical mod-els of solar eruptions. Many CME simulations (e.g., Roussev et al.2003; T¨or¨ok & Kliem2005; Manchester et al.2008; Lugaz et al.2011; T¨or¨ok et al.2011) employed the analytical coronal flux rope configuration developed by Titov & D´emoulin (1999), which does not contain return currents. Other investigations used coronal field models constructed through flux rope insertion and numerical relaxation (van Ballegooijen2004), which are simi-larly dominated by direct currents, to represent the source-region field prior to an eruption (e.g., Bobra et al.2008; Savcheva et al.
2012). Based on the assumption that AR currents are neutral-ized, it has been argued, however, that such configurations are not suitable for CME modeling, as the inclusion of return cur-rents may inhibit their eruption (see a summary in Forbes2010). Since theory and observations are not yet conclusive, MHD simulations can be used as a viable tool to address the ques-tion of current neutralizaques-tion in ARs. Surprisingly, while the development of return currents has been reported in simulations where ARs were produced by photospheric flows (e.g., Aulanier et al.2005; Delann´ee et al.2008), theamountof current neu-tralization was quantified in such simulations only by T¨or¨ok & Kliem (2003). To the best of our knowledge, this has not yet
been done for ARs produced in flux emergence simulations, which is the purpose of this Letter.
2. NUMERICAL SETUP
The simulation analyzed here is identical to the run “SD” in Leake et al. (2013; hereafter L13), except for a shift in thez
Figure 2.Perspective view on magnetic field lines of the emerging flux rope (random colors) and the ambient coronal dipole field (yellow; drawn forz >30) at
t=170. The “magnetogram”Bz(x, y, z=30) is shown in grayscale. (A color version of this figure is available in the online journal.)
3. RESULTS
The subsequent evolution is very similar to previous flux emergence simulations (seeL13). Here we only show the mag-netic configuration at the time when there is no longer significant flux emergence into the atmosphere and a bipolar AR containing a stable flux rope has formed in the corona (Figure2). The erup-tion of the rope, observed in previous simulaerup-tions (Manchester et al.2004; Archontis & T¨or¨ok2008), is inhibited here by the stabilizing dipole field, the orientation of which was chosen to minimize magnetic reconnection with the emerging flux. Fig-ure3shows that the strongest AR currents are located above the PIL and exhibit a sigmoidal shape when viewed from above. Return currents are present but are rather narrow and located at the AR edges, while the AR center and the flux rope con-tain only direct currents. Note that the quantity α represents the direct and return currents reasonably well, since the coronal configuration evolves toward a force-free state as the emer-gence of flux into the atmosphere slows down (see Figure 13 inL13).
In order to quantify the AR currents, we calculate I =
jzdx dyat the top of the PCL (z=30). Integration over the
whole AR shows that the total current is balanced at all times, as expected. To check the amount of current neutralization, we restrict the integration to the positive AR polarity,Bz(z =
30)> 0. The emerging flux rope has a right-handed twist, so the total direct (return) current,Id(Ir), is obtained by integrating
jz(z=30)>0 (<0) over this polarity.
Figure4(a) shows the evolution ofId,Ir,I = Id+Ir (blue
symbols), and the total positive magnetic flux (black curve). The initial flux is non-zero due to the presence of the background dipole field. Early in the evolution (t 50) there is very little flux emergence and the currents remain small and almost perfectly neutralized. No significant shear develops along the PIL during this phase. Strong emergence starts at t ≈ 50,
accompanied by a rapid increase of the currents, and ceases at t ≈ 160. Ir saturates at t ≈ 100, while Id increases until
t ≈130 and slowly decreases afterward.
Figure4(b) shows the ratio|Id/Ir|(red diamonds). The total
direct current starts to exceed the total return current from the onset of strong emergence and remains several times larger during the whole evolution. The same pattern can be found ifId
andIrare computed deeper in the PCL (atz=22 and 26), with
somewhat smaller values of|Id/Ir|.
The red symbols in Figure 4(a) show Id, Ir, and I in the
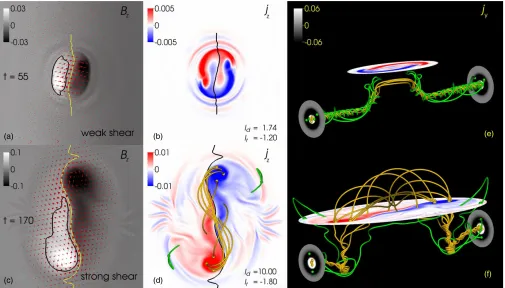
center of the positive polarity, where the strongest magnetic fields are located. The integration area was defined by the ad-hoc conditionBz(z=30, t)> Bzmax(z=30, t)/3 (see the black contour lines in Figures5(a) and (c)). It can be seen thatIr in
the AR center drops to zero shortly after the onset of strong emergence, i.e., the strongest AR fields become connected solely by direct currents as the emergence proceeds. This is visualized in Figures5(a)–(d). Att =55, right after the onset of strong emergence, the direct and return currents are still quite compact and more or less equally distributed within each polarity of the forming AR. No significant shear along the PIL has yet developed. The PILs ofBz and jz are very different,
indicating that the system is far from a force-free state at this height and time. As the emergence proceeds the picture changes considerably. Att=170, when flux emergence has ceased and strong shear along the PIL has developed, twoJ-shaped regions of strong direct current occupy the AR center, while the much weaker and narrower return currents are located solely in the AR’s periphery. The PILs ofBz andjzin the AR center now
coincide, indicating that the coronal configuration has evolved to an approximately force-free state. This pattern persists during the remaining evolution of the system, except that as the AR polarity centers separate, the current concentrations between them progressively narrow, plausibly causing the decrease ofId
(a)
[image:4.612.60.278.55.492.2](b)
Figure 3.(a) Top view of the system shown in Figure2(without arcade field lines). Direct (return) currents are visualized by a blue (orange) transparent iso-surface ofα=0.12 (−0.08). Note that the flux rope is right-handed (α >0), while the flux rope in Figure1(a) is left-handed (α <0). (b) Perspective view along the rope axis, showing field lines of (Bx,0, Bz) and color-scales ofα(for
z >30) andjy(forz <30) in the plane{y=0}(jyis used to visualize the
current direction forz <30 since the field is far from a force-free state there). (A color version of this figure is available in the online journal.)
4. DISCUSSION
We quantified the amount of electric current neutralization in bipolar solar ARs by considering an MHD simulation of the emergence of a current-neutralized magnetic flux rope from the solar interior into the corona. We find that a rapid and strong deviation from current-neutralization occurs simultaneously with the onset of significant flux emergence. The emergence process is accompanied by the development of strong magnetic shear along the AR’s PIL. By the end of the emergence phase |Id| is several times larger than |Ir| for the model
parameters considered here, in reasonable agreement with the ratios obtained from observed data by Ravindra et al. (2011) and Georgoulis et al. (2012). The strong magnetic fields in the AR center are connected solely by direct currents, while
the weaker and narrower return currents reside in the AR’s periphery. In order to assess the role of shielding on the strength of the return currents, we repeated the simulation using a three times stronger dipole field, and also compared it with emergence into a field-free corona (run “ND” inL13). The deviation from current neutralization is strong in all cases and increases with the ambient field strength, opposite to expectation if shielding were dominant. These results suggests that:
1. ARs are born with substantial net currents, in agreement with recent observations (Ravindra et al.2011; Georgoulis et al.2012).
2. Coronal flux rope models that neglect return currents (e.g., Titov & D´emoulin1999; Su et al.2011) are a valid rep-resentation of pre-eruption configurations on the Sun. In-deed, simulations that use such models reproduce important eruption characteristics (e.g., rise profiles and morphologi-cal evolution) in very good quantitative agreement with the observations (e.g., T¨or¨ok & Kliem2005; Williams et al.
2005; Schrijver et al.2008; Kliem et al.2010,2012,2013). The question arises of how fully neutralized sub-photospheric currents transform into strongly non-neutralized coronal cur-rents during flux emergence. This transformation is not trivial, since (1) the current paths become highly complex during the rise and emergence of the flux rope, (2) only a fraction of the sub-photospheric currents enter the corona, and (3) new currents may develop as a result of the shearing and converging flows associated with emerging flux ropes (Manchester et al. 2004; Archontis2008) or of the transport of twist from below the sur-face via torsional Alfv´en waves (Longcope & Welsch2000; Fan
2009b;L13).
The complexity of the problem calls for a detailed investi-gation beyond the scope of this Letter. A preliminary analysis indicates that during the flux pile-up that occurs when the rising flux rope approaches the photosphere, return currents located at the top of the rope are pushed aside by subjacent direct cur-rents. Moreover, some of them short-circuit with adjacent direct currents (Figure5(e)), which supports this process. It appears that most of the return currents thus relocated to the periphery of the emergence area never enter the corona (otherwise the flux emergence would start with an increase of the return cur-rent). Figure5(f) shows that the direct currents that occupy the AR center after emergence are rooted in the center of the sub-photospheric flux rope. This suggests that they emerge bodily, rather than being produced by shearing flows.
It also needs to be studied how parameters such as the initial flux rope twist and diameter (relative to the PCL width), and the structure and strength of the pre-existing coronal field affect the final current distribution.
The results presented here refer to newly emerging flux, in particular to emerging ARs. While the most powerful eruptions tend to arise from relatively young and compact ARs, many filament eruptions and CMEs originate within or between decaying ARs characterized by dispersed photospheric flux distributions (Martin 1973; Tang 1987). The corresponding pre-eruption configurations (typically filament channels) are believed to be formed and energized primarily by persistent shear flows and flux cancellation at PILs (e.g., van Ballegooijen & Martens1989; Martens & Zwaan2001; Green & Kliem2009; Green et al.2011), rather than by newly emerging flux. Their magnetic structure has been modeled using two complementary approaches.
(a) (b)
Figure 4.Electric currents integrated over the positive polarity region,Bz(z)>0. (a) Integration atz =30 over the whole polarity (blue symbols) and over the polarity center (Bz> Bzmax/3; red symbols). The total positive magnetic flux is shown by a black line (scaled to fit into the plot). (b) Ratio of total direct and total return current integrated over the whole positive polarity at heightsz=22, 26, and 30 (black, blue, and red diamonds, respectively). The total positive magnetic flux at these heights is shown by solid lines of the same color, scaled to the same initial value.
(A color version of this figure is available in the online journal.)
(a) (b) (e)
(f)
(c) (d)
Figure 5.Development of net currents in the corona. The top shows an early state of emergence, when little shear has developed and the currents are relatively well neutralized. The bottom shows a mature state of emergence, after strong shear has developed and the currents are strongly non-neutralized. (a–d)Bzandjzatz=30. On the left, red arrows, yellow and black lines outline (Bx, By,0),Bz=0, and contours ofBzmax/3, respectively. On the right,Bz=0 is drawn in black. The current field lines in (d) are the same as in (f). (e–f) Oblique view showingjz(z=30), field lines ofj, and vertical slices ofjyaty= ±75, with white (black) regions outlining
the locations of sub-photospheric direct (return) currents. Current field lines start aty= ±75 in (e) and atz=30 in (f), and are terminated aty= ±75 in both panels. Orange (green) lines start in regions of direct (return) current. Green current field lines in (e) have short-circuited, i.e., they connect to the direct current region in the same flux rope leg.
[image:5.612.55.560.382.670.2]extrapolation of an observed magnetogram and subsequently relaxing the coronal field numerically (e.g., Bobra et al.2008; Savcheva & van Ballegooijen 2009; Su et al. 2011). After relaxation, the currents in these models tend to be strongly non-neutralized (see Figure 3 in Kliem et al.2013). In particular, the use of a potential ambient field neglects the possible introduction of return currents by localized shearing flows. Nevertheless, the models have been very successful in representing stable as well as unstable fields of dispersed and decaying ARs.
MHD simulations involving flux cancellation have produced fully dynamic models of such ARs (e.g., Linker et al.2003; Amari et al. 2003; Titov et al. 2008; Aulanier et al. 2010). These simulations impose various combinations of photospheric shearing, converging flows, and field diffusion on an initial potential field; thus, possible return currents resulting from the shearing are kept. Figure 12 in Titov et al. (2008) and Figure 7 in Aulanier et al. (2010) show that return currents are produced in these models, but they appear to be too weak to neutralize the strong direct currents that form above the PIL. For example, the simulation in Titov et al. (2008) yields|Id/Ir| ≈ 3, rather
similar to the values shown in Figure4.
All three models (flux emergence, flux rope insertion, and flux cancellation) appear to produce strongly non-neutralized cur-rent configurations, though their quantitative differences have yet to be investigated systematically. The same is true for con-figurations produced by localized vortex flows (Figure1(a)) if these flows extend close to the PIL. Moreover, these config-urations are morphologically similar, typically consisting of a low-lying, sigmoidal layer of strong and concentrated currents and a flux rope with weaker and more diffuse current above it (T¨or¨ok & Kliem2003; Archontis & Hood2009; Aulanier et al.
2010; Savcheva et al.2012). This suggests that young eruptive ARs and mature CME source regions have analogous current distributions, dominated by net currents located close to the PIL, though this conjecture needs to be substantiated by further analysis of numerical models and observations.
Finally, all models show an association between the presence of net currents and magnetic shear along the PIL, regardless of whether the currents are produced by horizontal photospheric flows or emerge bodily into the corona. While the shear at the PIL is causal for the current to be non-neutralized in the vortex-driven case, it may not be causal in the emergence process. The exact nature and validity range of the relationship requires further study as well.
We thank the referee for helpful comments and Brian Welsch for stimulating discussions. The contributions of T.T., V.S.T., and Z.M. were supported by NASA’s HTP, LWS, and SR&T programs. J.E.L and M.G.L. were supported by NASA/LWS. M.G.L. received support also from the ONR 6.1 program. The simulation was performed under grant of computer time from
the D.o.D. HPC Program. B.K. was supported by the DFG. V.A. acknowledges support through the IEF-272549 grant.
REFERENCES
Amari, T., Luciani, J. F., Aly, J. J., Mikic, Z., & Linker, J. 2003,ApJ,595, 1231 Amari, T., Luciani, J. F., Aly, J. J., & Tagger, M. 1996,ApJL,466, L39 Archontis, V. 2008,JGRA, 113, 3
Archontis, V., & Hood, A. W. 2009,A&A,508, 1469 Archontis, V., & T¨or¨ok, T. 2008,A&A,492, L35
Aulanier, G., D´emoulin, P., & Grappin, R. 2005,A&A,430, 1067 Aulanier, G., T¨or¨ok, T., D´emoulin, P., & DeLuca, E. E. 2010,ApJ,708, 314 Bobra, M. G., van Ballegooijen, A. A., & DeLuca, E. E. 2008,ApJ,672, 1209 Delann´ee, C., T¨or¨ok, T., Aulanier, G., & Hochedez, J.-F. 2008, SoPh,247, 123 Fan, Y. 2001,ApJL,554, L111
Fan, Y. 2009a, LRSP,6, 4 Fan, Y. 2009b,ApJ,697, 1529
Forbes, T. 2010, in Heliophysics: Space Storms and Radiation: Causes and Effects, ed. C. J. Schrijver & G. L. Siscoe (Cambridge: Cambridge Univ. Press), 159
Georgoulis, M. K., Titov, V. S., & Miki´c, Z. 2012,ApJ,761, 61 Green, L. M., & Kliem, B. 2009,ApJL,700, L83
Green, L. M., Kliem, B., & Wallace, A. J. 2011,A&A,526, A2 Kliem, B., Linton, M. G., T¨or¨ok, T., & Karlick´y, M. 2010, SoPh,266, 91 Kliem, B., Su, Y., van Ballegooijen, A., & DeLuca, E. 2013,ApJ,779, 129 Kliem, B., T¨or¨ok, T., & Thompson, W. T. 2012, SoPh,281, 137
Klimchuk, J. A., & Sturrock, P. A. 1992,ApJ,385, 344 Leake, J. E., Linton, M. G., & T¨or¨ok, T. 2013,ApJ,788, 99
Leka, K. D., Canfield, R. C., McClymont, A. N., & van Driel-Gesztelyi, L. 1996,ApJ,462, 547
Linker, J. A., Miki´c, Z., Lionello, R., et al. 2003,PhPl,10, 1971 Longcope, D. W., & Welsch, B. T. 2000,ApJ,545, 1089 Lugaz, N., Downs, C., Shibata, K., et al. 2011,ApJ,738, 127
Manchester, W., IV, Gombosi, T., DeZeeuw, D., & Fan, Y. 2004,ApJ,610, 588 Manchester, W. B., IV, Vourlidas, A., T´oth, G., et al. 2008,ApJ,684, 1448 Martens, P. C., & Zwaan, C. 2001,ApJ,558, 872
Martin, S. F. 1973, SoPh,31, 3 Melrose, D. B. 1995,ApJ,451, 391 Melrose, D. B. 1996,ApJ,471, 497 Parker, E. N. 1996,ApJ,471, 489
Ravindra, B., Venkatakrishnan, P., Tiwari, S. K., & Bhattacharyya, R. 2011,ApJ, 740, 19
Roussev, I. I., Forbes, T. G., Gombosi, T. I., et al. 2003,ApJL,588, L45 Savcheva, A., & van Ballegooijen, A. 2009,ApJ,703, 1766
Savcheva, A. S., van Ballegooijen, A. A., & DeLuca, E. E. 2012,ApJ,744, 78 Schrijver, C. J., Elmore, C., Kliem, B., T¨or¨ok, T., & Title, A. M. 2008,ApJ,
674, 586
Su, Y., Surges, V., van Ballegooijen, A., DeLuca, E., & Golub, L. 2011,ApJ, 734, 53
Tang, F. 1987, SoPh,107, 233
Titov, V. S., & D´emoulin, P. 1999, A&A,351, 707
Titov, V. S., Mikic, Z., Linker, J. A., & Lionello, R. 2008,ApJ,675, 1614 T¨or¨ok, T., & Kliem, B. 2003,A&A, 406, 1043
T¨or¨ok, T., & Kliem, B. 2005,ApJL, 630, L97
T¨or¨ok, T., Panasenco, O., Titov, V. S., et al. 2011,ApJL,739, L63 T¨or¨ok, T., Temmer, M., Valori, G., et al. 2013, SoPh,286, 453 van Ballegooijen, A. A. 2004,ApJ,612, 519
van Ballegooijen, A. A., & Martens, P. C. H. 1989,ApJ,343, 971 Wiegelmann, T., Inhester, B., & Sakurai, T. 2006, SoPh,233, 215 Wilkinson, L. K., Emslie, A. G., & Gary, G. A. 1992,ApJL,392, L39 Williams, D. R., T¨or¨ok, T., D´emoulin, P., van Driel-Gesztelyi, L., & Kliem, B.