Journal of Environmental Protection, 2010, 1, 136-142
doi:10.4236/jep.2010.12018 Published Online June 2010 (http://www.SciRP.org/journal/jep) 1
Analysis of Groundwater for Potability from Tiruchirappalli
City Using Backpropagation ANN Model and GIS
Natarajan Venkat Kumar*, Samson Mathew, Ganapathiram Swaminathan
Civil Engineering Department, National Institute of Technology, Tiruchirappalli, India. Email: Venkatkumar.nit@gmail.com
Received February 28th, 2010; revised April 9th, 2010; accepted April 11th, 2010.
ABSTRACT
Monitoring groundwater quality by cost-effective techniques is important as the aquifers are vulnerable to contamina-tion due to point sources and non point sources. This paper presents Artificial neural Network (ANN) Models that might be used to predict water parameters from a few known parameters. The sample data from 112 hand pumps and hand operated tube well water samples used for drinking purposes by the local population was used. The ANN model features a back propagation algorithm and neuron members were determined for optimization of the model architecture by trial and error method. The model simulations show that the optimum network of 4-50-50-6 has mean error of –0.023% on complete data was utilized. This demonstrated that the developed model has high accuracy for predicting. Thus it has been established that the two hidden layers neural network has more efficiency than asymptotic regression in the pre-sent. This model can be used for analysis and prediction of subsurface water quality prediction.
Keywords:Groundwater Quality, ANN, Ec, TDS, Sulphates, pH, Tiruchirappalli
1. Introduction
Water Quality is the physical, Chemical and biological characteristics of water in relationship to a set of stan-dards. Water quality standards are created for different types of water bodies and water body locations as per desired uses. There are separate quality standards for portable water, agriculture needs, industrial needs and construction needs. The primary uses considered for such contact and for health of ecosystems. The methods of hygrometry are used to quantify water characteristics. Water quality depends on the local geology and ecosys-tem, as well as human uses such as sewage dispersion, industrial pollution, use of water bodies’ heat sink and overuse. References [1-3], which emphasized the work initiated from Hill’s general theory of uniqueness and bifurcation [4]. Environmental engineers and researchers have paid much attention to the behavior of water quality in portable operations over the last decade. It is difficult to define criteria for describing the stability in Water quality. In general, the contamination of groundwater could occur from non point and point sources. Among the major contaminants linked to non point sources are nitrates, heavy metals and pesticides. Heavy metals con-taminate groundwater from anthropogenic sources as well as natural sources. Some of the major anthropogenic sources of heavy metals are mining, fertilizers and pesti-cides and industrial wastes [5]. The high toxicity of
hu-man health is hu-manifested in the low maximum contami-nant levels (MCL). High concentrations of heavy metals occur due to a complex interaction between factors that include land use practices and hydro geochemical condi-tions prevailing in soils [6].
Groundwater monitoring is defined as testing of groundwater over a next ended time period in oder to document groundwater conditions, including the collec-tion of chemicals such as contaminant concentracollec-tions [7]. Only limited monitoring schemes considered the conse-quences of different concentrations and varying pumping flows among wells as a major factor. One of the most interesting aspects of hydrochemistry is the occurrence of water bodies with different water chemistries is very close proximity to each other. This has been variously attributed to the surface and subsurface geology [8]. Wa-ter quality assessment in Akpabuyo, south easWa-tern Nige-ria indicated waters are acidic, soft and characterized by low sodium absorption ratio, and waters are classified
into four chemical facies: Ca2+-Cl-1, Na+-Cl-1, CaSO
4-and
Ca-HCO3- [9]. Studies conducted on the chemical quality
of groundwater of Mangalore city in Karnataka state and madras in Tamilnadu, India revealed that the groundwa-ter quality has been degroundwa-terioted due to over exploitation of groundwater [10].
137 Analysis of Groundwater for Potability from Tiruchirappalli City Using Backpropagation Ann Model and GIS
of [5] which set the basics for the current study area. The chemical composition of water is an important factor to be considered before it is used for domestic or irrigation purpose [11]. This present study has been conducted to assess and evaluate the groundwater quality conditions for domestic purposes. In this paper an attempt has been made to evaluate the quality indices of groundwater to understand the hydro geochemical relationships of the water quality parameters for the suitability of groundwa-ter resources.
2. Study Area, Materials and Methods
2.1 Study Area
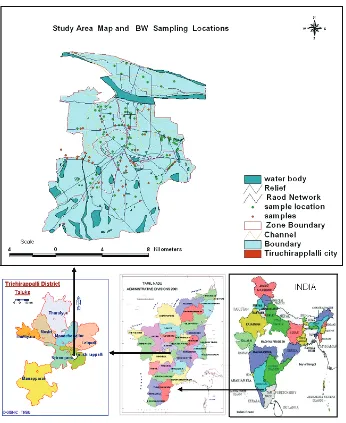
Tiruchirappalli City of Tamil Nadu, India is selected for the study. The general topology of Tiruchirappalli is flat
and lies at an altitude of 78 m above sea level. Tiruchi- rappalli is fed by the rivers Cauvery and Kollidam. There are reserve forests along the river Cauvery. Golden Rock and the Rock Fort are the prominent hills. The south-ern/south-western part of the district is dotted by several hills which are thought to be an offset of the Western Ghats Mountain range and the soil is considered to be
very fertile. Figure 1 shows the study area.
The following data that was collected from 112 from which seventy nine hand pumps and electrically operated tube well water samples used for drinking purposes by the local population of the Trichy town of Tiruchirappalli
district of Southern Tamil Nadu Shown in Figure 1. The
samples collected were during 2006 and 2008 on Pre monsoon and Post monsoon were used in our project for modeling and prediction purposes. The samples were
ana-Figure 1. Study area of Tiruchirappalli city
[image:2.595.127.473.273.696.2]Analysis of Groundwater for Potability from Tiruchirappalli City Using Backpropagation Ann Model and GIS
Copyright © 2010 SciRes. JEP
138
lyzed for the following physico chemical water quality parameters as per standard methods [1].
The Laboratory tests are conducted on these samples for 16 different physico-chemical water quality
parame-ters as per the standard procedure [1]. [2,12] criteriaare
adopted for testing these samples. The groundwater
hy-drochemistry records of the study area are used for the preparation of maps. These maps are obtained by geosta-tistical (Kriging) methodology and the results are pre-sented in the form of equal ion concentration lines [7,10, 13]. The MATLAB software was also used to analyze the data. The groundwater quality data are used as the hidden layer for the preparation of base maps. These features are the boundary lines between mapping units, other linear features (streets, rivers, roads, etc.) and point features (bore well points, etc.). The contours are developed for
pH, EC, Cl-, Na+, Ca2+, Mg2+, Total Hardness, Alkalinity,
F, SO4-, Coliform and NO3- values for the pre monsoon
and post monsoon values. The monitoring and sampling program was initiated in 2006 and finalized the year 2008. A total of seventy nine monitoring stations were estab-lished of them represented groundwater conditions.
2.2 Artificial Neural Networks (ANNs)
An artificial neural network was then developed using part of the experimental data for training and testing. Finally, the neural network model was applied to Collec-tion of available data about the various water quality pa-rameters of the groundwater sources in Tiruchirappalli town of Tiruchirappalli district in Tamil Nadu, India. The reserved part of the experimental data to perform the investigation of the occurrence of water quality constitu-ents and to examine the effectiveness and robustness of the neural net work model. The effect of Sulphates, TDS, Ec, Chlorides, pH, Creation of an ANN model for the prediction of Electrical Conductivity when Sulphates, Chlorides, Total Dissolved Solids and pH data are avail-able for studying wrinkling behavior in ANN model. The literature reveals that a very little effort is reported on the use of ANNs in water quality modeling.
Neural networks, as used in artificial intelligence, have traditionally been viewed as simplified models of neural processing in the human brain. It is accepted by most scientists that the human brain is a type of computer. The origins of neural networks are based on efforts to model information processing in biological systems, which may rely largely on parallel processing as well as implicit instructions based on recognition of patterns of “sensory” input from external sources [14].
2.2.1Back Propagation Network
The back propagation algorithm has made it possible to design multi-layer neural networks for numerous appli-cations, such as adaptive control, classification of sonar targets, stock market prediction and speech recognition
[14]. Also, BPNN has the advantage of fast response and high learning accuracy [14]. Hence an ANN with back propagation algorithm (BP) has been adopted here to model the potability behavior of subsurface water. One of the advantages of using the neural network approach is that a model can be constructed very easily based on the given input and output and trained to accurately predict process dynamics. This technique is especially valuable in processes where a complete understanding of the physical mechanisms is very difficult, or even impossible to acquire, as in the case of porous powder performs during upsetting. Neural network is a logical structure with multi-processing elements, which are connected through interconnection weights.
The knowledge is presented by the interconnection weights, which are adjusted during the learning phase. There are several algorithms available among which the
Levenberg-Marquardt algorithm (trainlm) will have the
fastest convergence [15]. In many cases, trainlm is able to
obtain lower mean square errors than any of the other algorithms tested. This BP network is a multi layer of the network architecture including the input layer, hidden layer(s) and output layer. Layers include several process-ing units known as neurons. They are connected with each other by variable weights to be determined. In the network, the input layer receives information from exter-nal source and passes this information to the network for processing. The hidden layer receives from the input layer, and does all information processing. The output layer receives processed information from the network, and sends the results to an external receptor [15]. The algo-rithm for the back propagation program is described
be-low with the help of fbe-low diagram as shown in Figure 2.
2.2.2 Model Description
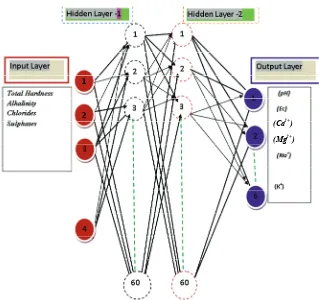
In the development of a multi layer neural network mod-el, several decisions regarding number of neuron(s) in the input layer, number of hidden layer(s), number of neu-ron(s) in the hidden layer(s), and number of neuneu-ron(s) in the output layer and optimum architectures have to be decided. Based on the experimental investigation by
venkatkumar et al. [7,10], the important input parameters
such as the total hardness. Alkalinity, chlorides and Sul-phates are given as input parameters to the present ANN model. The output parameters are the pH, the Ec, the
Ca2+, Mg2+, Na+ and K. The input/output dataset of the
model is illustrated schematically in Figure 3.
2.2.3 Approach towards Groundwater Classification
Analysis of Groundwater for Potability from Tiruchirappalli City Using Backpropagation Ann Model and GIS 139
[image:5.595.138.476.90.214.2]Figure 2. Model for feed forward network (source: Matlab user guide)
(Ca2+)
(Mg2+)
Figure 3. Schematically input/output data set model for prediction of Chlorides and Sulphates
may be like this, If TDS = good AND pH = medium and Sulphate = good then, overall water quality = What! Af-ter this, Delphi’s technique is applied to converge the feedback of various users to a single value. A degree of match is computed between the user’s perception and field data for different parameters and for every type of water quality viz. good, (Desirable) medium (Acceptable) or bad (Not Desirable). The water quality for which de-gree of match is the highest is considered to represent the
quality of the water sample (see Figure 4).
3. Results and Discussions
Physio-chemical Groundwater quality assessment by
de-terministic method for drinking groundwater usage on the basis of 8 water quality parameters were compared with the concentration in the water with point value prescribed limits. In case Groundwater quality model approach, these 8 parameters were divided in the four categories on the basis of expert opinion having their importance with re-spect to drinking water quality criteria.
[image:5.595.138.457.239.539.2]140 Analysis of Groundwater for Potability from Tiruchirappalli City Using Backpropagation Ann Model and GIS
0 10 20 30 40 50 60 70 80
30 40 50 60 70 80 90 100
Number of Samples
% o f G rou nd w at er qu ali ty C las si fic at io n
FIP model out put for Premonsoon '06
OUTPUT(1:79,1) qty min qty max qty mean
(a)
0 10 20 30 40 50 60 70 80
30 40 50 60 70 80 90 100
Number of samples
% of G rou ndwat er qu al ity Cl as si fic at io n
FIP model output for Premonsoon '07
OUTPUT(1:79,1) qty min qty max qty mean
(b)
0 10 20 30 40 50 60 70 80
65 70 75 80 85 90 95
Number of samples
% of G ro undw at er qu al ity c la ss ifi cat ion
FIP model output for Premonsoon '08
OUTPUT(1:79,1) qty min qty max qty mean
[image:6.595.66.279.82.661.2](c)
Figure 4. Subsurface water potable frequency during pre-monsoon periods. (a) 2006; (b) 2007; (c) 2008
during storage.
The performance capability of each network has been
examined based on the correlation coefficient, error dis-tribution, and convergence of entire dataset within speci-fied error range between the network predictions and the experimental values using the test and entire dataset. In order to decide the optimum structure of neural network, the rate of error convergence was checked by changing the number of hidden neurons and number of hidden lay-ers. From out results, it is identified that the network with single hidden layer of 50 neurons has given correlation coefficient of 0.9978 and mean error of 0.0289% which means the error distribution was uniform. But it was ob-served that only 78.68% of entire dataset are within ± 4% error further increasing of neuron in the single hidden layer (beyond 50); the error distribution was not uniform. Hence, it has been decided to select two hidden layers and varied the number of neurons in each hidden layer to get an optimum one. It was observed that the network with 50 neurons in each hidden layer has produced the best performance for each of the output parameters (4-50-50-6). It is also observed that the architectures 4-40-40-6, 4-46-46-6, and 4-52-52-6, have not more dif-ference in the mean correlation coefficient than previous architecture; it had not been selected as an optimum ar-chitecture, because the mean prediction error as well as the error distribution, maximum value of error, minimum value of error were observed as high.
It was evaluated and presented the optimum network model of 4-50-50-6 has mean prediction error of –0.023% on the entire dataset. The result shows that 91.69%, 95.78%, and 98.63% of the entire dataset were the per-centage error ranging between ± 4%, ± 8, and ± 12% respectively. This was demonstrated that the developed model has high accuracy for predicting. Characteristic by pH values, most of the water samples were alkaline in nature which are well within permissible limit (6.5-8.5) and some of the samples have been found acceptable for usage and the ranges were between 6.5 and 9.2 meeting BIS standards of IS:10500:1991 and WHO (2006) guide-lines. Based on Electrical Conductivity (Ec) values measured all water samples Zone-I (Srirangam) were desirable (< 1 mS/cm) for potability. Potability maps for
the Premonsoon period are shown as Figures 5(a), 5(b)
and 5(c) for years 2006, 2007 and 2008 respectively.
4. Conclusions
The quality of the groundwater of the Tiruchirappalli city was monitored in 79 sampling wells for 3 years and re-corded data revealed that the concentrations of cations and anions were above the maximum, desirable for hu-man consumption. The Electrical Conductivity was found to be the most significant parameter within input parameters used in the modeling. The developed model was enabled well to test the data obtained from 79 sam-ples of bore wells of Tiruchirappalli city. Therefore, with the proposed model applications, it was possible to man-
141 Analysis of Groundwater for Potability from Tiruchirappalli City Using Backpropagation Ann Model and GIS
age groundwater resources in a more cost-effective and easy way. Based upon the correlation coefficient, error distribution, and convergence 46 different BPNN archi-tectures were trained/analyzed using the experimental data until an optimum architecture was identified. Out of the different multilayer BPNN architecture trained, the BPNN with two hidden layers having 50 neurons trained with Levenberg-Marquardt algorithm was found to be the
78.64 78.66 78.68 78.7 78.72 78.74 78.64 78.66 78.68 78.7 78.72 78.74
10. 7 4 10. 7 6 10. 7 8 10 .8 10. 8 2 10. 8 4 10. 8 6 10 .74 10 .76 10 .78 10. 8 10 .82 10 .84 10 .86
Suitability Map - winter'06 - Tiruchirappalli City
Zone I
Zone IV
Zone II
Zone III
86 - 91 91 - 96
81 - 86 76 - 81 71 - 76 66 - 71 < 66
(a)
78.64 78.66 78.68 78.7 78.72 78.74
78.64 78.66 78.68 78.7 78.72 78.74
1 0. 74 10. 76 10. 78 10. 8 10. 8 2 10. 84 10. 86 10. 74 10. 76 10. 78 10. 8 10 .82 10. 84 10. 86
Suitability Map - winter'07 - Tiruchirappalli City
Zone I
Zone IV
Zone II
Zone III
76 - 84
84 - 92
68 - 76 60 - 68 52 - 60 44 - 52 < 44
(b)
78.64 78.66 78.68 78.7 78.72 78.74
78.64 78.66 78.68 78.7 78.72 78.74
10 .74 1 0. 7 6 10 .78 10 .8 10 .82 10.84 1 0. 8 6 10 .74 10 .76 10 .78 10 .8 10 .82 10 .8 4 10 .86
Suitability Map - winter'08 - Tiruchirappalli City
Zone I
Zone IV
Zone II
Zone III
85 - 95 > 95
75 - 85 65 - 75 55 - 65 45 - 55 < 45
(c)
Figure 5. (a) Potability map of Winter 2006; (b) Potability map of Winter 2007; (c) Potability map of Winter 2008
optimum network model. A sound performance was achieved with the neural network model, with good cor-relation coefficient (between the predicted and experi-mental values), high uniform error distribution and the convergence of the entire dataset within the permissible error range.
5. Acknowledgements
The First Author would like to express his sincere appre-ciation to TEQIP Scholarship during his Ph.D., work. Special thanks go to S.Sivasankaran (NITT) J. Nagesh Gupta (TCS) and M. Kannan (SASTRA) in the GIS field, ANN, Simulink activities and in the laboratory meas-urement of this study. Thanks to Prof. K. Palanichamy, Civil Engineering Department, NITT for providing con-stant encouragement throughout his research study. The authors wish to express their sincere thanks to the ano-nymous reviewers for their valuable comments to en-hance the quality of this paper.
REFERENCES
[1] American Public Health Association,“Standard Method for Examination of Water and Waste Water,” 21st Edition, American Public Health Association, Washington, D.C., 2005.
[image:7.595.315.529.84.353.2]142 Analysis of Groundwater for Potability from Tiruchirappalli City Using Backpropagation Ann Model and GIS
Copyright © 2010 SciRes. JEP
[3] Z. Chen, G. H. Huan and A. Chakma, “Hybrid Fuzzy-Sto-chastic Modeling Approach for Assessing Environmental Risks at Contaminated Groundwater Systems,” Journal of Environmental Engineering, Vol. 129, No. 1, 2003, pp. 79-88.
[4] C. Okoliand and S. D. Pawlowski, “The Delphi Method as a Research Tool an Example, Design Considerations and Applications,” Information and Management, Vol. 42, No. 1, 2004, pp. 15-29.
[5] R. D. Deshpande and S. K. Gupta, “Water for India in 2050: First Order Assessment of Available Options,”
Current Science, Vol. 86, No. 9, 2004, pp. 1216-1224. [6] T. Subramani, L. Elango and S. R. Damodarasamy,
“Groundwater Quality and its Suitability for Drinking and Agricultural Use in Chithar River Basin, Tamil Nadu, In-dia,” Environmental Geology, Vol. 47, No. 8, 2005, pp. 1099-1110.
[7] N. V. Kumar, S. Mathew and G. Swaminathan, “A Pre-liminary Investigation for Groundwater Quality and Health Effects—A Case Study,” Asian Journal of Water, Environment and Pollution,Vol. 5, No. 4, 2008, pp. 99- 107.
[8] K. Sivasankar and R. Gomathi, “Fluoride and Other Quality Parameters in the Groundwater Samples of Pet-taivaithalai and Kulithalai Areas of Tamil Nadu, Southern India,” Water Quality Exposure Health, Vol. 1, No. 2,
2009, pp. 123-134.
[9] R. Khaiwal and V. K. Garg, “Distribution of Fluoride in Groundwater and its Suitability Assessment for Drinking Purposes,” International Journal of Environmental Health Research, Vol. 16, No. 2, 2006, pp. 163-166. [10] N. V. Kumar, S. Mathew and G. Swaminathan, “Fuzzy
Information Processing for Assessment of Groundwater Quality,” International Journal of Soft Computing, Vol. 4, No. 1, 2009, pp 1-9.
[11] S. Dahiya, B. Singh, S. Gaur, V. K. Garg and H. S. Kushwaha, “Analysis of Groundwater Quality Using Fuzzy Synthetic Evaluation,” Journal of Hazard Materi-als, Vol. 147, No. 3, 2007, pp. 938-946.
[12] World Health Organisation, “Guidelines for Drinking Water Quality Recommendation,” Vol. 2, World Health Organisation, Geneva,1984.
[13] Z. Sen, “Fuzzy Groundwater Classification Rule Deriva-tion from Quality Maps,” Water Quality Exposure Health, Vol. 1, 2009, pp. 115-112.
[14] W. C. Chen, G. L. Fu, P. H. Tai and W. J. Deng, “Process Parameter Optimization for MIMO Plastic Injection Molding via Soft Computing,” Expert System with Ap-plications, Vol. 36, No. 2, 2009, pp. 1114-1122