All-cause mortality in people with cirrhosis compared
with the general population: a population-based
cohort study
Kate M Fleming, Research Associate1
Guruprasad P Aithal, Consultant Hepatobiliary Physician2 Tim R Card, Clinical Associate Professor1,3
Joe West, Clinical Associate Professor1
1Division of Epidemiology and Public Health, University of Nottingham, Nottingham, UK; 2Nottingham Digestive Diseases Centre, NIHR-Biomedical Research Unit, Nottingham University Hospitals NHS Trust, Nottingham, UK; and 3Department of Gastroenterology, Kings Mill Hospital, Mansfield Road, Sutton, Ashfield, UK
Running title: Cirrhosis mortality
*corresponding author: Kate Fleming, Research Associate, Division of Epidemiology and Public Health, University of Nottingham, Nottingham NG5 1PB, Tel: 0115 823 1356, Fax: 0115 823 1946 Email: kate.fleming@nottingham.ac.uk
Keywords: cirrhosis, epidemiology, mortality
Abstract
Background
Mortality due to cirrhosis has tripled over the last 30 years in the UK. However, we lack adequate, contemporary, population-based estimates of the excess mortality patients are at risk of compared with the general population.
Aim
To determine the overall survival in patients with cirrhosis compared with the general population taking into account the effects of severity and aetiology of disease, and comorbidity.
Methods
In a cohort study, we identified 4537 people with cirrhosis and a control cohort of 44,403 patients, matched by age, sex and general practice from the UK General Practice Research Database between June 1987 and April 2002.
Results
Patients with compensated cirrhosis had a near 6-fold (Hazard Ratio 5.8 95% CI [5.5-6.1]) increased risk of death while those with decompensated cirrhosis had a near 10-fold (HR 9.7 95% CI [8.9-10.6]) increased risk compared with the general
population. Alcoholic cirrhosis conferred a worse prognosis than non-alcohol related cirrhosis both in the first year following diagnosis and subsequently.
Conclusion
Introduction
Mortality from liver cirrhosis in the UK has tripled over the last three decades and recent estimates of the incidence of cirrhosis suggest that this is also increasing raising the spectre of escalating morbidity and mortality in the future.[1] [2] [3] There are several studies which report the number of people who die with a recording of cirrhosis on their death certificate and the trends in such data but there is little information about the mortality experience of patients with cirrhosis.
Few contemporary studies have been able to take a truly population based approach (i.e. including those patients who are not admitted to hospital) to determining the mortality experience with the general population taking into account both comorbid conditions and the aetiology and severity of the liver disease.
Perhaps the most commonly referenced figures in the literature looking at the mortality experience of patients with cirrhosis are those based on 1155 consecutive patients admitted to a single hospital in Sicily during the 1970s and 1980s.[4] More recently, two studies have approached the issue of survival in cirrhosis using large hospital-based databases.[5] [6] Thus, most of our knowledge on the mortality experience of people with cirrhosis is from a few highly selected populations which may not be broadly representative of the whole population of people with cirrhosis i.e. including those who do not require admission to hospital with their disease.
Additionally, we do not have precise and contemporary estimates of the all-cause mortality at a population level of people with cirrhosis taking into account the
compensated or decompensated state of the patient. Nor have we previously been able to make the necessary comparisons with the general population to understand the magnitude of the burden of this disease. Indeed in a recent Health Technology Assessment systematic review it was claimed that existing data suggest that there is
general population[7] for the purposes of the cost-effectiveness analysis carried out. We have therefore taken the opportunity presented by prospectively recorded
Methods
Description of GPRD
The General Practice Research Database (GPRD) is a longitudinal database consisting of anonymous computerised general practice records for over 13 million patients in the UK, including over 50 million patient years of usable data. Practices are subjected to regular data quality checks and audits to maintain 95% inclusion of prescribing and morbidity events. Data contained within this database are recorded through direct entry during general practice appointments and following
communication from secondary care. Data are coded based on both the Oxmis and Read medical coding dictionaries. The GPRD has previously been shown to be broadly representative of the population of the UK.[8] Approval was given by the Scientific and Ethical Committee of the GPRD for this study.
Study population
We obtained all records of patients with a diagnostic code for any liver disease within the GPRD between June 1987 and April 2002. Patients aged 25 and over were selected based on the presence of a diagnostic or therapeutic code for cirrhosis, oesophageal varices and/or portal hypertension to represent a cohort of adult diagnosed cirrhosis. This age cut-off was designed to avoid including patients who may have had the onset of cirrhosis under the age of 18. Each patient was assigned a date of diagnosis of cirrhosis as the date of the first record of any of these codes.
longer alive at their matched subject’s time of diagnosis with cirrhosis. The date of diagnosis of cirrhosis was taken as the date of ‘pseudo-diagnosis’ for controls.
Definitions
Patients with cirrhosis were classified as being in a compensated or decompensated disease state at the date of diagnosis. Cases with a code for ascites or
gastrointestinal bleed or a prescription for spironolactone at or before the date of diagnosis were classified as being in a decompensated disease state with all other cases classified as compensated.
Age was defined as age at date of diagnosis of cirrhosis for cirrhosis patients or date of pseudo-diagnosis for controls. We categorised age as 25-44 years, 45-64 years and 65+ years. Alcohol intake prior to diagnosis was defined as either teetotal, drinker or problem drinker based on Read and Oxmis codes. Comorbidity was defined using the Charlson index, a weighted score shown to be strongly related to mortality.[9] Weighted scores for mild or severe liver disease were not included within this analysis. Patients’ records were examined for comorbidities prior to the date of diagnosis or pseudo-diagnosis and then an individual Charlson score was calculated. Scores were categorised as 0, 1, or 2+ for the purposes of analysis. Body Mass Index (BMI) (kg/m2) was defined using data on height, weight and/or BMI
recorded at least 1 year prior to diagnosis or pseudo-diagnosis. This cut-off was
used to try and ensure that weight loss due to undiagnosed disease did not change
the initial BMI categorisation of subjects. Presumed aetiology of cirrhosis of either
Statistical analyses
Using Cox proportional hazards regression we modelled the hazard of death in the cirrhosis cohort compared with the control cohort employing an historical matched cohort study design. Subjects with cirrhosis and controls entered the analysis period at the date of diagnosis or pseudo-diagnosis respectively and exited at the earliest of either date of death, date of moving out of their general practice or 30 April 2002, the last date of available data at the time of extraction. We classified subjects with cirrhosis as either compensated at entry or decompensated at entry and
subsequently modelled compensation as a time-varying covariate. All models were adjusted, a priori, for age and sex. Additional potential confounders (alcohol intake and comorbidity) were modelled as categorical variables (with a separate category for missing data) and included if they conferred a 10% adjustment in the hazard ratios seen. Following results from previous studies we planned to stratify by comorbidity at the design stage. We split follow up time at one year and modelled hazard ratios during the first year following diagnosis and after one year. We then split the population of cases into those with alcoholic cirrhosis and those with non-alcohol related cirrhosis (all other causes and unspecified) and examined the mortality rates and adjusted hazard ratios compared with their matched controls for these two aetiologic groups.
To minimise the potential for survival bias we ran the principal analysis again
comparing mortality between compensated and decompensated cases and controls using only incident cases (as described previously[2]) and their matched controls. To try to account for potential attrition bias the principal analysis was repeated using the earliest of date of death, deregistration or last recorded appointment in the GPRD as the exit-point for the analysis.
Results
A total of 4537 patients aged 25 and over with a diagnosis of cirrhosis were
identified, with a control cohort of 44,403 patients, matched by age, sex and general practice. Median age at diagnosis was 56 years and 58% of subjects were male. Selected demographic, lifestyle and clinical characteristics of the study population are described in table 1. Subjects with cirrhosis had more recorded comorbidity than the control cohort, but the majority of patients in both cohorts had no recorded
comorbid illness (77.7% of patients with cirrhosis; 83.5% of control cohort). Substantially more subjects with cirrhosis than control subjects were recorded as being known problem drinkers prior to diagnosis / pseudo-diagnosis (30% vs. 2% respectively).
The presumed aetiology of cirrhosis (taking into account medical records before and after diagnosis of cirrhosis) was recorded as alcoholic in just over half of our study population (50.9%). Nearly two-fifths of our cirrhosis cohort had no specified aetiology (38.1%). The majority of the patients with cirrhosis were identified at an early stage of cirrhosis with 68.9% being classified as compensated at entry. Only 2.3% of patients with cirrhosis went on to subsequently have a liver transplant recorded.
Survival analysis
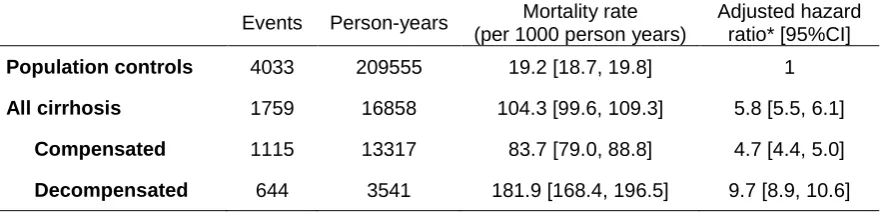
decompensated cirrhosis compared with the general population with a hazard ratio of 9.7 (95% CI [8.9, 10.6]) (table 2) but a significantly higher hazard of death was still seen for patients with compensated cirrhosis; hazard ratio 4.7 (95% CI [4.4, 5.0]) compared with the general population.
Overall survival at 1 and 5 years was 87.3% [95% CI 86.1%, 88.4%] and 66.5% [95% CI 64.5%, 68.5%] respectively in patients with compensated disease (Figure 2). This contrasts with the much lower figures for patients with decompensated disease being at 1 year 75.0% [95% CI 72.5%, 77.3%] and at 5 years 45.4% [95% CI 42.1%, 48.7%].
Mortality was higher during the first year than following as shown in table 3 but also remained substantial beyond one year. Stratification by comorbidity showed that although the absolute mortality rates in those with no comorbidity were not as high as those with a large amount of comorbidity (Charlson score 2 or more) the adjusted hazard ratios for death were highest in this group. This high relative risk of death was most noticeable in the first year following diagnosis with hazard ratios of 8.3 for the compensated cohort compared with the general population and 18.0 for the decompensated cohort.
The absolute mortality rates of subjects with non-alcohol related cirrhosis was higher than that of subjects with alcoholic cirrhosis in the first year following diagnosis. Subsequent to the first year absolute mortality was similar in both groups. However, the adjusted hazard ratios for mortality were much higher in the subjects with
controls of subjects with non-alcohol related cirrhosis. This is principally mediated by the age-matching of controls. Patients with alcoholic cirrhosis had a significantly lower age at diagnosis (median age 52 years) than those with non-alcohol related cirrhosis (median age 63 years).
Sensitivity analyses
Discussion
We have shown that patients with cirrhosis including those not necessarily admitted to hospital have a substantially reduced survival. Overall, patients with compensated cirrhosis have a nearly 6-fold increased risk of death compared with the general population and those with decompensated disease a nearly 10-fold increased risk. The considerable excess mortality we found is not explained by comorbidity in our cirrhotic cohort as even in those with no recorded comorbidity the hazard ratios for mortality are markedly increased compared with similarly matched general population controls. Mortality relative to similar age- and sex-matched control cohorts was substantially greater for those subjects with alcoholic cirrhosis compared with subjects with non-alcohol related cirrhosis both in the first year following diagnosis and subsequently.
By virtue of the electronic primary care data from a broad sample of primary care physicians at our disposal we have a constructed a large, representative, population-based cohort of patients with cirrhosis with an appropriate general population
comparison cohort. These cohorts were identified reasonably recently (1987-2002) and therefore the results we have generated reflect the natural history of cirrhosis during this period. As this is a population-based cohort, it is unlikely to have been affected by the variation in referrals and follow-ups seen in cohorts selected from secondary care. The size of the dataset we have used has allowed us to estimate mortality rates and adjusted hazard ratios for death stratifying by severity of disease, follow-up time and comorbidity. We are confident based upon our previous validation study[2] (which showed the vast majority of patients with a recorded code for
probably symptomatic and therefore likely to be moderate to large-volume, clinically significant ascites (rather than that only identified by ultrasound). It could be argued that the inclusion of both incident and prevalent cases in the cirrhosis cohort might lead to the introduction of survival bias as those cases who are prevalent have, by definition, already survived a particular length of time to still be included in the analysis. However, estimates from the sensitivity analyses, including only incident cases, remained within the 95% confidence interval of the principal analysis. The results reported including all incident and prevalent cases probably more accurately reflects the real world of clinical practice within the general population and allows for the communication of results that are directly valid to the patients being seen in primary care.
Though the data available have allowed for an appropriate individually matched
adjustment for some confounders (age and sex) it was not possible to examine the
potential associations or modifying effects of other variables either because they
were not available in the version of the GPRD used for this analysis e.g.
socio-economic status, or because there was such a high proportion of missing data e.g.
BMI. Data were also missing for alcohol status prior to diagnosis in over 90% of our
cohort (66% of those with cirrhosis, 96% of control cohort). There is a potential bias
in the recording of alcohol status with a GP perhaps more likely to record the
knowledge of a patient drinking heavily as this may affect their health, but conversely
a patient may not be recorded as being teetotal unless they actually suffered from a
condition that may be considered to be associated with alcohol use. With such a
high proportion of missing data it was not practical to model the survival analyses
including only patients with available data. When including missing data as a
separate category alcohol status did not remain within the multivariable model.
et al described the survival of 512 people admitted to hospital with cirrhosis in the West Midlands region of the UK between 1959 and 1976.[10] Our 5-year survival estimates for compensated and decompensated cirrhosis are higher than theirs. This suggests that as expected some improvements that impact on death in the
management of cirrhosis have occurred in the intervening 20 or so years, though some ascertainment bias in the earlier study with the most severe (and frequently hospitalised) cases being over represented is possible. Our findings are analogous to the case fatality rates and standardized mortality ratios (SMR) reported from the Oxford region of the UK between 1968 and 1999 in people who had an admission to hospital with either chronic liver disease or cirrhosis.[6] The 1-year SMR of 16.3 is substantially higher than the 1-year adjusted hazard ratios we have reported for patients with either compensated or decompensated disease. Five-year survival was not calculated in their study. In comparison with the large Danish cohort study we again report better 1- and 5-year survival rates. [5] The poorer survival estimates seen in these previous studies are unsurprising considering the hospital-based nature of the patients selected. Our results are perhaps more widely generalisable to patients diagnosed with cirrhosis including those ambulatory patients who have not been admitted to hospital. A similar difference in survival rates is seen when comparing our results to that of the widely quoted figures from D’Amico and colleagues of 6-year survival of 54% and 21% in patients with compensated and decompensated cirrhosis respectively.[11] It is possible that the improvements in survival seen in our data are a reflection of improved management and outcomes of the complications of cirrhosis in the intervening decades or indeed that the high prevalence of hepatitis B virus in the Sicilian population means that we are
Table 1 Demographic, lifestyle and clinical characteristics of cirrhosis cohort and general population cohort.
Demographics / lifestyle factors Cirrhosis Cohort N=4537
Control Cohort N=44,403 Age at diagnosis (years)
25-44 45-64 65+ 943 (20.8) 2256 (49.7) 1338 (29.5) 9403 (21.2) 22219 (50.0) 12781 (28.8) Sex Male Female 2612 (57.6) 1925 (42.4) 25599 (57.7) 18804 (42.3) Comorbidity† Charlson 0 Charlson 1 Charlson 2+ 3525 (77.7) 534 (11.8) 478 (10.5) 37085 (83.5) 3704 (8.3) 3614 (8.1) BMI
Median BMI [IQR] (kg/m2) No recorded BMI
25.5 [22.5, 28.7] 3624 (80.0)
25.3 [23.0, 28.2] 33 294 (75.0)
Alcohol status (prior to diagnosis) Teetotal Drinker Problem drinker No record 2 (<0.1) 170 (3.7) 1378 (30.4) 2987 (65.8) 10 (<0.1) 1007 (2.3) 740 (1.7) 42646 (96.0) Presumed aetiology‡ Alcoholic cirrhosis Viral hepatitis Autoimmune LD Metabolic LD Not classified 2307 (50.8) 238 (5.2) 48 (1.1) 354 (7.8) 1730 (38.1) -
Disease state at entry Compensated Decompensated
3126 (68.9) 1411 (31.1)
-
Liver Transplant (following diagnosis of cirrhosis)
106 (2.3) 2 (<0.1)
†Charlson index as per methods excluding liver disease. Absence of coding for disease assumed to represent disease not present.
Table 2 Mortality rates and hazard ratios overall compared with the general population
Events Person-years Mortality rate
(per 1000 person years)
Adjusted hazard ratio* [95%CI]
Population controls 4033 209555 19.2 [18.7, 19.8] 1
All cirrhosis 1759 16858 104.3 [99.6, 109.3] 5.8 [5.5, 6.1]
Compensated 1115 13317 83.7 [79.0, 88.8] 4.7 [4.4, 5.0]
Figure 1
Survival estimates for controls, subjects with compensated cirrhosis and subjects with decompensated cirrhosis.
0
.0
0
0
.2
5
0
.5
0
0
.7
5
1
.0
0
P
ro
p
o
rt
io
n
a
liv
e
1411 592 319 168 88
Decompensated
3126 1829 1183 767 493
Compensated
43355 29489 19951 12905 8139
Controls Number at risk
0 2 4 6 8
Follow-up time (years)
Controls Compensated
Decompensated
Table 3. Mortality rates and hazard ratios during the first year and
subsequently compared with the general population stratified by Charlson index and adjusted for age and sex
Mortality rate (per 1000) Adjusted hazard ratio Control
cohort
Compensated cohort
Decompensated cohort
Compensated cohort
Decompensated cohort During first year
Overall 20.1 141.7 304.8 7.2 [6.4, 8.2] 15.1 [13.3, 17.2]
Charlson score
0 16.5 132.9 295.0 8.3 [7.2, 9.6] 18.0 [15.4, 21.0]
1 28.6 152.9 266.1 5.7 [4.0, 8.3] 10.7 [7.4, 15.5]
2+ 49.5 215.4 396.6 4.4 [3.2, 6.1] 8.2 [6.1, 11.1]
Following first year
Overall 19.0 69.2 129.1 4.0 [3.7, 4.3] 7.5 [6.7, 8.5]
Charlson score
0 16.4 65.8 121.7 4.4 [4.0, 4.8] 8.1 [7.0, 9.3]
1 32.8 89.6 116.0 3.1 [2.4, 3.9] 5.0 [3.7, 6.9]
Table 4. Mortality rates and hazard ratios during the first year and
subsequently compared with the general population stratified by aetiology and adjusted for age and sex
Events
Person-years
Mortality rate (per 1000 person years)
Adjusted hazard ratio* [95%CI]
During first year Alcoholic cirrhosis
Controls 271 20 344 13.3 [11.8, 15.0] -
Compensated cirrhosis 174 1282 135.8 [117.0, 157.5] 10.5 [8.7, 12.7]
Decompensated cirrhosis
153 631 242.6 [207.1, 284.3] 17.7 [14.5, 21.6]
Non-Alcohol-related cirrhosis
Controls 525 19 257 27.3 [25.0, 29.7] -
Compensated cirrhosis 204 1385 147.3 [128.4, 168.9] 5.7 [4.8, 6.7]
Decompensated cirrhosis
171 432 395.5 [340.5, 459.5] 13.7 [11.5, 16.3]
Following first year Alcoholic cirrhosis
Controls 1181 90 469 13.1 [12.3, 13.8] -
Compensated cirrhosis 398 5285 75.3 [68.3, 83.1] 6.0 [5.4, 6.8]
Decompensated cirrhosis
190 1501 126.6 [109.8, 146.0] 11.0 [9.4, 12.8]
Non-Alcohol-related cirrhosis
Controls 2056 79 485 25.9 [24.8, 27.0] -
Compensated cirrhosis 339 5365 63.2 [56.8, 70.3] 2.9 [2.6, 3.2]
Decompensated cirrhosis
130 977 133.0 [112.0, 158.0] 5.2 [4.4, 6.2]
References
1. On the State of the Public Health, in Annual Report of the Chief Medical Officer. 2001, Department of Health. p. 28.
2. Fleming, K.M., et al., Incidence and prevalence of cirrhosis in the United
Kingdom, 1992-2001: A general population-based study. J Hepatol,
2008.
3. Leon, D.A. and J. McCambridge, Liver cirrhosis mortality rates in Britain
from 1950 to 2002: an analysis of routine data. Lancet, 2006. 367(9504):
p. 52-6.
4. D'Amico, G., G. Garcia-Tsao, and L. Pagliaro, Natural history and
prognostic indicators of survival in cirrhosis: a systematic review of 118 studies. J Hepatol, 2006. 44(1): p. 217-31.
5. Jepsen, P., et al., Comorbidity and survival of Danish cirrhosis patients:
a nationwide population-based cohort study. Hepatology, 2008. 48(1): p.
214-20.
6. Roberts, S.E., M.J. Goldacre, and D. Yeates, Trends in mortality after
hospital admission for liver cirrhosis in an English population from 1968 to 1999. Gut, 2005. 54(11): p. 1615-21.
7. Thompson Coon, J., et al., Surveillance of cirrhosis for hepatocellular
carcinoma: systematic review and economic analysis. Health Technol
Assess, 2007. 11(34): p. 1-206.
8. Walley, T. and A. Mantgani, The UK General Practice Research
Database. Lancet, 1997. 350(9084): p. 1097-9.
9. Charlson, M.E., et al., A new method of classifying prognostic
comorbidity in longitudinal studies: development and validation. J
Chronic Dis, 1987. 40(5): p. 373-83.
10. Saunders, J.B., et al., A 20-year prospective study of cirrhosis. Br Med J (Clin Res Ed), 1981. 282(6260): p. 263-6.
11. D'Amico, G., et al., Survival and prognostic indicators in compensated
and decompensated cirrhosis. Dig Dis Sci, 1986. 31(5): p. 468-75.
12. El-Serag, H.B. and J.E. Everhart, Improved survival after variceal
hemorrhage over an 11-year period in the Department of Veterans Affairs. Am J Gastroenterol, 2000. 95(12): p. 3566-73.
13. Planas, R., et al., Natural history of patients hospitalized for
management of cirrhotic ascites. Clin Gastroenterol Hepatol, 2006.
4(11): p. 1385-94.
14. Stokkeland, K., et al., Improved prognosis for patients hospitalized with
esophageal varices in Sweden 1969-2002. Hepatology, 2006. 43(3): p.
500-5.