ORIGINAL RESEARCH
Functional Connectivity MR Imaging Reveals
Cortical Functional Connectivity in the Developing
Brain
W. Lin Q. Zhu W. Gao Y. Chen C.-H. Toh M. Styner G. Gerig J.K. Smith B. Biswal J.H. Gilmore
BACKGROUND AND PURPOSE: Unlike conventional functional MR imaging where external sensory/ cognitive paradigms are needed to specifically activate different regions of the brain, resting functional connectivity MR imaging acquires images in the absence of cognitive demands (a resting condition) and detects brain regions, which are highly temporally correlated. Therefore, resting functional MR imaging is highly suited for the study of brain functional development in pediatric subjects. This study aimed to determine the temporal and spatial patterns of rfc in healthy pediatric subjects between 2 weeks and 2 years of age.
MATERIALS AND METHODS:Rfc studies were performed on 85 children: 38 neonates (2– 4 weeks of age), 26 one-year-olds, and 21 two-year-olds. All subjects were imaged while asleep; no sedation was used. Six regions of interest were chosen, including the primary motor, sensory, and visual cortices in each hemisphere. Mean signal intensity of each region of interest was used to perform correlation analysis pixel by pixel throughout the entire brain, identifying regions with high temporal correlation.
RESULTS: Functional connectivity was observed in all subjects in the sensorimotor and visual areas. The percent brain volume exhibiting rfc and the strength of rfc continued to increase from 2 weeks to 2 years. The growth trajectories of the percent brain volume of rfc appeared to differ between the sensorimotor and visual areas, whereas thez-score was similar. The percent brain volume of rfc in the sensorimotor area was significantly larger than that in the visual area for subjects 2 weeks of age (P⫽ .008) and 1-year-olds (P⫽.017) but not for the 2-year-olds.
CONCLUSIONS:These findings suggest that rfc in the sensorimotor precedes that in the visual area from 2 weeks to 1 year but becomes comparable at 2 years. In contrast, the comparablez-score values between the sensorimotor and visual areas for all age groups suggest a disassociation between percent brain volume and the strength of cortical rfc.
B
iswal et al1,2have observed the synchronization oflow-frequency blood oxygen level– dependent (BOLD) con-trast signal intensity in the brain. Specifically, time-series T2*-weighted images were acquired rapidly while subjects lay resting inside an MR imaging scanner. A temporal low-pass filter (cutoff frequency⬃0.08 Hz) was applied pixel by pixel to the acquired images. Subsequently, a brain region with known function was selected, and signal intensity in this re-gion was temporally correlated with each pixel throughout the entire brain. Most interesting, brain regions with a function similar to that in this predefined area exhibited high temporal correlation. In addition, these temporally correlated regions resembled the brain activation maps of the same subject actu-ally performing a paradigm known to activate these brain ar-eas, finger tapping in their case, during a conventional func-tional MR imaging (fMRI) study. Biswal et al1thus suggested that the observed high temporal correlation among
function-ally similar brain regions may represent the putative resting cortical functional connectivity and referred to this imaging approach as resting functional connectivity MR imaging (rfc-MRI). Since then, similar findings have been replicated by many investigators in both healthy subjects3-6 and patient populations.7-10
Unlike conventional fMRI in which external sensory/ cognitive paradigms are needed to specifically activate differ-ent regions of the brain, rfcMRI acquires images in the absence of cognitive demands (a resting condition) and detects brain regions, which are highly temporally correlated. Because rfc-MRI does not require subjects to follow specific instructions and subjects are in a resting condition, this approach could, potentially, be a powerful tool for delineating rfc in young pediatric subjects. To this end, this study focuses on how rfc may be present in very young pediatric subjects (0 –2 years of age). Specifically, this study aimed to investigate the following 2 questions: 1) Does cortical rfc exist in healthy pediatric sub-jects between 0 and 2 years of age; and 2) if so, how does cortical rfc change with age?
Materials and Methods
The children scanned were part of a larger ongoing prospective study of brain development in healthy and high-risk children.11For the
investigation of rfc, only the healthy subjects who met the following inclusion and exclusion criteria were included for final data analysis: birth between the gestational ages of 35 and 42 weeks, weight that was appropriate for gestational age, and the absence of major pregnancy and delivery complications as defined in the exclusion criteria.
Exclu-Received April 14, 2008; accepted after revision June 14.
From the Departments of Radiology (W.L., Y.C., J.K.S.), Biomedical Engineering (W.G.), and Psychiatry (J.H.G., M.S.), University of North Carolina at Chapel Hill, Chapel Hill, NC; Department of Electrical and Computer Engineering (Q.Z.), Duke University, Durham, NC; Department of Medical Imaging and Intervention (C.-H.T.), Chang Gung Memorial Hospital and Chang Gung University College of Medicine, Tao-Yuan, Taiwan; Scientific Computing and Imaging Institute (G.G.), Utah University, Salt Lake City, Utah; and Department of Radiology (B.B.), University of Medicine and Dentistry of New Jersey, Newark, NJ.
This work was supported by National Institutes of Health grants R01NS055754 (W.L.) and R01MH070890 (J.H.G.).
Please address correspondence to Weili Lin, PhD, University of North Carolina at Chapel Hill, Department of Radiology, CB #7515, Chapel Hill, NC 27599; e-mail: [email protected]
DOI 10.3174/ajnr.A1256
FUNCTIONAL
ORIGINAL
sion criteria included maternal pre-eclampsia, placental abruption, neonatal hypoxia, or any neonatal illness requiring⬎1-day stay in the neonatal intensive care unit; a mother with human immunodefi-ciency virus; any mother actively using illegal drugs/narcotics during pregnancy; or any chromosomal or major congenital abnormality. In addition, a board-certified neuroradiologist (J.K.S.) reviewed all im-ages to verify that there were no apparent abnormalities in the ac-quired MR images.
Connectivity studies were performed on a total of 85 children: 38 neonates (2– 4 weeks of age), 26 one-year-olds, and 21 two-year-olds. Informed consent was obtained from the parents before the imaging studies. All images were acquired on an Allegra 3T head-only MR imaging scanner (Siemens, Erlangen, Germany), and the study was approved by the institutional review board. All subjects were imaged while asleep; no sedation was used.11
Imaging Protocols
A 3D magnetization-prepared rapid acquisition of gradient echo (MPRAGE) sequence was used to provide anatomic images, coregis-ter among subjects, and define regions of incoregis-terest to obtain the refer-ence signal intensity for subsequent temporal correlation analysis. The imaging parameters were as follows: TR⫽1820 ms; TE⫽4.38 ms; TI⫽1100 ms; 144 sections; and voxel size⫽1⫻1⫻1 mm3. For
the rfcMRI studies, a T2*-weighted echo-planar imaging (EPI) se-quence was used to acquire images. The imaging parameters were as follows: TR⫽2 seconds, TE⫽32 ms; 33 sections; and voxel size⫽ 4⫻4⫻4 mm3. This sequence was repeated 150 times to provide
time-series images. In 6 neonates and 5 one-year-old children, a TR of 750 ms instead of 2 seconds was used to acquire the rfcMRI images to determine whether the choice of TR (sampling rate) would affect our ability to discern rfc. With the reduction in TR, only 12 sections cov-ering the primary motor and sensory cortices were acquired, whereas the remaining imaging parameters were identical. This sequence was repeated 400 times so that the total acquisition time was identical to that of TR⫽2 seconds.
Image Processing
To obtain rfc maps, we processed all of the acquired images with the following procedures. The first 10 sets of images were excluded from data analysis to allow magnetization to reach a steady-state condition. A more detailed description of each step is provided below:
1) Time-shift correction: Because images at different anatomic locations were acquired at a different time, it is imperative to correct for the time differences between different sections. This was done through a phase rotation in the frequency domain.
2) Motion correction: To minimize the potential confounds re-sulting from motion between scans, the Automated Image Registra-tion (AIR)12,13package with 6-parameter rigid-body transformation
was used to coregister all time-series images to the images of the first scan that was used for data analysis. Subsequently, signal intensity as a function of time at multiple randomly selected locations was visually inspected to further ensure that motion artifacts were minimal. Ex-perimental data were excluded from subsequent analysis if we could not identify 90 consecutive motion-free time points, and/or severe motion artifacts were identified.
3) Filtering: A spatial 3D-Gaussian (8⫻8⫻8 mm3and⫽2
mm) filter was applied to the images to improve the signal-intensity-to-noise ratio. Subsequently, Fourier transform was used to convert
the signal intensity versus time of each pixel to the frequency domain, and a low-pass filter with a cutoff frequency of 0.08 Hz was applied. The filtered signal intensity was then inverse Fourier transformed back to the time domain.
4) Region-of-interest selection: To ensure the consistency of de-fining regions of interest for obtaining the reference function for the subsequent correlation analysis, we coregistered the rfcMRI images to the MPRAGE images by using the AIR package for each subject.12,13 Subsequently, a neuroradiologist manually drew 3 regions of interest in each hemisphere for a total of 6 regions of interest by using 2 MPRAGE images, including the right and left primary motor, sen-sory, and visual cortices for each subject, respectively. Representative examples of the anatomic locations of these regions of interest are shown in Fig 1A, -Bfor the sensorimotor and visual areas, respec-tively. These manually selected regions were subsequently mapped onto the coregistered T2*-weighted EPI images to obtain averaged MR signal intensity. Although both the primary motor and sensory cortices were separately identified in the MPRAGE images, the lim-ited spatial resolution of the T2*-weighted EPI images made it diffi-cult to analyze definitively motor and sensory signals, separately. Therefore, signal intensities from voxels identified as the primary mo-tor and sensory cortices were averaged to derive a single reference function to delineate the sensorimotor area. As a result, a total of 4 reference functions were obtained from the predefined regions of interest, including the right and left sensorimotor and right and left visual cortices, respectively.
5) Correlation: Temporal correlation was conducted by correlat-ing each of the 4 reference functions pixel by pixel throughout the entire brain, resulting in 4 separate maps.
6) Correlation normalization: Lowe et al3suggested that the
dis-tributions of in vivo correlation coefficients may not be the same between individuals, across trials in the same subject, or even across voxels within 1 experiment. As a result, a direct average of the cross-correlation coefficients (cc) values to obtain a group mean may intro-duce biases. Therefore, it is imperative to normalize the effects of the intrinsic correlations before conducting group analysis. To this end, correlation coefficients were converted to t values according to t⫽cc
兹
共cc2⫹v2兲, where vis the number of the acquired time points and represents the degrees of freedom.3The calculatedtwasthen converted toz-statistics according toz⫽(t⫺ ⬍t⬎)/, where ⬍t⬎andare the expected value and SD of the Gaussian fit to the full-width at half maximum of thetdistribution. This step is necessary becausetvalues cannot be used directly to obtain group mean maps. 7) Group analysis: The MPRAGE images from 1 of the subjects in each age group were randomly chosen as the template, and MPRAGE images from the remaining subjects were coregistered onto the tem-plate by using the Linear Image Registration Tool (FLIRT) of FMRIB (Oxford Centre for Functional MR of the Brain, Oxford University, UK).
Data Analysis
To compare quantitatively the extent of rfc as a function of age, we calculated several different parameters. First, we separately identified the maximum and minimum percent signal-intensity changes in each subject for visual and sensorimotor areas. We then calculated the differences between the 2 values. Second, we divided the total brain volume exhibiting az-score of⬎1 by the total intracranial brain vol-ume (ICV) for each subject, accounting for the differences in head size across different ages. Third, we recorded the meanz-score values in brain regions exhibiting rfc for each subject. Finally, we also con-ducted a normalized histogram analysis in regions exhibiting rfc for each age group.
Statistical Analysis
For the group comparison, 1-way analysis of variance with a Tukey multiple comparison was used. In contrast, a 2-tailed pairedttest was used for comparison between the 2 cortical areas, namely the senso-rimotor and visual cortices for each age group. AP⬍.05 was consid-ered significant.
Results
Motion artifacts were observed in 18 neonates; 6 one-year-olds and 8 two-year-one-year-olds with TR⫽2 seconds; and 2 neonates and 2 one-year-olds for TR⫽750 ms. In addition, 2 neonates,
6 one-year-olds, and 6 two-year-olds were either born prematurely (⬍35 weeks), with birth complications and an intensive care unit stay of⬎24 hours, and/or were offspring of parents with psychiatric disor-ders. All of these subjects were excluded from final data analysis. As a result, 12 ne-onates, 9 one-year-olds, and 7 two-year-olds with TR⫽2 seconds and 4 neonates and 3 one-year-olds with TR ⫽ 750 ms were included for final data analysis.
An example demonstrating manually selected voxels for the primary motor, sen-sory, and visual cortices is shown in Fig 1A, -B, by using the MPRAGE images of a 2-year-old subject. Representative mean MR imaging signals of these manually se-lected voxels from 3 separate subjects, 1 for each age group, are shown in Fig 1C, -D, for sensorimotor and visual cortices, re-spectively. Note these signals have been processed by using the steps outlined in the “Materials and Methods” section. Evi-dently, the signals resemble a pattern typi-cally observed in task-activated fMRI studies where both “on” and “off ” states are observed (“on” and “off ” reflect the in-crease and dein-crease of MR signal intensity). The differences between the maximum and minimum percent signal-intensity changes for each subject in the sensorimotor and visual corti-Fig 1.A and B, The anatomic locations for defining the sensorimotor and visual areas are shown, respectively. The crosses, filled circles, squares, asterisks, left triangles, and right triangles represent the right motor, right sensory, left motor, left sensory, left visual, and right visual cortices, respec-tively.CandD, Representative processed MR signals at the sensorimotor and visual areas by using the approaches outlined in the “Materials and Methods” section for a neonate (upper row) and 1- (middle row) and 2-year-old (bottom row) children are shown, respectively.EandF, The percent signal intensity difference between the maximum and minimum signals for the sensorimotor and visual areas are shown for each age group. The error bars represent the SDs. max indicates maximum; s, second; wk, week; yr, year.
[image:3.594.57.367.41.444.2] [image:3.594.340.495.520.674.2]ces are shown in Fig 1E, -F, respectively. An age-dependent pattern is clearly apparent; the percent signal-intensity differ-ences increase as age increases. Although the medians varied significantly among the 3 groups (P⫽.02), statistical differ-ences were only observed between the 2-week and 2-year-old groups for both sensorimotor and visual areas (P⬍.05) after correcting for multiple comparisons.
Cortical rfc
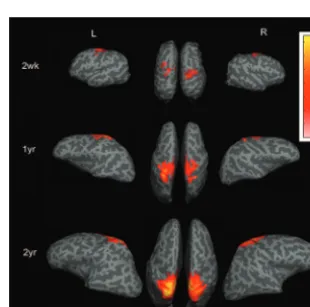
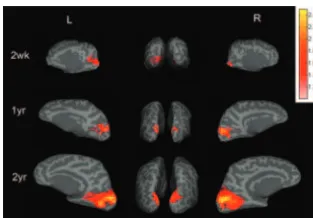
Rfc in the sensorimotor area for all 3 age groups, respectively, by using a TR⫽2 seconds is shown in Fig 2. Regions showing high temporal correlation are located in the primary sensorimotor area for all 3 groups. In addition, both the area and the strength (z-scores) increase as a function of age. Similar findings are also observed in the visual area (Fig 3) for the 3 age groups.
Quantitative Comparisons
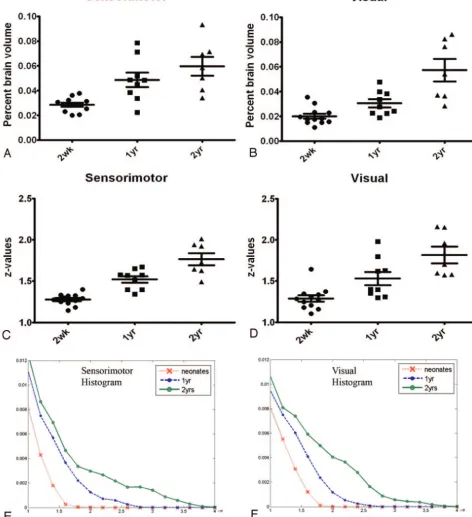
Quantitative comparisons of the normalized brain volumes of cortical connectivity (defined as the brain volume exhibiting cor-tical connectivity divided by the ICV) and the meanz-score val-ues in regions exhibiting temporal correlation are shown in Fig 4. In the sensorimotor area (Fig 4A), both the 1- (P⬍.05) and 2-year-old (P⬍.001) groups exhibit significantly larger percent brain volumes than the 2-week-old group, whereas no differences are observed between the 1- and 2-year-old groups. In contrast, no differences are observed between 2 weeks and 1 year in the visual area, whereas the visual areas of both 2-week (P⬍.001) and 1-year (P⬍.01) groups are significantly smaller than those of the 2-year-old group (Fig 4B). A pairedttest between the senso-rimotor and visual areas in each age group revealed that the per-cent brain volume of cortical connectivity in the sensorimotor area is significantly larger than that in the visual area for both the 2-week (P⫽.008) and 1-year-old groups (P⫽.017) but not for the 2-year-old group.
Significant differences of thez-score values among all 3 age groups were observed in the sensorimotor area (P⬍.001 for 2 weeks versus 1 year and 2 weeks versus 2 years;P⬍.01 for 1 year versus 2 years); the 2-week-old group had the lowestz -score values, followed by the 1- and 2-year-old groups, sug-gesting that the “strength” of cortical connectivity increases with age (Fig 4C). In contrast, although significant differences were also observed for the visual area, the 2-week-old group was highly significantly lower than the 2-year-old group (P⬍ .001) in this area, whereas the differences between 1 year ver-sus 2 years and 2 weeks verver-sus 1 year were smaller (P⬍.05)
(Fig 4D). A pairedttest revealed no differences between the sensorimotor and visual areas for each age group, suggesting that the growth trajectory of the strength of cortical connec-tivity is similar between the visual and sensorimotor areas. Finally, the distributions ofz-scores for all 3 age groups, re-spectively, in the sensorimotor and visual areas are shown in Fig 4E, -F. Notice the population toward higherz-score values continues to increase from 2 weeks to 2 years in the sensori-motor area, whereas this increase is more subtle between the 2-week and 1-year-old groups and is followed by a marked increase between the 1- and 2-year-old groups in the visual area, consistent with that shown in Fig 4C, -D.
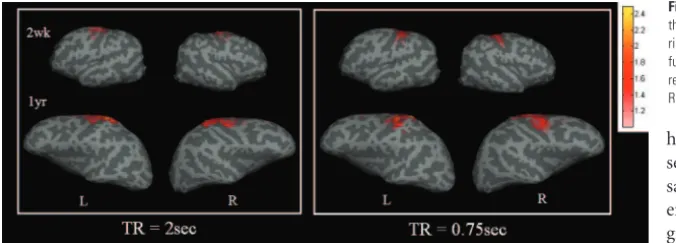
A comparison of the results obtained by using TR⫽2 seconds (left panel) and 0.75 seconds (right panel) at the sensorimotor area is shown in Fig 5, to determine whether the choice of TR affects rfcMRI. The results are comparable between the 2 TRs, suggesting that the effects of TR may be minimal.
Discussion
Although MR imaging has been widely used to gain insights into early brain development, most of the studies to date have focused on structural instead of functional development,14,15
particularly in the very young age population (ie,⬍2 years in our study). This lack of focus on functional development may not be surprising because fMRI requires subjects to fol-low specific instructions; complying with these is difficult for young pediatric subjects. In contrast, rfcMRI acquires im-ages while subjects are at a resting condition and/or asleep. Therefore, rfcMRI serves as an idea tool potentially to assess brain functional development in very young and healthy pe-diatric subjects. This study proposed to address the following: 1) whether rfc exists in young and healthy children at 2 weeks, 1 year, and 2 years of age; and 2) if so, how does it depend on age? Our findings demonstrate that rfc exists as early as 2 weeks of age in both the sensorimotor and visual cortices. This finding is similar to that reported by Fransson et al,16in which
infants born at a low gestational age (⬃25 weeks) were imaged at a term-equivalent age. Another major finding in our study is that the percent brain tissue exhibiting rfc and thez-score values are highly age-dependent in both the sensorimotor and visual areas.
Although these results are encouraging and demonstrate that rfcMRI may be an invaluable tool for the investigation of rfc during early brain development, definitive interpretation of these results may be hampered by the lack of understanding of the exact underlying physiologic origins contributing to the observed temporal correlation among functionally similar cortical areas. Some have questioned whether rfcMRI truly reflects physiologically related information or is a conse-quence of imaging artifacts.17,18Particularly, the typically slow
sampling rate makes rfcMRI vulnerable to temporal aliasing originating from cardiac and respiratory effects. Lowe et al3
compared rfcMRI by using 2 different TRs: 134 ms versus 2 seconds, in which the shorter TR should eliminate aliasing effects attributed to both cardiac and respiratory causes, whereas results obtained by using TR⫽2 seconds (similar to those in our study) could potentially be contaminated by alias-ing artifacts. Although the specificity was lower with TR⫽2 seconds when compared with that obtained by using TR⫽134 ms, similar rfc was observed between the 2 TRs. Similar find-Fig 3.The averaged group results demonstrate the brain regions exhibiting rfc when the
[image:4.594.91.248.41.150.2]ings were also reported by Kiviniemi et al.19These findings
are consistent with our observation that rfcMRI results are similar between TR⫽2 seconds and TR⫽0.75 seconds (Fig 5). Therefore, although cardiac and respiratory components could potentially affect the performance of rfcMRI, rfcMRI most likely provides insight into rfc rather than imaging artifacts.
Although one can rule out imaging artifacts as one of the explanations for rfcMRI, the underlying physiologic origins contributing to rfcMRI remain under extensive scrutiny. One of the most popular hypotheses is that rfcMRI is directly
re-lated to fluctuations of capillary blood flow and oxygen me-tabolism, which indirectly link rfcMRI to neuronal activities. Biswal et al1demonstrated that regions exhibiting high tem-poral correlation are similar to those obtained by using task-activated fMRI. Cordes et al20further compared the results of
rfcMRI and fMRI in multiple cortical areas and observed spatial similarity between rfcMRI and fMRI, though there was not one-to-one correspondence. In a different study, Biswal et al2used experimental hypercapnia and reported that the
[image:5.594.57.530.55.572.2]capnia. They also pointed out that MR imaging revealed low-frequency BOLD fluctuation resembling spontaneous flow fluctuation using laser-Doppler flowmetry. Peltier and Noll21 reported that the normalized signal-intensity changes of rfc-MRI linearly depend on TE. Wise et al22further demonstrated
a significant correlation between low-frequency fluctuation and spontaneous fluctuations of arterial partial pressure of carbon dioxide in volunteers at rest.
More recently, several lines of evidence further demon-strated the potential links between rfcMRI and neuronal ac-tivity.23-26Leopold et al23examined fluctuations in the
band-limited power of local field potential in the visual cortex of monkeys during different behavioral states. Although the band-limited power exhibited fluctuations at several different time scales, they reported a particularly large amplitude at very low frequencies,⬍0.1 Hz, similar to the frequency range in rfcMRI. In addition, these fluctuations exhibited a high tem-poral correlation among the electrode pairs, suggesting the existence of spatial coherence among these local field potential fluctuations. Simultaneous rfcMRI and electroencephalogra-phy (EEG) recording have been conducted by several investi-gators.23-26Although there are some discrepancies regarding
regions of the brain correlated with the EEG signal intensity, all of the studies consistently demonstrated a negative corre-lation between BOLD signal-intensity fluctuation and the␣ power. All of the previously reported results strongly support the potential links between rfcMRI and neuronal activity, un-derscoring the importance of rfcMRI in the study of rfc.
In our study, we observed rfc in all age groups, suggesting that rfc exists as early as 2 weeks after birth. In addition, the rfc appears to increase with age, including an increase in the per-cent brain volume as well as thez-score from 2 weeks to 2 years of age. Specifically, an age-dependent increase in percent brain volume exhibiting high temporal correlation was observed in both sensorimotor and visual areas, though the trajectories appeared to differ between the 2 areas. A progressive/linear increase in percent brain volume from 2 weeks to 2 years of age was observed in the sensorimotor area (Fig 4A); the 2-week-old group exhibited a significantly smaller volume of resting cortical connectivity than the 1- and 2-year-old groups, whereas no differences were observed between the 1- and 2-year-old groups, suggesting a striking increase in percent brain volume from 2 weeks to 1 year. In contrast, the percent brain volume in the visual area is similar between the 2-week and 1-year (P⬎.05) groups, followed by a marked elevation from 1 year to 2 years, suggesting that the major increase in percent brain volume of the visual area occurs between 1 and 2 years of age (Fig 4B). A pairedttest comparing percent brain volume
ex-hibiting resting connectivity between the sensorimotor and visual areas at the same age indicated a significant differ-ence for both 2-week and 1-year-old groups, whereas no differences were ob-served in the 2-year-old group; the per-cent brain volumes in the sensorimotor area are significantly larger than those in the visual area in both the 2-week (P⫽ .008) and 1-year-old (P⫽.017) groups. Together, these find-ings suggest that the development of rfc in the sensorimotor area may predate that in the visual area.
One immediate follow-up question to the above findings is whether the strength of resting cortical connectivity (z-score values) also follows a temporal pattern similar to that of per-cent brain volume. Significant differences in thez-score values were observed in both the sensorimotor and visual areas for all 3 groups; the strength of resting cortical connectivity contin-ued to improve from 2 weeks to 2 years in both the sensori-motor and visual areas (Fig 4C, -D). However, although the significant levels were higher in the sensorimotor than that in the visual areas, the temporal increase ofz-score appeared to be more linear in both sensorimotor and visual areas. As a result, the pairedttest of thez-score values at the same age exhibited no differences between the sensorimotor and visual areas. Therefore, these findings suggest that there may be a disassociation between volume and strengths of cortical con-nectivity in which a large percent brain volume exhibiting rest-ing cortical connectivity does not necessarily translate to a stronger connection (a higherz-score).
Although the exact physiologic underpinnings are poorly un-derstood to account for the observed discrepancies in the trajec-tories of sensorimotor and visual resting cortical connectivity from 2 weeks to 2 years, Chugani et al27reported that the most
prominent area of metabolic activity in the cerebral cortex is the primary sensorimotor area in infants on the basis of the measure-ments of local cerebral metabolic rates for glucose (ICMRGlc). The ICMRGlc at the sensorimotor area is approximately 93% and 125% of that in adults at 0 –1 year and 1–2 years, respectively. In contrast, ICMRGlc at the occipital cortex is approximately 76% and 113% of the adults at 0 –1 year and 1–2 years, respec-tively, suggesting the temporal differences in glucose use between the sensorimotor and visual areas. Therefore, it appears that our results are consistent with those reported using ICMRGlc. Nev-ertheless, more systematic studies will be required to further elu-cidate the links between the alteration of glucose use and rfcMRI in the developing brain.
[image:6.594.53.391.43.164.2]TR may increase the likelihood of being contaminated by cardiac and respiratory components, one needs a section thickness of 4 mm. In addition, because coregistration was used between rfc-MRI and anatomic images, an isotropic resolution would provide a more accurate coregistration than a nonisotropic resolution. Therefore, we have elected to use a resolution of 4⫻4⫻4 mm3
in our studies. This limitation can potentially be alleviated by using parallel imaging approaches in the future.28,29Second, the
preselection of the regions of interest for obtaining reference function could potentially introduce biases.
Alternatively, a spatially independent component analysis approach16,30-32can be used to provide brain regions
exhibit-ing temporal correlation. Specifically, Fransson et al16used the independent-component-analysis approach and imaged pre-term infants at a pre-term-equivalent age. In addition to depicting the sensorimotor and visual network, they identified 3 addi-tional networks in their studies, including the superior and posterior parts of the temporal cortex and the inferior parietal cortex, bilateral superior parietal cortex, and dorsolateral sec-tion of the prefrontal cortex. Although their findings are of critical importance, the lack of behavioral data makes it diffi-cult to conclusively interpret the implication of these 3 net-works. In addition, because the subjects in their studies were born at an extremely low gestational age, more studies will be needed with full-term healthy infants and a larger sample size. Finally, although several lines of evidence have suggested that both fMRI and rfcMRI can still be observed during a sleep condition,33-36it is unclear how a varying degree of sleep states
may affect rfcMRI, because this was not monitored in our study. With visual evoked potential (VEP) in full-term neo-nates, Apkarian et al37reported that behavioral states (quiet
sleep, active sleep, quiet wakefulness, and active wakefulness) would affect the VEP. Nevertheless, the major differences were between awake and sleeping states. Therefore, although a vary-ing degree of sleep states among subjects may affect our re-sults, it should not alter the overall findings of our studies.
Conclusions
RfcMRI was used to delineate the development of rfc in healthy pediatric subjects from 2 weeks to 2 years of age. Our results demonstrate that rfcMRI is capable of consistently re-vealing rfc in both sensorimotor and visual cortices across all subjects. In addition, the percent brain volume exhibiting rfc increases as a function of age, though the trajectories differ between sensorimotor and visual areas. These results highlight the temporal and spatial dynamic of the development of rfc from 2 weeks to 2 years of age.
References
1. Biswal BB, Van Kylen J, Hyde JS.Simultaneous assessment of flow and BOLD signals in resting-state functional connectivity maps.NMR Biomed1997;10: 165–70
2. Biswal B, Hudetz AG, Yetkin FZ, et al.Hypercapnia reversibly suppresses low-frequency fluctuations in the human motor cortex during rest using echo-planar MRI.J Cereb Blood Flow Metab1997;17:301– 08
3. Lowe MJ, Mock BJ, Sorenson JA.Functional connectivity in single and multi-slice echoplanar imaging using resting-state fluctuations.Neuroimage1998; 7:119 –32
4. Lowe MJ, Dzemidzic M, Lurito JT, et al.Correlations in low-frequency BOLD fluctuations reflect cortico-cortical connections.Neuroimage2000;12:582– 87 5. Fair DA, Schlaggar BL, Cohen AL, et al.A method for using blocked and event-related fMRI data to study “resting state” functional connectivity.Neuroimage
2007;35:396 – 405
6. Greicius MD, Krasnow B, Reiss AL, et al.Functional connectivity in the resting brain: a network analysis of the default mode hypothesis.Proc Natl Acad Sci U S A2003;100:253–58
7. Cherkassky VL, Kana RK, Keller TA, et al.Functional connectivity in a baseline resting-state network in autism.Neuroreport2006;17:1687–90
8. Liang M, Zhou Y, Jiang T, et al.Widespread functional disconnectivity in schizophrenia with resting-state functional magnetic resonance imaging.
Neuroreport2006;17:209 –13
9. Tian L, Jiang T, Wang Y, et al.Altered resting-state functional connectivity patterns of anterior cingulate cortex in adolescents with attention deficit hyperactivity disorder.Neurosci Lett2006;400:39 – 43
10. Wang K, Liang M, Wang L, et al.Altered functional connectivity in early Alz-heimer’s disease: a resting-state fMRI study.Hum Brain Mapp2007;28:967–78 11. Gilmore JH, Lin W, Prastawa MW, et al.Regional gray matter growth, sexual dimorphism, and cerebral asymmetry in the neonatal brain.J Neurosci
2007;27:1255– 60
12. Woods RP, Grafton ST, Holmes CJ, et al.Automated image registration: I. General methods and intrasubject, intramodality validation.J Comput Assist Tomogr1998;22:139 –52
13. Woods RP, Grafton ST, Watson JD, et al.Automated image registration: II. Intersubject validation of linear and nonlinear models.J Comput Assist Tomogr1998;22:153– 65
14. Evans AC.The NIH MRI study of normal brain development.Neuroimage
2006;30:184 –202
15. Almli CR, Rivkin MJ, McKinstry RC.The NIH MRI study of normal brain development (Objective-2): newborns, infants, toddlers, and preschoolers.
Neuroimage2007;35:308 –25. Epub 2007 Jan 18
16. Fransson P, Skiold B, Horsch S, et al.Resting-state networks in the infant brain.
Proc Natl Acad Sci U S A2007;104:15531–36
17. Frank LR, Buxton RB, Wong EC.Estimation of respiration-induced noise fluc-tuations from undersampled multislice fMRI data.Magn Reson Med2001;45: 635– 44
18. Lund TE.rfcMRI–mapping functional connectivity or correlating cardiac-induced noise?Magn Reson Med2001;46:628 –29
19. Kiviniemi V, Ruohonen J, Tervonen O.Separation of physiological very low frequency fluctuation from aliasing by switched sampling interval fMRI scans.Magn Reson Imaging2005;23:41– 46
20. Cordes D, Haughton VM, Arfanakis K, et al.Mapping functionally related regions of brain with functional connectivity MR imaging.AJNR Am J Neuro-radiol2000;21:1636 – 44
21. Peltier SJ, Noll DC.T(2)(*) dependence of low frequency functional connec-tivity.Neuroimage2002;16:985–92
22. Wise RG, Ide K, Poulin MJ, et al.Resting fluctuations in arterial carbon diox-ide induce significant low frequency variations in BOLD signal.Neuroimage
2004;21:1652– 64
23. Leopold DA, Murayama Y, Logothetis NK.Very slow activity fluctuations in monkey visual cortex: implications for functional brain imaging.Cereb Cortex
2003;13:422–33
24. Moosmann M, Ritter P, Krastel I, et al.Correlates of alpha rhythm in func-tional magnetic resonance imaging and near infrared spectroscopy. Neuro-image2003;20:145–58
25. Goldman RI, Stern JM, Engel J Jr, et al.Simultaneous EEG and fMRI of the alpha rhythm.Neuroreport2002;13:2487–92
26. Laufs H, Kleinschmidt A, Beyerle A, et al.EEG-correlated fMRI of human alpha activity.Neuroimage2003;19:1463–76
27. Chugani HT, Phelps ME, Mazziotta JC.Positron emission tomography study of human brain functional development.Ann Neurol1987;22:487–97 28. Sodickson DK, Griswold MA, Jakob PM.SMASH imaging.Magn Reson Imaging
Clin N Am1999;7:237–54, vii-viii
29. Bammer R, Schoenberg SO.Current concepts and advances in clinical parallel magnetic resonance imaging.Top Magn Reson Imaging2004;15:129 –58 30. Beckmann CF, DeLuca M, Devlin JT, et al.Investigations into resting-state
connectivity using independent component analysis.Philos Trans R Soc Lond B Biol Sci2005;360:1001–13
31. Greicius MD, Flores BH, Menon V, et al.Resting-state functional connectivity in major depression: abnormally increased contributions from subgenual cingulate cortex and thalamus.Biol Psychiatry2007;62:429 –37
32. Ma L, Wang B, Chen X, et al.Detecting functional connectivity in the resting brain: a comparison between ICA and CCA.Magn Reson Imaging2007;25:47–56 33. Born AP, Law I, Lund TE, et al.Cortical deactivation induced by visual
stim-ulation in human slow-wave sleep.Neuroimage2002;17:1325–35
34. Born AP, Miranda MJ, Rostrup E, et al.Functional magnetic resonance imag-ing of the normal and abnormal visual system in early life.Neuropediatrics
2000;31:24 –32
35. Born AP, Rostrup E, Miranda MJ, et al.Visual cortex reactivity in sedated children examined with perfusion MRI (FAIR).Magn Reson Imaging2002;20:199 –205 36. Horovitz SG, Fukunaga M, de Zwart JA, et al.Low frequency BOLD
fluctua-tions during resting wakefulness and light sleep: a simultaneous EEG-fMRI study.Hum Brain Mapp2008;29:671– 82