Improving crop yield, N uptake and economic returns
by intercropping barley or canola with pea
Sukhdev S. Malhi
Agriculture and Agri-Food Canada, Melfort, Canada; [email protected]
Received 5 September 2012; revised 22 October 2012; accepted 19 November 2012
ABSTRACT
Two field experiments were conducted from 2009 to 2011 on a Gray Luvisol (Typic Haplocryalf) loam at Star City, Saskatchewan, Canada, to de- termine the effectiveness of intercropping bar- ley or canola with pea in improving crop yield, total N uptake, seed quality, Land Equivalency Ratio (LER) and economic returns compared to barley, canola or pea grown as monocultures. Average seed yields of barley-pea or canola-pea intercrops were usually greater than those of barley, canola or pea as sole crops. In intercrops, application of N fertilizer increased seed yield of barley or canola but had only slight beneficial effect on the combined seed yield of both crops together. The LER values for intercrops were us- ually much greater than 1, suggesting less land requirements of intercropping systems than mo- noculture for the same seed yield. Net returns were lowest for barley as sole crop. Without ap- plied N, net returns were slightly lower for bar- ley-pea intercrop and slightly greater for ca- nola-pea intercrop than pea as a sole crop. Ge- nerally, protein concentration in canola or barley seed was higher and oil concentration in canola seed was lower in intercrop combinations com- pared to sole crops. Response trends of total N uptake in seed or straw were usually similar to that of seed or straw yield. In conclusion, inter- cropping barley or canola with pea improved yield, N uptake and net returns, suggesting the potential of barley-pea or canola-pea intercrops and pea for organic farming systems.
Keywords:Barley; Canola; Crop yield; Economic returns; Intercrop; N Fertilizer; N Uptake; Oil; Pea; Protein
1. INTRODUCTION
Intercropping refers to growing two or more distinct crops in the same field at the same time. Intercropping,
especially a mix of non-legume and legume crops, can have many benefits. Intercropping adds diversity to the cropping system, resulting in the stability of production by lowering risk of crop failure in barley-pea intercrop- ping [1,2]. Intercropping may reduce input costs by lowering fertilizer and pesticide requirements, and thus increase economic returns for mustard-pea or barley-pea intercrops [3,4], and also improve harvest ability of crops in cereals-pea or cereal-lentil intercrops [5,6]. Intercrop- ping can also lead to extra yield [also called out-yielding (i.e., when the yield produced by an intercrop is greater
than the yield produced by the component crops grown in monoculture on the same total land area)] in cereal- legume [2,3,7-10] or oilseed-legume [3,10] intercropping systems, and grain quality [5,11]. Out-yielding can be calculated by measuring productivity efficiency of inter- crops relative to sole crops by using various methods, such as Area x Time Equivalency Ratio (ATER) [12], Relative Yield Total (RYT) [13] or Land Equivalency Ratio (LER) [14]. However, the LER is most commonly used to make intercrop versus sole crop comparisons, and is defined as the relative land area under sole crops that is required to produce yields equivalent to intercrops.
for optimum yield, produce quality and economic re- turns.
2. MATERIALS AND METHODS
2.1. Field ExperimentationTwo field experiments (Experiment 1 with barley-pea intercrop; Experiment 2 with canola-pea intercrop) were established in 2009 on a Gray Luvisol (Typic Haplocry- alf) loam at Star City, Saskatchewan, Canada. Some cha- racteristics of the soil used in these experiments are pre- sented in Table 1. Soil was low in available N. Precipita-
tion in the growing season (May, June, July and August) from 2009 to 2011, and long-term (30-year) average of precipitation and air temperature in May to August at the nearest Environment Canada Meteorological Station (AAFC Melfort Research Farm) are presented in Table 2.
The amount of precipitation in the growing season over four months from May to August was 226.0 mm, 403.0 mm and 198.0 mm, in 2009, 2010, and 2011, respectively. The precipitation for the 30-year average at the nearest meteorological station (Melfort) was 243.7 mm. In 2009, the growing season precipitation (GSP) was near long- term average, with slightly lower than average precipita- tion in May and slightly higher than average precipita- tion in August. In 2010, the GSP was much higher than average (especially in June, and also in April prior to spring), and relatively cooler air temperatures in most
summer. In 2011, the GSP was below average (especially in May during seeding season and in August during seed formation/filling), with relatively cooler air temperatures and wet conditions in June, and relatively warmer/hotter air temperatures and dry moisture conditions in late July and August.
[image:2.595.57.539.449.539.2]In both experiments, there were 10 treatments, where barley and pea (Experiment 1), or canola and pea (Ex- periment 2) were grown as monocrops and in combina- tions, and N fertilizer at 0, 40 and 80 kg·N·ha–1 was ap- plied to monocrops barley and canola and their combina- tion with pea. In Experiment 1, the treatments were: 1) barley, 0 kg·N·ha–1, 2) barley, 40 kg·N·ha–1, 3) barley, 80 kg·N·ha–1, 4) pea, 0 kg·N·ha–1, 5) barley-pea in alternate rows, 0 kg·N·ha–1, 6) barley-pea in alternate rows, 20 kg·N·ha–1 to only barley, 7) barley-pea in alternate rows, 40 kg·N·ha–1 to only barley, 8) barley-pea in same row, 0 kg·N·ha–1, 9) barley-pea in same row, 20 kg·N·ha–1, and 10. barley-pea in same row, 40 kg·N·ha–1. In Experiment 2, the treatments were: 1) canola, 0 kg·N·ha–1, 2) canola, 40 kg·N·ha–1, 3) canola, 80 kg·N·ha–1, 4) pea, 0 kg·N·ha–1, 5) canola-pea in alternate rows, 0 kg·N·ha–1, 6) ca- nola-pea in alternate rows, 20 kg·N·ha–1 to only canola, 7) canola-pea in alternate rows, 40 kg·N·ha–1 to only canola, 8) canola-pea in same row, 0 kg·N·ha–1, 9) canola-pea in same row, 20 kg·N·ha–1, and 10) canola-pea in same row, 40 kg·N·ha–1. In the two experiments, canola and barley were rotated in alternate years. Each treatment was
Table 1. Some characteristics of soil in spring 2009 at initiation of field experiments at Star City in northeastern Saskatchewan.
Site Soil Great GroupZ Depth (cm) Texture Matter (%)Organic (1:2 water)pH (mg·kgNitrate-N–1) Extractable P (mg·kg–1) Sulphate-S (mg·kg–1) Extractable K(mg·kg–1)
Star City Gray Luvisol 0 - 15 Loam 3.1 6.6 7.5 13.9 4.5 202
15 - 30 2.4 9.6 2.3 146
30 - 60 3.0 7.8 1.6 180
[image:2.595.57.538.587.721.2]ZBased on Canadian Soil Classification System.
Table 2. Growing season monthly and total precipitation in 2009 to 2011 growing seasons, and average 30-yr average precipitation
and temperature at Star City in northeastern Saskatchewan.
Precipitation in the growing season (mm)z
Month
Star City 30-yr average (Melfort Research Farm)
2009 2010 2011 Precipitation (mm) Temperature (˚C)
May 21.2 66.6 10.5 45.6 9.1
June 46.6 113.2 103.5 65.8 16.9
July 75.6 63.6 73.3 75.5 18.3
August 81.6 56.8 10.7 56.8 19.6
Total 225.0 300.2 198.0 243.7
zA
replicated four times in a randomized complete block de- sign. Each experimental unit (plot) was 1.8 m × 7.5 m. All plots received blanket applications of P, K and S fer- tilizers. The crops were seeded in rows 17.8 cm apart, with 10 rows per plot. In the barley-pea intercrop Expe- riment 1, no herbicide was applied and weeds were con- trolled manually by hoeing whenever needed. In the ca- nola-pea intercrop Experiment 2, herbicide Solo (a.i., imazamox) was applied to control annual weeds in both canola and pea. We did not observe any visual symptoms of disease in any crop, so no fungicide was applied. At maturity, the crop was harvested with a combine for seed yield. Plant samples were also harvested for biomass and straw yield. Seed and straw samples were analysed for total N concentration [22] to calculate N uptake.
2.2. Land Equivalency Ratio
To compare crop growth/yield in intercrops relative to the respective sole crops, LER was calculated by using formula [LER = (Intercrop1/Sole Crop1) + Intercrop2/ Sole Crop2)] of Szumigalski and Van Acker [14]. The LER value greater than 1 indicated out-yielding with in- tercropping (i.e., greater production and lower land re-
quirement with intercropping compared to sole crops). On the other hand, the LER value less than 1 suggested under-yielding with intercropping (i.e., lower producti-
vity and greater land requirement with intercropping than the sole crops).
2.3. Statistical Analysis
The various treatments were applied to the same plots every year over three years to include any residual cu- mulative effects of the treatments over time. In addition,
the response trends of crops to various treatments were generally similar in all three years. Because of these rea- sons, the data for each parameter in each experimental unit were averaged over three years [23], and then these calculated means were subjected to analysis of variance (ANOVA) using procedures as outlined in SAS [24]. Significant (p ≤ 0.05) differences between treatments were determined using least significant difference (LSD0.05). The LSD and standard error of the mean (SEM), along with significance for different parameters are presented in the various tables.
3. RESULTS
3.1. Barley-Pea Intercrop (Experiment 1)
3.1.1. Yield, Land Equivalency Ratio and N Uptake
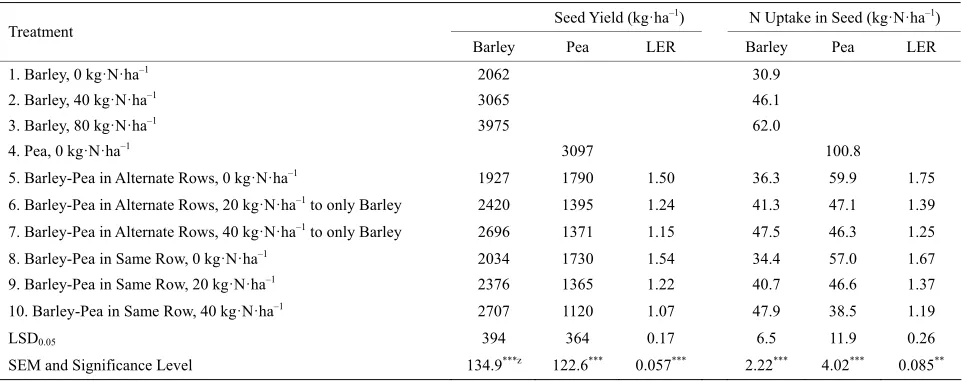
Seed yield of barley as sole crop increased substan- tially with application of N, and also increased signifi- cantly in both intercrop combinations (Table 3). Seed
yield of pea decreased with increasing N fertilizer appli- cation in both intercrop combinations, and more so seed- ing in the same row intercrop. The LER values for the corresponding N rate treatments in barley-pea intercrop combinations were greater than 1 in all cases. The LER values were highest when no N was applied to intercrops, but decreased with application of N fertilizer at 20 or 40 kg·N·ha–1. Total N uptake in seed for barley and pea as sole crops as well as when sown as intercrop in both combinations showed trends similar to seed yield (Table 3). The LER values for total N uptake in seed also
[image:3.595.58.539.532.723.2]showed patterns similar to LER for seed yield, but the actual LER values were usually greater for total N uptake in seed than for seed yield.
Table 3. Seed yield, N uptake of seed and land equivalency ratio (LER)for barley and pea, grown as sole crops or in various
inter-crop combinations at Star City, Saskatchewan (average of 2009 to 2011, Experiment 1).
Seed Yield (kg·ha–1) N Uptake in Seed (kg·N·ha–1)
Treatment
Barley Pea LER Barley Pea LER
1. Barley, 0 kg·N·ha–1 2062 30.9
2. Barley, 40 kg·N·ha–1 3065 46.1
3. Barley, 80 kg·N·ha–1 3975 62.0
4. Pea, 0 kg·N·ha–1 3097 100.8
5. Barley-Pea in Alternate Rows, 0 kg·N·ha–1 1927 1790 1.50 36.3 59.9 1.75
6. Barley-Pea in Alternate Rows, 20 kg·N·ha–1 to only Barley 2420 1395 1.24 41.3 47.1 1.39
7. Barley-Pea in Alternate Rows, 40 kg·N·ha–1 to only Barley 2696 1371 1.15 47.5 46.3 1.25
8. Barley-Pea in Same Row, 0 kg·N·ha–1 2034 1730 1.54 34.4 57.0 1.67
9. Barley-Pea in Same Row, 20 kg·N·ha–1 2376 1365 1.22 40.7 46.6 1.37
10. Barley-Pea in Same Row, 40 kg·N·ha–1 2707 1120 1.07 47.9 38.5 1.19
LSD0.05 394 364 0.17 6.5 11.9 0.26
SEM and Significance Level 134.9***z 122.6*** 0.057*** 2.22*** 4.02*** 0.085**
z,
The LER values in both barley-pea intercrop combina- tions were greater when sole crop of barley was grown at zero-N rate compared with application of N fertilizer, with the least at 80 kg·N·ha–1 rate (
Table 4). This indi-
cated crop yield would be highest and land requirement would be lowest for barley-pea intercropping, when sole crop is grown without any applied N fertilizer. The LER values were only slightly greater than 1 in many cases when barley received 80 kg·N·ha–1, suggesting decrease in seed yield and increase in land requirement for barley sole crop receiving increasing rate of applied N. For bar- ley as sole crop particularly at 0 and also at 40 kg·N·ha–1 rates, the LER values increased with increasing N rate from 0 to 40 kg·N·ha–1 in both barley-pea intercrop com- binations, with the highest LER values when the bar-
ley-pea intercrop combinations received N fertilizer at 40 kg·N·ha–1. This suggested that seed yield increased and land requirement decreased for barley-pea intercrop with increasing rate of applied N. The LER values for total N uptake in seed also showed response trends similar to LER for seed yield (Table 4).
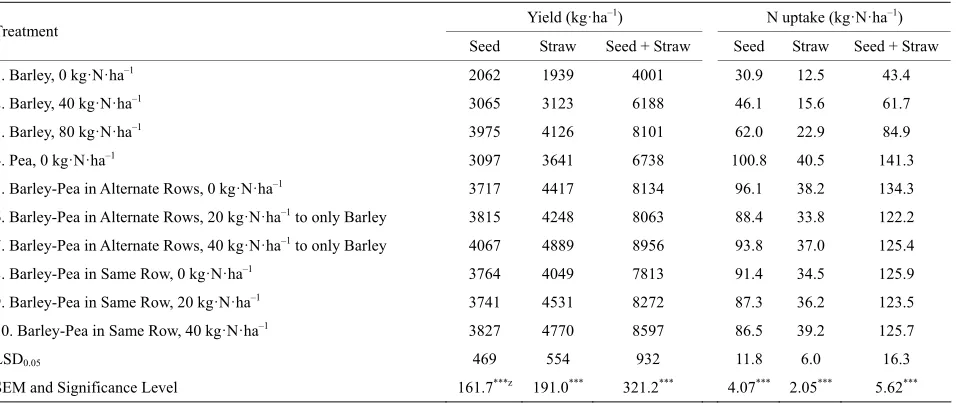
Total of seed and straw yield of barley + pea together in both intercrop combinations increased with applied N, but the increases were much smaller for seed yield than straw yield (Table 5). Seed and straw yield of barley as
sole crop increased considerably with application of N. Seed and straw yield of pea as sole crop was greater than barley as sole crop receiving no N fertilizer for seed yield and 0 and 40 kg·N·ha–1 rates for straw yield, but were lower than both intercrop combinations in all cases.
Table 4. Land equivalency ratio (LER) for barley with or without applied N and pea without applied N grown as sole crops or in
various intercrop combinations at Star City, Saskatchewan (average of 2009 to 2011, Experiment 1).
LER compared to barley at N rates (kg·N·ha–1)
For seed yield For N uptake in seed Treatment
Barley at 0 N
Barley at 40 N
Barley at 80 N
Barley at 0 N
Barley at 40 N
Barley at 80 N
5. Barley-Pea in Alternate Rows, 0 kg·N·ha–1 1.50 1.21 1.06 1.75 1.39 1.17
6. Barley-Pea in Alternate Rows, 20 kg·N·ha–1 to only Barley 1.62 1.24 1.05 1.81 1.39 1.12
7. Barley-Pea in Alternate Rows, 40 kg·N·ha–1 to only Barley 1.85 1.38 1.15 2.09 1.58 1.25
8. Barley-Pea in Same Row, 0 kg·N·ha–1 1.54 1.22 1.06 1.67 1.33 1.10
9. Barley-Pea in Same Row, 20 kg·N·ha–1 1.61 1.22 1.04 1.81 1.37 1.12
10. Barley-Pea in Same Row, 40 kg·N·ha–1 1.80 1.29 1.07 2.03 1.50 1.19
LSD0.05 0.17 0.13 ns 0.17 0.14 0.11
SEM and Significance Level 0.055** z 0.042 0.037ns 0.056*** 0.047* 0.037
[image:4.595.63.541.522.725.2]z,, *, **, *** and ns refer to significant treatment effects in ANOVA at P ≤ 0.1, P ≤ 0.05, P ≤ 0.01, P ≤ 0.001 and not significant, respectively.
Table 5. Yield and N uptake of seed, straw and seed + straw for both crops of barley and/or pea together, grown as sole crops or in various intercrop combinations at Star City, Saskatchewan (average of 2009 to 2011, Experiment 1).
Yield (kg·ha–1) N uptake (kg·N·ha–1)
Treatment
Seed Straw Seed + Straw Seed Straw Seed + Straw
1. Barley, 0 kg·N·ha–1 2062 1939 4001 30.9 12.5 43.4
2. Barley, 40 kg·N·ha–1 3065 3123 6188 46.1 15.6 61.7
3. Barley, 80 kg·N·ha–1 3975 4126 8101 62.0 22.9 84.9
4. Pea, 0 kg·N·ha–1 3097 3641 6738 100.8 40.5 141.3
5. Barley-Pea in Alternate Rows, 0 kg·N·ha–1 3717 4417 8134 96.1 38.2 134.3
6. Barley-Pea in Alternate Rows, 20 kg·N·ha–1 to only Barley 3815 4248 8063 88.4 33.8 122.2
7. Barley-Pea in Alternate Rows, 40 kg·N·ha–1 to only Barley 4067 4889 8956 93.8 37.0 125.4
8. Barley-Pea in Same Row, 0 kg·N·ha–1 3764 4049 7813 91.4 34.5 125.9
9. Barley-Pea in Same Row, 20 kg·N·ha–1 3741 4531 8272 87.3 36.2 123.5
10. Barley-Pea in Same Row, 40 kg·N·ha–1 3827 4770 8597 86.5 39.2 125.7
LSD0.05 469 554 932 11.8 6.0 16.3
Seed + straw yields usually followed trends similar to straw yields. Response trends of total N uptake in straw or seed + straw to various treatments were also similar to corre- sponding straw yield or seed + straw yield (Table 5).
3.1.2. Seed Quality
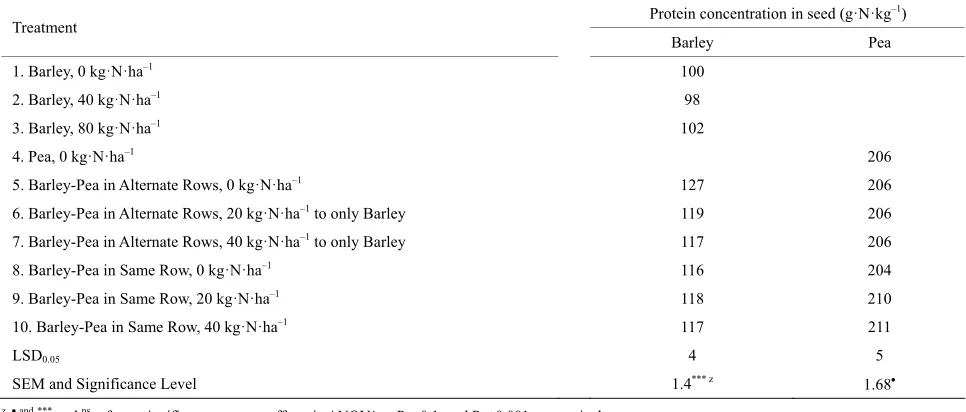
Protein concentration in barley seed was highest when barley was intercropped with pea in alternate rows with- out any applied N (Table 6). Protein concentration in
barley seed tended to decrease with N fertilization in barley-pea intercrop combination in alternate rows, but
no effect on protein concentration in seed when both crops were seeded in the same row. There was no con- sistent effect of any treatment on protein concentration in pea seed.
3.1.3. Economic Returns
Net returns of barley as a sole crop increased substan- tially with application of N, but still were much lower than both barley-pea intercrop combinations in all three crop price scenarios (Table 7). Net returns for barley-pea
[image:5.595.56.539.255.461.2]intercrop without applied N were slightly lower than pea
Table 6. Protein concentration in seed of barley and pea grown as sole crops compared to various combinations of barley and pea
intercrop treatments for similar N rates at Star City, Saskatchewan (average of 2009 to 2011, Experiment 1).
Protein concentration in seed (g·N·kg–1)
Treatment
Barley Pea
1. Barley, 0 kg·N·ha–1 100
2. Barley, 40 kg·N·ha–1 98
3. Barley, 80 kg·N·ha–1 102
4. Pea, 0 kg·N·ha–1 206
5. Barley-Pea in Alternate Rows, 0 kg·N·ha–1 127 206
6. Barley-Pea in Alternate Rows, 20 kg·N·ha–1 to only Barley 119 206
7. Barley-Pea in Alternate Rows, 40 kg·N·ha–1 to only Barley 117 206
8. Barley-Pea in Same Row, 0 kg·N·ha–1 116 204
9. Barley-Pea in Same Row, 20 kg·N·ha–1 118 210
10. Barley-Pea in Same Row, 40 kg·N·ha–1 117 211
LSD0.05 4 5
SEM and Significance Level 1.4*** z 1.68
[image:5.595.56.540.513.726.2]z, and*** and ns refer to significant treatment effects in ANOVA at P ≤ 0.1, and P ≤ 0.001, respectively.
Table 7. Economic returns for barley and pea grown as sole crops, and in various combinations as intercrop in alternate rows and in
same row at low ($100 Mg–1 for barley and $200 ha–1 for pea), medium ($150 Mg–1 for barley and $300 ha–1 for pea) and high ($200
Mg–1 for barley and $400 ha–1 for pea) prices at Star City, Saskatchewan (average of 2009 to 2011, Experiment 1).
Gross returns
($ ha–1) Net returns above N fertilizer costsz ($ ha–1)
Treatment
Low Med High Low Med High
1. Barley, 0 kg·N·ha–1 206 309 412 206 309 412
2. Barley, 40 kg·N·ha–1 307 460 613 247 400 553
3. Barley, 80 kg·N·ha–1 397 596 795 277 476 675
4. Pea, 0 kg·N·ha–1 619 929 1239 619 929 1239
5. Barley -Pea in Alternate Rows, 0 kg·N·ha–1 551 826 1101 551 826 1101
6. Barley -Pea in Alternate Rows, 20 kg·N·ha–1 to only Barley 521 782 1042 491 752 1012
7. Barley -Pea in Alternate Rows, 40 kg·N·ha–1 to only Barley 544 816 1088 484 756 1028
8. Barley -Pea in Same Row, 0 kg·N·ha–1 549 824 1099 549 824 1099
9. Barley -Pea in Same Row, 20 kg·N·ha–1 511 766 1021 481 736 991
10. Barley -Pea in Same Row, 40 kg·N·ha–1 495 742 990 435 682 930
LSD0.05 73 110 147
SEM and Significance Level 25.3*** y 37.9*** 50.6*** 25.3*** 37.9*** 50.6***
zT
as a sole crop. Net returns decreased with N fertilization when the intercrops were seeded in alternate rows and more so in the same row, suggesting that N fertilization to barley-pea intercrops has no net economic benefit, in spite of slight increase in seed yield.
3.2. Canola-Pea Intercrop (Experiment 2)
3.2.1. Yield, Land Equivalency Ratio and N Uptake
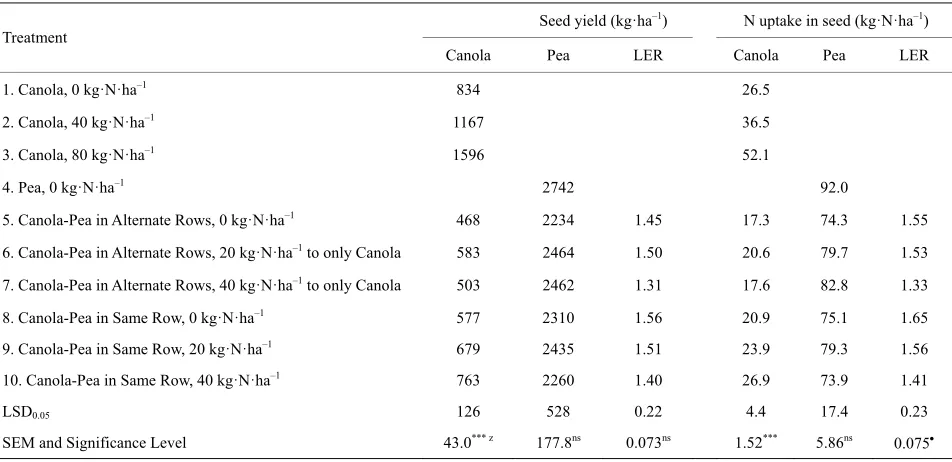
Like barley, seed yield of canola as sole crop also in- creased considerably with application of N (Table 8).
Seed yield of canola in intercrop increased with N fer- tilization, but the increases were small and significant only when both crops were seeded in the same row. There was also small increase (but not significant) in seed yield of pea with application of 20 kg·N·ha–1 in both intercrop combinations. The LER values for the corresponding N rate treatments were much greater than 1 for both intercropping combinations, but tended to de- crease with increasing N rate. Total N uptake in seed for canola and pea as sole crops as well as when sown as intercrop in both combinations showed trends similar to seed yield (Table 8). The LER values for total N uptake
in seed also showed patters similar to LER for seed yield. The LER values in the canola-pea intercrop in both same row and alternative rows combinations were great- er when sole crop of canola was grown at zero-N com- pared to application of N fertilizer, with the lowest LER values at 80 kg·N·ha–1 rate (
Table 9). This indicated the
highest crop yield and lowest land requirement for ca- nola-pea intercrops, when sole crop of canola was grown
without any applied N fertilizer. For all canola as sole crop treatments, the LER values increased with increas- ing N rate in the canola-pea intercrop, especially when seeded in the same row. This suggests the increase in seed yield and decrease in land requirement for ca- nola-pea intercrop with increasing rate of applied N.
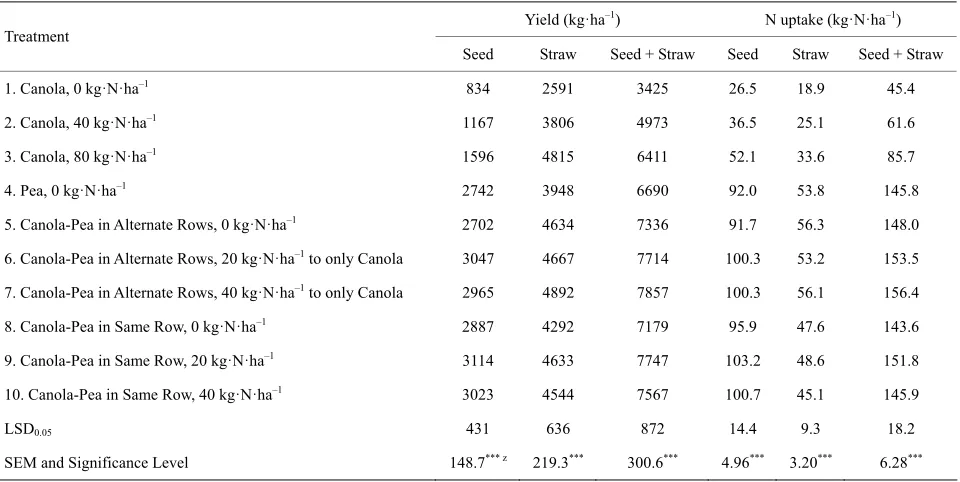
Total of seed or straw yield of canola + pea together tended to increase with applied N in both intercrop com- binations and more so for straw yield (Table 10). Seed
and straw yield of canola as sole crop increased substan- tially with application of N. Seed yield of pea as sole crop (with no N applied) was much greater than canola as sole crop receiving 0 to 80 kg·N·ha–1 rates, but it was similar to canola-pea intercrop in alternate rows and slightly greater than when both were seeded in same row without applied N. Straw yield of pea as sole crop (with no N applied) was much greater than canola as sole crop at only 0 kg·N·ha–1 rate, but it was lower than that of in both intercrop combinations regardless of N application rate. Seed + straw yields usually followed trends similar to straw yields. Response trends of total N uptake in seed, straw or seed + straw to various treatments were similar to corresponding yield of seed, straw or seed + straw (Table 10).
3.2.2. Seed Quality
In treatments without any applied N, protein concen- tration in canola seed was highest when canola was intercropped with pea (Table 11). In the applied N treat-
[image:6.595.61.537.493.724.2]ments, protein concentration in canola seed tended to decrease with N rate in both canola-pea intercrop com-
Table 8. Seed yield, N uptake in seed and land equivalency ratio (LER) for canola or pea, grown as sole crops or in various intercrop combinations at Star City, Saskatchewan (average of 2009 to 2011, Experiment 2).
Seed yield (kg·ha–1) N uptake in seed (kg·N·ha–1)
Treatment
Canola Pea LER Canola Pea LER
1. Canola, 0 kg·N·ha–1 834 26.5
2. Canola, 40 kg·N·ha–1 1167 36.5
3. Canola, 80 kg·N·ha–1 1596 52.1
4. Pea, 0 kg·N·ha–1 2742 92.0
5. Canola-Pea in Alternate Rows, 0 kg·N·ha–1 468 2234 1.45 17.3 74.3 1.55
6. Canola-Pea in Alternate Rows, 20 kg·N·ha–1 to only Canola 583 2464 1.50 20.6 79.7 1.53
7. Canola-Pea in Alternate Rows, 40 kg·N·ha–1 to only Canola 503 2462 1.31 17.6 82.8 1.33
8. Canola-Pea in Same Row, 0 kg·N·ha–1 577 2310 1.56 20.9 75.1 1.65
9. Canola-Pea in Same Row, 20 kg·N·ha–1 679 2435 1.51 23.9 79.3 1.56
10. Canola-Pea in Same Row, 40 kg·N·ha–1 763 2260 1.40 26.9 73.9 1.41
LSD0.05 126 528 0.22 4.4 17.4 0.23
SEM and Significance Level 43.0*** z 177.8ns 0.073ns 1.52*** 5.86ns 0.075
Table 9. Land equivalency ratio (LER) for canola with or without applied N and pea without applied N grown as sole crops or in
various intercrop combinations at Star City, Saskatchewan (average of 2009 to 2011, Experiment 2).
LER compared to canola at N rates (kg·N·ha–1)
For seed yield For N uptake in seed Treatment
Canola at
0 N Canola at 40 N Canola at 80 N Canola at 0 N Canola at 40 N Canola at 80 N
5. Canola-Pea in Alternate Rows, 0 kg·N·ha–1 1.45 1.29 1.19 1.55 1.36 1.21
6. Canola-Pea in Alternate Rows, 20 kg·N·ha–1 to only Canola 1.71 1.50 1.36 1.76 1.53 1.35
7. Canola-Pea in Alternate Rows, 40 kg·N·ha–1 to only Canola 1.62 1.44 1.31 1.67 1.51 1.33
8. Canola-Pea in Same Row, 0 kg·N·ha–1 1.56 1.37 1.24 1.65 1.43 1.25
9. Canola-Pea in Same Row, 20 kg·N·ha–1 1.75 1.51 1.38 1.83 1.56 1.38
10. Canola-Pea in Same Row, 40 kg·N·ha–1 1.84 1.58 1.40 1.92 1.64 1.41
LSD0.05 0.21 0.20 0.21 0.22 0.21 0.21
SEM and Significance Level 0.070* z 0.067 0.071ns 0.073* 0.069 0.071ns
[image:7.595.60.540.350.591.2]z , *, and ns refer to significant treatment effects in ANOVA at P ≤ 0.1, P ≤ 0.05 and not significant, respectively.
Table 10. Yield and N uptake of seed, straw and seed + straw for both crops of canola and/or pea together, grown as sole crops or in
various intercrop combinations at Star City, Saskatchewan (average of 2009 to 2011, Experiment 2).
Yield (kg·ha–1) N uptake (kg·N·ha–1)
Treatment
Seed Straw Seed + Straw Seed Straw Seed + Straw
1. Canola, 0 kg·N·ha–1 834 2591 3425 26.5 18.9 45.4
2. Canola, 40 kg·N·ha–1 1167 3806 4973 36.5 25.1 61.6
3. Canola, 80 kg·N·ha–1 1596 4815 6411 52.1 33.6 85.7
4. Pea, 0 kg·N·ha–1 2742 3948 6690 92.0 53.8 145.8
5. Canola-Pea in Alternate Rows, 0 kg·N·ha–1 2702 4634 7336 91.7 56.3 148.0
6. Canola-Pea in Alternate Rows, 20 kg·N·ha–1 to only Canola 3047 4667 7714 100.3 53.2 153.5
7. Canola-Pea in Alternate Rows, 40 kg·N·ha–1 to only Canola 2965 4892 7857 100.3 56.1 156.4
8. Canola-Pea in Same Row, 0 kg·N·ha–1 2887 4292 7179 95.9 47.6 143.6
9. Canola-Pea in Same Row, 20 kg·N·ha–1 3114 4633 7747 103.2 48.6 151.8
10. Canola-Pea in Same Row, 40 kg·N·ha–1 3023 4544 7567 100.7 45.1 145.9
LSD0.05 431 636 872 14.4 9.3 18.2
SEM and Significance Level 148.7*** z 219.3*** 300.6*** 4.96*** 3.20*** 6.28***
z *** refers to significant treatment effects in ANOVA at P ≤ 0.001.
binations. Protein concentration in pea seed was greater when pea was grown in intercrop compared to pea as sole crop, but there was no additional benefit of N fer- tilization on protein concentration in pea seed in both intercrop combinations. Oil concentration in canola seed was lower in both canola-pea intercrop combinations compared to canola as sole crop, especially when no N was applied to intercrops (Table 11). Oil concentration in
canola seed increased with N fertilization in both ca- nola-pea intercrop combinations.
3.2.3. Economic Returns
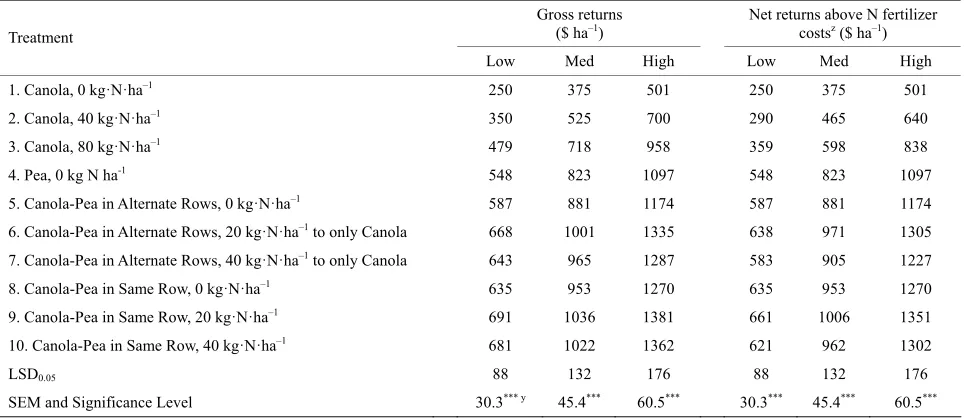
Net returns of canola as sole crop increased dramati- cally with application of N, but these net returns were much lower than that in canola-pea intercrop combina- tions or pea as sole crop (Table 12). Net returns in ca-
Table 11. Protein and oil concentration in seed of canola and pea grown as sole crops compared to various combinations of canola
and pea intercrop treatments for similar N rates at Star City, Saskatchewan (average of 2009 to 2011, Experiment 2).
Protein (g·N·kg–1) Canola
Treatment
Canola Pea Oil (g·N·kg–1)
1. Canola, 0 kg·N·ha–1 199 488
2. Canola, 40 kg·N·ha–1 195 489
3. Canola, 80 kg·N·ha–1 205 484
4. Pea, 0 kg·N·ha–1 172
5. Canola-Pea in Alternate Rows, 0 kg·N·ha–1 234 207 436
6. Canola-Pea in Alternate Rows, 20 kg·N·ha–1 to only Canola 225 201 453
7. Canola-Pea in Alternate Rows, 40 kg·N·ha–1 to only Canola 223 210 455
8. Canola-Pea in Same Row, 0 kg·N·ha–1 232 204 433
9. Canola-Pea in Same Row, 20 kg·N·ha–1 224 203 436
10. Canola-Pea in Same Row, 40 kg·N·ha–1 224 202 451
LSD0.05 8 37 11
SEM and Significance Level 2.8*** z 12.5ns 3.6***
z,*** and ns refer to significant treatment effects in ANOVA at P ≤ 0.001 and not significant, respectively.
Table 12. Economic returns for canola and pea grown as sole crops, and in various combinations as intercrop in alternate rows and in
same row at low ($300 Mg–1 for canola and $200 ha–1 for pea), medium ($450 Mg–1 for canola and $300 ha–1 for pea) and high ($600
Mg–1 for canola and $400 ha–1 for pea) prices at Star City, Saskatchewan (average of 2009 to 2011, Experiment 2).
Gross returns
($ ha–1) Net returns above N fertilizer costsz ($ ha–1)
Treatment
Low Med High Low Med High
1. Canola, 0 kg·N·ha–1 250 375 501 250 375 501
2. Canola, 40 kg·N·ha–1 350 525 700 290 465 640
3. Canola, 80 kg·N·ha–1 479 718 958 359 598 838
4. Pea, 0 kg N ha-1 548 823 1097 548 823 1097
5. Canola-Pea in Alternate Rows, 0 kg·N·ha–1 587 881 1174 587 881 1174
6. Canola-Pea in Alternate Rows, 20 kg·N·ha–1 to only Canola 668 1001 1335 638 971 1305
7. Canola-Pea in Alternate Rows, 40 kg·N·ha–1 to only Canola 643 965 1287 583 905 1227
8. Canola-Pea in Same Row, 0 kg·N·ha–1 635 953 1270 635 953 1270
9. Canola-Pea in Same Row, 20 kg·N·ha–1 691 1036 1381 661 1006 1351
10. Canola-Pea in Same Row, 40 kg·N·ha–1 681 1022 1362 621 962 1302
LSD0.05 88 132 176 88 132 176
SEM and Significance Level 30.3*** y 45.4*** 60.5*** 30.3*** 45.4*** 60.5***
zThe cost of N fertilizer was $1500 mg–1 of N; y*** refers to significant treatment effects in ANOVA at P ≤ 0.001.
creased with application of 20 kg·N·ha–1 and then de- creased beyond this N rate.
4. DISCUSSION
Earlier studies have explored the feasibility of inter- cropping grain legumes with various cereal [4,5,9] or oilseed [10] crops to improve land productivity, eco-
[image:8.595.58.540.411.620.2]quality and N uptake, by providing possible explanations for any varying results from the published literature.
Previous research has established that pea-barley or pea-mustard intercrop produces greater seed yield than pure crops, in spite of the reduction in seed yield of the components [4,25]. This was attributed to a strong com- petition from cereals or oilseeds to pea in mixed inter- cropping [4,26]. Similarly, in our study barley or canola and pea intercrops produced greater seed yield than sole/pure crops, and seed yield of pea and barley or ca- nola components decreased when grown in intercrop compared to grown as pure crops. Greater biomass pro- duction of intercrops, which in turn produced greater seed production, than sole crops could be possibly due to enhanced light interception because of greater canopy, especially for canola [27,28].
The LER values greater than 1 indicate higher crop yield and lower land requirement with intercropping compared to when barley and pea were grown as sole crops, especially when grown without applied N. The increase in seed yield of canola and decrease in seed yield of pea with application of N fertilizer compared to zero-N treatment could be most likely due to higher level of nitrate-N in soil which has been observed to favour competition of non-legume canola over legume pea [26, 29-31].
In our study, seed yields of the component crops in intercrop mixtures were much lower than their corre- sponding sole crop seed yields, but the total land produc- tivity was usually higher in intercrop treatments as evi- denced by higher LER values. For example, the LER values ranged from 1.15 to 1.50 for intercrops in alter- nate rows, and from 1.07 to 1.56 for intercrops in same row. In other words, sole cultivation of each crop would require more land than their cultivation in intercrop mix- ture, suggesting greater land-use efficiency of intercrops ((by 15 to 50% for alternate rows and by 7 to 56% for same row).) than sole crops. Because of different rooting pattern, intercropping legumes with oilseeds or cereals has the potential to improve the use of soil N resource compared to legumes grown as sole crops [2]. Therefore, it is also possible that higher land productivity under intercropping than sole cropping in our study was most likely due to more efficient use of available soil N with intercrops. Also, in our study there was more N uptake with intercrop combinations than sole crops. Similar re- sults were reported previously in intercropping systems for mixed cultures of barley and pea [1,32] or oilseed rape/canola/mustard and pea [3,10]. The higher LER values of intercrops when grown in same row than alter- nate rows indicates that intercropping was superior when root systems of non-legume and legume crops are inter- mixed because of most likely the differences in the use of different sources of N and possibly other nutrients, as
also suggested by Martin and Snaydon [33].
The highest LER values when sole crop of canola was grown at zero-N compared with application of N ferti- lizer indicate greatest crop yield and lowest land require- ment for canola-pea intercropping grown without any applied N fertilizer. This suggests increase in seed yield and decrease in land requirement for canola sole crop receiving increasing rate of applied N. This also suggests large advantage in favour of intercropping/mixed crop- ping, in spite of application of N fertilizer to oilseed or cereal crops. The increased in LER values with increas- ing N rate from 0 to 40 kg·N·ha–1 in both canola-pea intercrop combinations suggests increase in seed yield and decrease in land requirement for canola-pea inter- crop with increasing rate of applied N.
Knudson et al. [34] suggest that interspecies compete-
tion can cause increase in the concentration total N in seed of barley when it is grown as a mixture with pea, due to lack of severe competition for N between the crops. In our study, the protein concentration (or total N) also increased in seed of barley-pea or canola-pea mixed in- tercrops, because more of soil N was available to barley or canola seeds, as pea fixes its own N requirement from the atmosphere.
Our findings suggest that if organic farming has li- mited possibilities for using manure, the inclusion of N-fixing legume grain crops can be introduced in the intercropping systems for preventing N deficiency in or- ganic crops. Our results also show considerably more gain in protein yield with barley-pea or canola-pea inter- crops than pure barley or canola crops, especially when no N fertilizer was applied. In summary, the barley-pea or canola-pea intercrops produced the highest seed yields, while also improving the sustainability of economic re- turns.
5. CONCLUSION
pea for organic farming systems.
6. ACKNOWLEDGEMENTS
The author thanks Western Alfalfa for supplying alfalfa pellets amendment, International Compost Ltd., Calgary, Alberta, for supply-ing rock phosphate fertilizers for this study, and D. Leach, K. Strukoff and P. Boxall for technical help.
REFERENCES
[1] Jensen, E.S. (1996) Grain yield, symbiotic N2 fixation
and interspecific competition for inorganic N in pea-bar- ley intercrops. Plant and Soil, 182, 25-38.
doi:10.1007/BF00010992
[2] Hauggaard-Nielsen, H., Ambus, P. and Jensen, E.S. (2001)
Temporal and spatial distribution of roots and compete- tion for nitrogen in pea-barley intercrops—A field study employing 32P technique. Plant and Soil, 236, 63-74. doi:10.1023/A:1011909414400
[3] Aktar, M.S., Shamsuddin, A.M., Islam, N. and Rahman,
A.R.M.S. (1993) Effects of mixed cropping lentil and mustard at various seeding ratios. Lens, 20, 36-39.
[4] Hauggaard-Nielsen, H. and Jensen, E.S. (2001) Eva-
luating pea and barley cultivars for complementarity in intercropping at different levels of soil N availability.
Field Crops Research, 72, 185-196. doi:10.1016/S0378-4290(01)00176-9
[5] Szczukowski, S. (1989) Yield and seed quality of field
peas grown in mixtures with cereals and in pure stands.
Acta Academiae Agriculturae ac Technicae Olstenensis, Agricultura, 47, 40.
[6] Carr, P.M., Gardner, J.C., Schatz, B.G., Zwinger, S.W. and Guldan, S.J. (1995) Grain yield and weed biomass of a wheat-lentil intercrop. Agronomy Journal, 87, 574-579. doi:10.2134/agronj1995.00021962008700030030x
[7] Paolini, R., Caporali, F. and Campiglia, E. (1993) Yield
response, complementarity and competitive ability of bread wheat and pea in mixtures. Agricoltura Mediterra- nea, 123, 114-121.
[8] Rauber, R., Schmidtke, K. and Kimpel-Freund, H. (2000)
Competition and yield advantage in mixtures of pea (Pisum sativum L.) and oats (Avena sativa L.). Kon- kurrenz und ertragsvorteile in gemengen aus erbsen
(Pisum sativum L.) und hafer (Arena sativa L.), 185,
33-47.
[9] Chalmers, S. and Day, S. (2009) Optimum seeding com-
binations for intercropping peas and canola: An investiga- tion with surprising yields and other final stand effects.
Manitoba Agronomists Conference,Winnipeg.
http://umanitoba.ca/afs/agronomists_conf/proceedings.ht ml
[10] Jetendra, K. and Mishra, J.P. (1999) Influence of planting pattern and fertilizers on yield and yield attributes and nutrient uptake in pea/mustard intercropping system. In- dian Journal of Pulses Research, 12, 38-43.
[11] Zielinska, A. and Rutkowski, M. (1988) Comparison of
productivity of oats, barley and four cultivars of field
peas in pure and mixed sowing. Acta Academiae Agri-
culturae ac Technicae Olstenensis, Agricultura, 46, 113- 124.
[12] Hiebesch, C.K. and McCollum, R.E. (1987) Area x time
equivalency ratio: A method for evaluating the productivity of intercrops. Agronomy Journal, 79, 15-22.
doi:10.2134/agronj1987.00021962007900010004x
[13] de Wit, C.T. and van den Bergh, J.P. (1965) Competition
between herbageplants. Netherlands Journal of Agricul-
tural Science, 13, 212-221.
[14] Szumigalski, A.R. and van Acker, R.C. (2008) Land equi-
valent ratios, light interception, and water use in inter- crops in the presence or absence of in-crop herbicides.
Agronomy Journal, 100, 1145-1154.
doi:10.2134/agronj2006.0343
[15] Poggio, S.L. (2005) Structure of weed communities oc-
curring in monoculture and intercropping of field pea and barley. Agriculture, Ecosystems and Environment, 109, 48-58. doi:10.1016/j.agee.2005.02.019
[16] Helenius, J. (1991) Insect numbers and pest damage in
intercrops vs. monocrops: Concepts and evidence from a
system of faba bean, oats and Rhopalosiphum padi (Ho-
moptera, Aphididae). Journal of Sustainable Agriculture,
1, 57-80.
[17] Paras, N. and Chakravorty, S. (2005) Effect of inter-
cropping on the infestation of chickpea pod borer Heli- coverpa armigera (Hubner). Journal of Plant Protection and Environment, 2, 86-91.
[18] Chen, Y., Zhang, F., Tang, L., Zheng, Y., Li, Y., Christie, P. and Li, L. (2007) Wheat powdery mildew and foliar N concentrations as influenced by N fertilization and be- lowground interactions with intercropped faba bean. Plant and Soil, 291, 1-13. doi:10.1007/s11104-006-9161-9
[19] Danso, S.K.A. and Papastylianou, I. (1992) Evaluation of the nitrogen contribution of legumes to subsequent ce- reals. Journal of Agricultural Science, 119, 13-18. doi:10.1017/S0021859600071495
[20] Izaurralde, R.C., McGill, W.B. and Juma, N.J. (1992) Ni- trogen fixation efficiency, interspecies N transfer, and root growth in barley-field pea intercrop on a Black Chernozemic soil. Biology and Fertility of Soils, 13, 11-
16. doi:10.1007/BF00337231
[21] Hauggaard-Nielsen, H., Andersen, M.K., Jornsgaard, B.
and Jensen, E.S. (2006) Density and relative frequency effects on competitive interactions and resource use in pea-barley intercrops. Field Crops Research, 95, 256-267. doi:10.1016/j.fcr.2005.03.003
[22] Noel, R.J. and Hambleton, L.G. (1976) Collaborative study of a semi-automated method for the determination of crude protein in animal feeds. Journal of Association of Official Analytical Chemists, 59, 134-140.
[23] Snedecor, G.W. and Cochran, W.G. (1967) Statistical
methods. 6th Edition, The Iowa State University Press, Ames.
[24] SAS Institute Inc. (2004) Online documentation for SAS,
version 8.
[25] Banik, P., Sasmal, T., Ghosal, P.K. and Bagchi, D.K. (2000) Evaluation of mustard (Brassica compestris var. Toria) and legume intercropping under 1:1 and 2:1 row-re-
placement series system. Agronomy and Crop Science,
185, 9-14. doi:10.1046/j.1439-037X.2000.00388.x
[26] Anderson, M.K., Hauggaard-Nielsen, H., Ambus, P. and
Jensen, E.S. (2004) Biomass production, symbiotic ni- trogen fixation and inorganic N use in dual and tri-com- ponent annual intercrops. Plant and Soil, 266, 273-287. doi:10.1007/s11104-005-0997-1
[27] Kushwaha, B.L. and De, R. (1987) Studies of resource
use and yield of mustard and chickpea grown in cropping systems. Journal of Agriculture Science (Cambridge),
108, 487-495. doi:10.1017/S0021859600079533
[28] Morris, R.A. and Garrity, D.P. (1993) Resource capture
and utilization in intercropping. Water Field Crops Re- search, 34, 303-317. doi:10.1016/0378-4290(93)90119-8
[29] Francis, C.A. (1989) Biological efficiencies in multiple- cropping systems. Advances in Agronomy, 42, 1-42.
doi:10.1016/S0065-2113(08)60522-2
[30] Cowell, L.E., Bremer, E. and van Kessel, C. (1989) Yield and N-2 fixation of pea and lentil as affected by inter-
cropping and N application. Canadian Journal of Soil
Science, 69, 243-251. doi:10.4141/cjss89-025
[31] Waterer, J.G., Vessey, J.K., Stobbe, E.H. and Soper, R.J. (1994) Yield and symbiotic nitrogen-fixation in a pea mu- stard intercrop as influenced by N fertilizer addition. Soil Biology and Biochemistry, 26, 447-453.
doi:10.1016/0038-0717(94)90176-7
[32] Chen, C., Westcott, M., Neil, K., Wichmann, D. and Knox, M. (2004) Row configuration and nitrogen application for barley-pea intercropping in Montana. Agronomy Journal,
96, 1730-1738. doi:10.2134/agronj2004.1730
[33] Martin, M.P.L.D. and Snaydon, R.W. (1982) Root and
shoot interactions between barley and beans when inter- cropped. Journal of Applied Ecology, 19, 263-272. doi:10.2307/2403009
[34] Knudson, M.T., Hauggaard-Nielsen, H., Jørnsgaard, B.
and Jensen, E.S. (2004) Comparison of interspecific com- petition and N use in pea-barley, faba bean-barley and lu- pin-barley intercrops grown at two temperate locations.
Journal of Agriculture Science, 142, 617-627.