The Effect of Job Readiness Programs on
Criminal Behavior
Jones, Michael
University of Cincinnati
11 October 2017
Online at
https://mpra.ub.uni-muenchen.de/81908/
The Effect of Job Readiness Programs on Criminal Behavior
Michael D. Jones*
October 11, 2017
Keywords: benefit-cost analysis, labor market, crime, program evaluation
Author contact info:
324 Lindner Hall
University of Cincinnati, Department of Economics Cincinnati, OH 4522
513.556.2491
JEL Codes: J08, J18
Abstract:
In this paper, I find that participants in a job-readiness program, Cincinnati Works, in
Cincinnati, Ohio are nine percentage points less likely to be charged with a felony compared to
non-members. Given that 18 percent of non-members are charged with a felony sometime in the
five years after their applications, Cincinnati Works decreases the probability of criminal charges
by 50 percent. Moreover, the reduction in crime is driven by those individuals who were not
previously felons. Cincinnati Works appears to be more effective at keeping individuals out of
the criminal justice system for the first time, compared to reducing the recidivism rate. I find
that the taxpayer benefit per Cincinnati Works participant is between $486 and $1,584 a year,
depending on whether or not the marginal costs of a prison system include employee
compensation. However, because the average cost per participant is $4,669, the program is
1 Introduction
The mission of many nonprofit job training programs is to increase employment
opportunities and earnings for its participants. In evaluating the success and benefit-cost ratio of
these programs, focus is often on increased earnings and job opportunities as the primary benefit
(Heinrich et al., 2009; Lechner and Wunsch, 2009; Hotz et al., 2006). Card, Kluve, and Weber
(2010), analyzed the short-term and long-term effects of nearly 200 separate labor market
programs and found that job search assistance programs were more effective than public sector
employment programs in terms of employment and earnings. However, there are many ancillary
benefits that accrue to an individual as a result of successful employment: improved health,
higher levels of happiness, and even a reduction in the propensity to commit crime (Clark and
Oswald, 1994; Duleep, 1986; Ettner, 1996; Frijters et al., 2005; Schochet et al., 2008). The
evaluation of the Cincinnati Works program contributes to this literature by measuring the
cost-benefit ratio of a particular labor market program’s effect on criminal behavior.
In this paper, I estimate the effect of Cincinnati Works’ services on criminal behavior for
a cohort of individuals in 2008. I use administrative, criminal records to calculate the reduction
in felony charges over a five year period. Because assignment into the program is not random, I
consider the effect of the selection bias on the outcome of interest. Finally, using the estimates
of the reduction in future criminal behavior, I calculate a taxpayer benefit-cost analysis of the
program through Cincinnati Works members avoiding the criminal justice system.
In 2006, Schochet et al. analyzed National Job Corp’s effect on criminal behavior.
Individuals are eligible for the program if they are between the ages of 16 and 24, earn less than
a particular income threshold, and are in need of additional training or education in order to be
youth, because participants often relocate and live on-site to receive these services. Schochet et
al. (2006) found that the program caused a 5.2 percentage point drop, or 16 percent, in the
number of program participants who were either arrested or charged with a crime or criminal
complaint. The drop was slightly higher for those who were never arrested, and lower and
statistically insignificant for those who had been previously arrested. This criminal behavior
was evaluated over a 48 month period – similar to the time period in the Cincinnati Works study.
One of the notable distinctions between the two studies is that the Job Corp evaluation included
any criminal behavior (including misdemeanors); whereas, the Cincinnati Works study focuses
only on felonies. In addition, the Job Corp study relied on self-reported data, in contrast to the
administrative data for the Cincinnati Works evaluation.
In the Job Corp evaluation, the authors also examined the benefit-cost ratio. At nearly
$14,000 per participant, the costs to administer the program were significant. The benefits due to
crime reduction was $1,240 per participant. This calculation was based on self-reported arrests,
convictions, and incarceration rates. In addition, Job Corps participants generated additional
benefits of $2,186 from cost savings due to reduction in social assistance funding. The increase
in earnings as a result of the program was a statistically insignificant amount of $119. The net
loss of the program was calculated at $10,300, the difference between $3,544 in benefits and
$13,844 in costs.
There is also existing literature on the effect of employment and job training programs
that focuses primarily on ex-offenders. Visher et al. (2005) found that in a meta-analysis of eight
studies, there is little, if any, evidence that the programs reduced recidivism among ex-offenders.
The authors examined studies on several well-known programs including: the National
Corps. Among the studies examined by Visher et al., Uggen (2000) found that the NSWD
program, designed for currently unemployed ex-offenders, was not effective overall at reducing
recidivism. In addition, Bloom et al. (1994) found that JPTA did not produce any statistically
significant effect on male youth with previous arrest records.
In this paper, I find that Cincinnati Works members are nine percentage points less likely
to be charged with a felony compared to non-Cincinnati Works members. Given that 18 percent
of non-Cincinnati Works members are charged with a felony sometime in the five years after
their applications, Cincinnati Works decreases the probability of criminal charges by 50 percent.
Moreover, the reduction in crime is driven by those individuals who were not previously felons.
Cincinnati Works appears to be more effective at keeping individuals out of the criminal justice
system for the first time, compared to reducing the recidivism rate. Finally, I find that the lower
bound of taxpayer benefits per Cincinnati Works participant is between $486 and $1,584 a year,
depending on whether or not the marginal costs of a prison system include employee
compensation.
2 Cincinnati Works
Cincinnati Works was founded by David and Liane Phillips in 1996 as a nonprofit
organization to help the chronically unemployed in the Cincinnati area through job readiness
training and continual employment counseling and assistance. The provided services are free of
charge and funded through private donations and public funding, but applicants are required to
attend a week-long job readiness workshop. The job readiness workshop covers topics that
include: completing job applications, business etiquette, employer expectations, budgeting,
Works applicant does not complete the workshop in its entirety, then the individual is not eligible
for membership into the program.
After completing the workshop, Cincinnati Works employees provide job search and job
placement assistance, re-employment services in case of a job loss, and ongoing counseling for
any on-the-job issues. An individual who completes the job readiness workshop is considered a
Cincinnati Works member for life. Members frequently call Cincinnati Works for assistance in
legal matters, child care recommendations, and educational advice. Because over one-half of
Cincinnati Works members suffer from depression or anxiety, members frequently rely on the
organization for behavioral counseling and assistance. Cincinnati Works also has many close
relationships with businesses in the community who understand and support the services that
they provide. As a result of these employer connections, members who utilize job search and
placement services through Cincinnati Works have indicated that they are more likely to be
successful in their job search. In 2013, Cincinnati Works provided data to the author on the
organization’s applicants and members, as well as providing access to interview staff members in
3 Data
Data for the project was provided by the Cincinnati Works administration in 2013. The
CEO of Cincinnati Works provided a list of the names and demographic information of all 867
Cincinnati Works applicants over a year-long period beginning in 2008. This data included the
260 applicants who successfully completed the job readiness workshop and the 607 applicants
who enrolled in the workshop but failed to complete it for any reason. Those applicants who
completed the week-long workshop are considered by the organization as Cincinnati Works
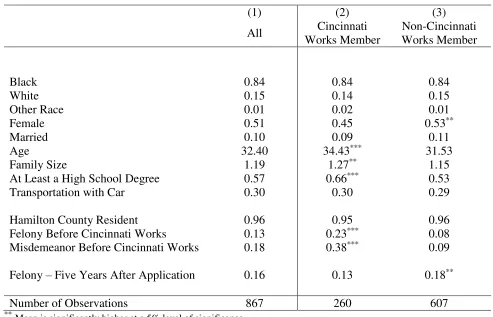
members. Table 1 describes the demographic characteristics of Cincinnati Works members
relative to non-members. The program serves a primarily African-American community as 84%
of both groups identify themselves as Black. Non-members are significantly less likely to be
male, and on average, they are three years younger than members. Members also have larger
family sizes and are more likely to have a high school degree. At 34 years of age, the average
member is 3 years older than a non-member. There is no difference between the two groups on
marriage rates, access to a personal car, and residency in Hamilton County (the county in which
Cincinnati is located). Controlling for these characteristics is important because of the
criminogenic risks associated with them. Age, gender, and previous criminal history are some of
the strongest predictors of future criminal activity under a meta-analysis by Bonta, et al. (1998).
<Insert Table 1 Here>
Criminal data was collected through the Hamilton County Clerk of Courts website. Since
an individual’s criminal history is publicly available, the names and birthdates of each one of the
to the Cincinnati Works application, as well as the criminal history after the application. The
Hamilton County Clerk of Courts provides information on whether or not the individual was
charged with a felony; however, it does not contain consistent information as to whether or not
the individual was incarcerated or any measure of the length of the incarceration. As a result,
only felony charges could be obtained as the outcome of interest in the dataset.
While data on incarceration rates and even conviction rates would be preferable because
of the closer relationship to the direct costs of incarceration, estimating felony charges is still a
reasonable approximation to the actual cost savings of Cincinnati Works so long as the
incarceration rates and conviction rates are similar to the national figures used in the benefit-cost
analysis. Many studies, including ones cited in this paper, use self-reported measures of
incarceration and conviction as the outcomes of interest. It is reasonable to assume that there is
significant bias in self-reported criminal activity between individuals who have gone through an
intensive program compared to those who have not gone through such a program. The use of
administrative data for felony charges in this paper does not eliminate concerns of bias because
the administrative data is not at the national-level, but restricted to Hamilton County. A
persistent difference in the geography of criminal behavior between participants and
non-participants would bias the results.
The criminal history was collected using Amazon.com’s Mechanical Turk service.
Under the Mechanical Turk service, individuals anywhere in the world are paid to complete
small, defined tasks with precise input and output. The dataset of individual names and
birthdates was distributed to multiple Mechanical Turk workers who enter the data into the
Hamilton County Clerk of Courts’ website and record the criminal history. Each Cincinnati
data. If the criminal charge records were identically recorded, then the data was considered
accurate. If at least one Mechanical Turk worker produced a different output, then the record
was manually verified and the correct data was recorded. Because of the costs associated with
hiring Mechanical Turk workers, data was only collected on whether or not a felony occurred.
The Hamilton County sheriff’s office does allow the public to determine if an individual is
incarcerated, but it does not post historical information. Therefore, the collection of actual
incarceration rates was not possible; and the outcome of interest in this paper is limited to felony
charges. However, many of these individuals do go on to prison or jail; and even for those
individuals who are not incarcerated, criminal charges still represent real costs to society and the
individuals themselves.
A felony offense is categorized into one of five classes: first-degree, second-degree,
third-degree, fourth-degree, and fifth-degree. First-degree felonies can carry a prison sentence of
3 to 11 years and a fine of up to $20,000. Examples of first-degree felonies include kidnapping
and rape. Fifth-degree felonies carry 6 to 12 months in prison and a fine of up to $2,500.
Examples of fifth-degree felonies include breaking and entering and vandalism resulting in a
damaged amount less than $7,500. Because employers often ask job applicants about their
criminal history, a felony charge or conviction can present a significant barrier to employment
for many individuals. Ohio also categorizes a misdemeanor offense into one of five classes:
first-degree, second-degree, third-degree, fourth-degree, and minor. First-degree misdemeanors
are the most serious offenses and can carry a maximum fine of $1,000 and/or 180 days in jail.
Examples of first-degree misdemeanors include carrying a gun without a permit and theft of
maximum fine is $150. Examples of minor misdemeanors include disorderly conduct and public
gaming.
The distinction between prison and jail is determined by the administration of the facility.
Jails are operated by local officials. They hold inmates who are awaiting trial or who have been
sentenced for a short period of time, typically less than one year. A person convicted of a
misdemeanor would almost always serve the sentence in a jail. In contrast, prisons are state-run
or federally-run systems and they hold inmates who are sentenced for a longer period of time.
According to the Bureau of Justice Statistics, individuals convicted of a felony are often held in
prisons. However, a nearly identical fraction of felony defendants are sentenced to jail. Because
a felony charge is the outcome of interest in this paper, the calculation of incarceration costs are
based on both prison and jail estimates.
Twenty-three percent of Cincinnati Works members were charged with a felony crime
before enrolling in the program and thirty-eight percent were charged with a misdemeanor.
These figures compare to a nine percent rate of felony charges and eight percent rate of
misdemeanor charges for non-members. Five years after enrolling in the Cincinnati Works
program, only thirteen percent of members were charged with a felony compared to eighteen
percent of non-members. Because being charged with a felony may result in incarceration (thus
making it very difficult to commit future felonies), the felony charge outcome was coded as a
binary variable.
The decision to charge an individual with a felony must be done by the local district
attorney’s office. Police make arrests when they have a good reason, or probable cause, to
believe that a crime has been committed. After examining the arrest report, prosecutors must
charges, they must believe that they can prove a person is guilty of the crime beyond a
reasonable doubt. The data used in this paper is based on filed charges with the Hamilton
County Clerk of Courts. Because prosecutors have prosecutorial discretion, not all arrests result
in charges filed with the court system. Any of the following reasons may cause a prosecutor not
to file charges even if an individual has committed a crime: the prosecutor faces political
pressure to not pursue certain causes, the court system is overburdened with criminal cases, or
the police violated procedures during the arrest (Bergman and Berman 2013). As a result, while
the estimates in this paper reflect the social cost savings from a reduction in incarceration rates, it
likely underestimates the actual amount of criminal activity itself. In addition, there may be
extralegal characteristics such as rage, age, gender, etc. that can affect a prosecutor’s decision on
whether or not to proceed with a charge (Devers 2011). Some studies have shown race can be a
determinant (Johnson 2003; Ulmer and Bradley 2006; Piehl and Bushway 2007), but controls for
race, gender, age, and other demographic characteristics have been included in the estimating
equation.
Because the outcome of interest is felony charges, the discussion of recidivism later in
the paper must also define recidivism as an individual who is charged with a felony within a five
year period. Recidivism is often defined as a person that has been arrested since being released
from prison (Cooper et al., 2014). Under this definition, Cooper et al. examined 30 states
between 2005 and 2010 (including Ohio) and found that 76.6% of former prisoners were arrested
within a five year period. However, recidivism can also be defined as the probability of being
charged, convicted, or incarcerated within 5 years. Using this definition of recidivism, Cooper et
al., found a 60% recidivism rate – a number substantially higher than found in this paper. One
a former prisoner. In contrast, this paper examines felony charges in a five year period for
anyone who had been previously charged with a felony, but not necessarily imprisoned.
4 Empirical Model
The estimating equation for the model is written as follows –
FelonyChargei= β0+CincinnatiWorksiβ1+Demosiβ2+FelonyOppiβ3+CriminalHistoryiβ4+εi (1)
where FelonyCharge is an indicator of whether or not an individual applicant was charged with a
felony during the five year period after applying to Cincinnati Works. The covariate of interest
is the dummy variable CincinnatiWorks which indicates whether or not an individual applicant
completed the job readiness workshop. Demos is a vector of demographic characteristics
including: sex, race, education, family size, age, and marital status. FelonyOpp is the number of
days between the application date and the date that the criminal history data was collected in
2013. For example, an applicant in January of 2008 would have a longer period of time in which
to commit a felony compared to an applicant in December 2008. CriminalHistory is a vector of
dummy variables on whether or not an individual applicant was charged with a misdemeanor or
a felony before applying to Cincinnati Works. Finally, εis an idiosyncratic error term.
The identifying assumption in this model is that participation in Cincinnati Works does
not depend upon the outcome of interest, or being charged with a felony, after controlling for
variation caused by differences in the control variables. Through their application and
willingness to participate in the program, both members and non-members indicate a desire to
improve their economic condition. After a series of interviews with Cincinnati Works, several
workshop due to unforeseen circumstances (e.g. sickness, unexpected childcare responsibilities,
car trouble, etc.). If a member does not attend one of the workshop days, or is late for a
workshop, then that applicant is ineligible for membership at that time. Some disruptive events
may truly be random. However, it is more likely that there are reasons for which the selection
into Cincinnati Works membership is correlated with unobserved characteristics of criminal
behavior. In Section 5, I formalize the bounds of the bias by looking at coefficient movements
and movements in R-squared in the set of observable controls. Using a technique from Oster
(2013) and Altonji et al. (2005), I find that the coefficients from an OLS estimation of equation 1
are actually underestimated.
5 Model Results
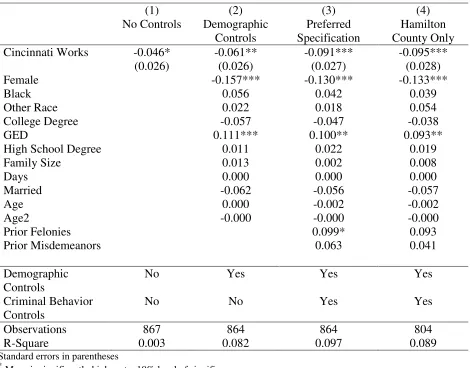
Table 2 shows the results of the OLS estimate of equation 1. Column 3, the preferred
specification, indicates that Cincinnati Works members are nine percentage points less likely to
be charged with a felony compared to non-Cincinnati Works members. Given that 18 percent of
non-Cincinnati Works members are charged with a felony sometime in the five years after their
application, Cincinnati Works decreases the probability of criminal charges by 50 percent.
Column 1 and column 2 show the effects of Cincinnati Works membership on felony charges
with no demographic controls and only demographic controls, respectively. The preferred
specification, column 3, includes additional controls for prior criminal behavior. Column 4
restricts the analysis to Hamilton County residents. Because criminal charges were only able to
be collected in Hamilton County, this specification restricts the observations to just Hamilton
County residents. This reduction in sample size of 7% is consistent with the net outflows from
<Insert Table 2 Here>
As controls are added to the estimating equation, the magnitude of the effect actually
increases, suggesting that any omitted variable bias actually works in favor of the results.
Nevertheless, Oster (2013) proposes a technique that builds on Altonji et al. (2005) to estimate
the selection on unobservables bias by assuming that the degree of the bias is proportional to the
selection effect on the observables. In other words, “the residual omitted variable bias after
inclusion of controls is proportional to the coefficient movements and the ratio of the movement
in R-squared with inclusion of the observable controls to the expected movement in R-squared
with the inclusion of the unobservable controls.” Because including control variables actually
moves the coefficient on Cincinnati Works further from null, the estimate of a nine percentage
point increase is a lower bound. The actual effect may be closer to fourteen percentage points
based on the technique proposed in Oster (2013) and using the psacalc function in Stata. There
are several reasons why the OLS estimates, while biased due to selection issues, may be
understated.
The Cincinnati Works management team shared the situation where an individual
applicant does not attend the workshop because he or she has received a job offer. Many of
Cincinnati Works’ members could lose a job in one day and have a different job the next day.
The transitory nature and relatively sudden job loss and re-employment is a common
characteristic of chronically unemployed individuals. In the case where an individual begins
working during the period between the Cincinnati Works application and the start of the
workshop, there is likely to be a positive bias in the estimated effect. I.e. if the underlying,
the receipt of a job offer, then the correlation between this characteristic and becoming a
Cincinnati Works member is negative. If this individual receives a job offer, then the
opportunity cost of committing a felony also just increased. Under a Becker model of crime, if
the opportunity cost increases, then the propensity to commit a crime decreases – indicating a
negative correlation (Becker 1968). If the unobserved characteristic is negatively correlated with
both the outcome of interest and the covariate of interest, then the effect of Cincinnati Works
membership is positively biased. That is, cov(CincinnatiWorks, JobOffer) < 0 and
cov(FelonyCharge, JobOffer) < 0. Under this scenario, the effect of Cincinnati Works
membership in Table 2 is understated.
Next, Cincinnati Works states its mission is to serve “those individuals in the community
who are currently unemployed or underemployed, i.e. the working poor.” If there is an
underlying characteristic that is correlated with unemployment or underemployment and also
affects the likelihood of committing a felony, then there is an additional concern of selection
bias. Cincinnati Works management indicated that many of its members receive benefits under
the Personal Responsibility and Work Opportunity Act (PRWOA). In order to receive income,
PRWOA requires a recipient to begin working after two years of receiving benefits; in addition,
there is a lifetime limit of five years of federal benefits. Many Cincinnati Works applicants had
exhausted their benefits at the time of application. For these individuals, they lost a licit source
of income. If an individual lost this source of income, then the opportunity costs of crime is also
lower, indicating a higher likelihood to commit a felony. Under this scenario, because the
unobserved characteristic of benefit exhaustion is positively correlated with both the outcome of
interest (felony charges) and the covariate of interest (membership), then the effect of Cincinnati
cov(FelonyCharge, BenefitExhaustion) > 0. Therefore, the effect of Cincinnati Works
membership in Table 2 is understated.
There are likely other characteristics that would bias the estimate on Cincinnati Works
membership, but the identifying assumption in equation 1 is that the positive bias as described in
the scenarios above is greater than any negative bias that may be caused by other characteristics
of Cincinnati Works applicants. Indeed, the increase in the magnitude of the estimated effect
that occurs when additional controls are included supports this premise. The effect of Cincinnati
Works on future felony charges is therefore likely understated, because the selection bias works
in favor of the estimated effect.
<Insert Table 3 Here>
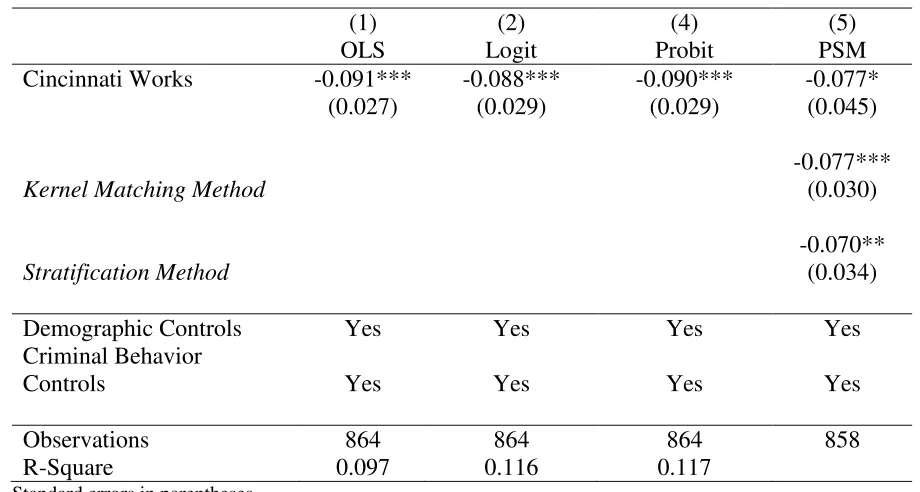
Columns 1 – 3 in Table 3 show that the reduction in felony charges is robust across OLS, Logit,
and Probit estimators. In addition, column 4 shows the effect of Cincinnati Works membership
using propensity score matching. Logit, Probit, and Propensity Score Matching all show a
consistent effect of a reduction in felony charges by 8 to 9 percentage points. While propensity
score matching (PSM) depends upon the same conditional independence assumption of the other
estimators, it also relies on the assumption of common support. That is, for any given variable
value, there is a positive probability of either being a Cincinnati Works participant or a
non-participant. As a result, the sample size is smaller than the original specification, because some
observations do not satisfy this assumption. In this specification, the matching covariates
include: sex, race, education, marital status, age, and whether or not an individual committed a
propensity score, the data is sorted by the propensity score; and the process of matching is done
by selecting control and treatment observations with the closest propensity scores. Nearest
neighbor matching was done with replacement to minimize the propensity score distance
between the control and treatment observations. After matching, the average effect of treatment
on the treated (ATT) can be determined. Column 4 also shows that the PSM estimator is robust
to a number of different specifications including nearest neighbor matching, kernel specification
matching, and stratification matching. Details of each specification can be made available upon
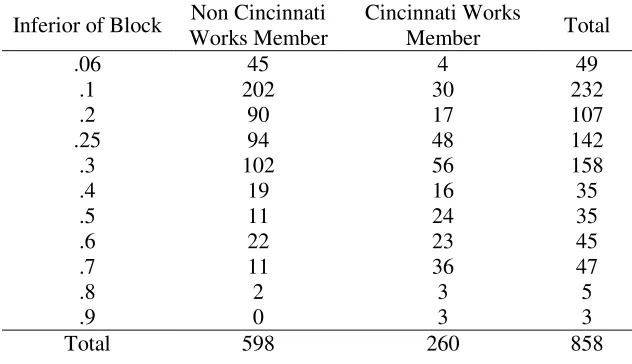
request. Table 4 shows that the balancing property in propensity score matching is satisfied with
a region of common support between 0.06 and 0.9.
<Insert Table 4 Here>
Finally, table 5 shows the separate effect of Cincinnati Works membership on those
applicants who were previously charged with a felony and those who were not charged with a
felony. Although the sample size for previous felons is small, the reduction in crime is driven by
those individuals who were not previously felons. Cincinnati Works appears to be more
effective at keeping individuals out of the criminal justice system for the first time, compared to
reducing the recidivism rate. This is not surprising given that Visher et al. (2005) concluded that
there was no overall evidence that employment services reduced recidivism among former
felons.
6 Benefit-Cost Analysis
Given the reduction in criminal charges as a result of the program, a benefit-cost analysis
can provide guidance for nonprofit organizations and policy makers by addressing whether the
monetary value of a program’s benefits exceed the program’s costs. After calculating the
benefit-cost ratio, one can determine if the valuation of scarce resources by society represents an
improvement in efficiency (Vining and Weimer, 2010; Boardman et al., 2010) While the goal of
BCA is to provide a comprehensive summary of all possible benefits and costs, many of these
are difficult to predict, quantify, or even measure. In this study, the benefits of the program
through criminal activity reductions are limited to the direct institutional costs.
Other studies have attempted to calculate additional costs associated with criminal
activities including victim costs from medical care, lost earnings, and property loss, as well as a
criminal’s opportunity costs and intangible costs (McCollister et al., 2010). These studies rely
on a description of the criminal activity in question (e.g. murder, rape, robbery, assault, etc.)
because the criminal costs vary dramatically from millions of dollars in cases of murder to only a
few thousand dollars in cases of property theft. Since the nature of the felony charge was not
available in the Cincinnati Works dataset, I elected not to include these additional costs in the
BCA. While no study can be considered perfect, BCAs should not incorporate unreliable data
into the calculation (S. Farrow and R.O. Zerbe, 2013). As a result, the BCA likely represent a
lower bound by understating the program’s benefits - particularly because the data on worker
earnings was not included due to it being substantially incomplete and self-reported. .
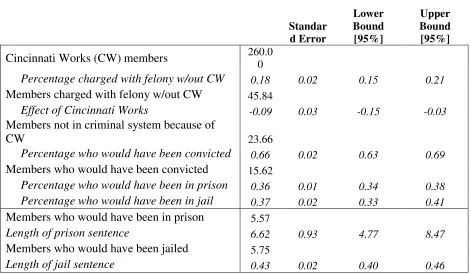
In order to calculate the benefits of crime reduction for the Cincinnati Works program,
Statistics’ report “Felony Defendants in Large Urban Counties, 2009 – Statistical Tables.” Table
6 contains the estimates for these parameters along with their standard errors.
<Insert Table 6 Here>
The $25,814 prison cost figure for the State of Ohio was based on a survey conducted by the
Vera Institute of Justice in 2010. In 2005, the Bureau of Justice Statistics estimated that the total
prison costs per inmate in Ohio was $26,741 in 2010 constant dollars. I relied on the Vera
Institute of Justice cost figures for the BCA because the data is more recent. The Vera Institute’s
prison costs include operation costs for both state-run and privately operated prisons as well as
any payments that were made to local jails or other states for housing state-sentenced inmates.
Unfortunately, the costs of jail for the State of Ohio are not available; however, the Washington
State Institute of Public Policy has calculated the costs of prison and jail for Washington (Aos
and Drake 2010). The benefit-cost analysis uses the ratio of jail to prison costs in Washington as
a proxy for the state of Ohio.
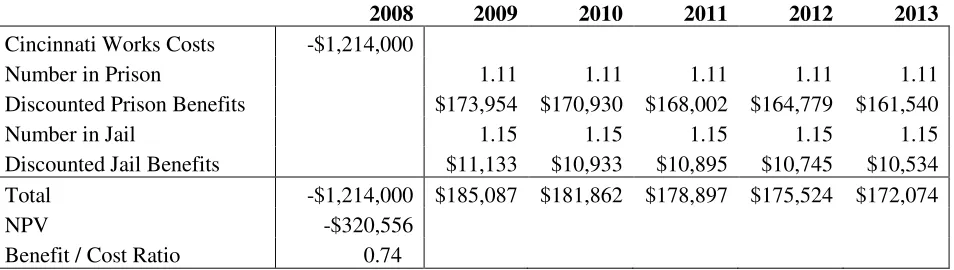
To calculate the benefits of the Cincinnati Works program, data was collected on whether
or not a person was charged with a felony in the five years after the participant completed the
program. Unfortunately, the dataset does not contain the particular point in time at which a
person was incarcerated. As a result, Table 7 assumes that the nearly six members who avoided
incarceration as a result of Cincinnati Works were spread-out evenly over the five year period.
Altering the assumption of felony prevention to be at the beginning of the five year period or at
the end of the five year period changes the benefit-cost ratio to between 0.71 and 0.76
compound annual growth rate of the CPI. The discount factor was assumed to be 3.5 percent, a
figure consistent with much of the CBA literature (Greenberg 2013). Finally, Cincinnati Works
costs in 2008 were adjusted to 2010 constant dollars to reflect the benefit estimates. The costs
were obtained from the 2008 Annual Report of Cincinnati Works. The per-participant costs
were calculated as Cincinnati Works’ total expenses as reported to the IRS in 2008 ($1,214,000)
divided by the 260 members that were served that year. These costs include training programs,
job placement services, and mentoring that were all provided to the Cincinnati Works members.
Assuming that the benefits reflect the average costs of an inmate, then the Cincinnati Works
program saves society 74 cents in prison costs for every dollar invested in the program.
<Insert Table 7 Here>
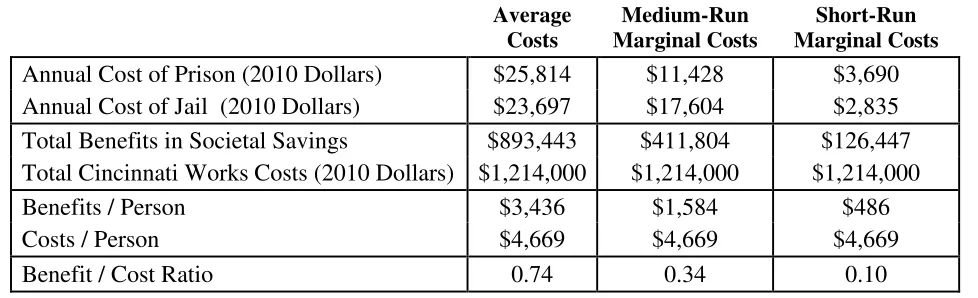
By only preventing approximately six individuals from incarceration, incorporating the
average costs per inmate into the benefit-cost analysis may not be the most accurate metric.
Average costs provided by the Vera Institute of Justice and the Bureau of Justice Statistics
include both fixed and variable costs. The subtraction of a handful of inmates is unlikely to
change the fixed costs of prison by any economically meaningful amount. For example, debt
payments on capital for facilities and other central administration expenditures are unlikely to
change as a result of a Cincinnati Works intervention. In contrast, short-run marginal costs are
likely to be affected by a reduction of only one inmate. Examples of short-run variable costs
include food, contracted services (such as medical care), and hygiene supplies. Medium-run
marginal costs, or step-fixed costs, remain constant within a certain range of a number of
are examples of step-fixed costs. The medium-run marginal costs and short-run marginal costs
for Ohio were again estimated using the State of Washington as a proxy. Table 8 shows that
medium-run marginal costs produce a benefit of 34 cents for every Cincinnati Works dollar
spent, while short-run marginal costs only generate 10 cents. Under medium-run marginal costs,
the benefit per member is $1,584 against a cost per member of $4,669. With short-run marginal
costs, the benefit per member is only $486. For comparison, Schochet et al. (2006) found that
the benefits of Job Corp due to crime reduction was $1,240.
<Insert Table 8 Here>
Because there is uncertainty in the parameters of the BCA analysis, a Monte Carlo
simulation was also performed using the mean parameter estimates and their standard errors.
The following formula calculates total benefits -
(2) Benefits = (Members Not Charged With Felony) * (Conviction Rate) * (Incarceration Rate) *
(Length of Sentence) * (Incarceration Costs)
If average costs were used in the benefit-cost analysis, there is only a 17 percent chance that the
program has a benefit-cost ratio greater than 1 under a Monte-Carlo simulation with 1000
6 Conclusion
Cincinnati Works likely generates between 10 and 34 cents of taxpayer savings from
reduced prison incarceration; however, the policy implications of these findings should not be
understated. Many job training programs only consider the social benefits of improved earnings
and employment. Failure to consider the effects of a job training program on criminal activity
reduction, may result in omitting substantial recidivism benefits. For example, larger scale
programs such as the One Stop delivery system under the Wagner-Peyser Act may see even
higher returns on investment because the scale of the program means the cost savings are closer
to average costs. The results of the Cincinnati Works benefit-cost analysis using average prison
costs shows that a large-scale job training program can pay for a large majority of its costs
through prison savings alone. Beyond the social benefits, a job training program improves the
quality of life for its members with Cincinnati Works members being 50 percent less likely to be
charged with a felony compared to non-Cincinnati Works members.
Competing Interests
The employer of the author received funding from the organization, Cincinnati Works. The receipt of the funding allowed for data collection and analysis. Any conclusions of the author were not influenced by funding.
Acknowledgements
References
Altonji, Joseph G., Todd E. Elder, and Christopher R. Taber. 2005. Selection on Observed and Unobserved Variables: Assessing the Effectiveness of Catholic Schools. Journal of Political Economy 113 (1): 151–84.
Aos, Steve and Elizabeth Drake. 2010. WSIPP’s Benefit-Cost Tool for States: Examining Policy Options in Sentencing and Corrections, Washington State Institute for Public Policy.
Becker, Gary. 1968. Crime and Punishment: An Economic Approach, Journal of Political Economy: 76.
Bloom, Howard S. et al., 1997. The Benefits and Costs of JTPA Title II-A Programs: Key Findings from the National Job Training Partnership Act study, Journal of Human Resources: 549-576.
Boardman, Anthony, et al. 2010. Cost-Benefit Analysis. 4th edition. Boston: Prentice Hall.
Bonta, James, Moira Law, and Karl Hanson. 1998. The Prediction of Criminal and Violent Recidivism among Mentally Disordered Offenders: A Meta-Analysis. Psychological Bulletin 123 (2): 123–42.
Card, David, Jochen Kluve, and Andrea Weber. 2010. Active Labor Market Policy Evaluations: A Meta-Analysis, NBER Working Papers 16173.
Clark, Andrew E and Andrew Oswald. 1994. Unhappiness and Unemployment, Economic Journal 104(424): 648-659.
Cooper, Alexia et al. 2014. Recidivism Of Prisoners Released In 30 States In 2005: Patterns From 2005 To 2010. Bureau of Justice Statistics.
http://www.bjs.gov/index.cfm?ty=pbdetail&iid=4986.
Devers, Lindsey. 2011. Plea and Charge Bargaining. Bureau of Justice Assistance.
Duleep, Harriet. 1986. Measuring the Effect of Income on Adult Mortality Using Longitudinal Administrative Record Data, Journal of Human Resources 21(2): 238-251.
Ettner, Susan L. 1996. New Evidence on the Relationship between Income and Health, Journal of Health Economics 15(1): 67-85.
Farrow, S., and R.O. Zerbe. 2013. Principles and Standards for Benefit–Cost Analysis. Cheltenham, GBR: Edward Elgar Publishing.
http://site.ebrary.com/lib/alltitles/docDetail.action?docID=10685377.
Greenberg, David. 2013. A cost-benefit analysis of Tulsa’s IDA program. Journal of Benefit -Cost Analysis, 4, pp 263-300 doi:10.2202/2152-2812.1005.
Heinrich, Carolyn J., et al. 2009. New estimates of public employment and training program net impacts: A nonexperimental evaluation of the Workforce Investment Act program.
Economics Publications.
Henrichson, Christian and Ruth Delaney. 2012. The Price of Prisons: What Incarceration Costs Taxpayers.
http://www.vera.org/pubs/special/price-prisons-what-incarceration-costs-taxpayers. Vera Institute of Justice.
Hotz, Joseph, Guido W. Imbens, and Jacob A. Klerman. 2006. Evaluating the Differential Effects of Alternative Welfare-to-Work Training Components: A Reanalysis of the California GAIN Program, Journal of Labor Economics 24(3): 521-566.
Johnson, B. 2003. Racial and ethnic disparities in sentencing departures across modes of conviction. Criminology 41:449–490.
Lechner, Michael and Conny Wunsch. 2009. Are Training Programs More Effective When Unemployment Is High? Journal of Labor Economics 27(4): 653-692.
McCollister, Kathryn E., Michael T. French, and Hai Fang. 2010. The Cost of Crime to Society: New Crime-Specific Estimates for Policy and Program Evaluation. Drug and Alcohol Dependence 108 (1-2): 98–109.
Oster, Emily. 2013. Unobservable Selection and Coefficient Stability: Theory and Validation. NBER Working Paper 19054. NBER. http://www.nber.org/papers/w19054.pdf.
Piehl, A., and S. Bushway. 2007. Measuring and explaining charge bargaining. Journal of Quantitative Criminology 23:105–125.
Reaves, Brian. 2013. Felony Defendants in Large Urban Counties, 2009 – Statistical Tables. State Court Processing Statistics. Bureau of Justice Statistics.
Schochet, Peter Z., John Burghardt, and Sheena McConnell. 2006. National Job Corps Study and Longer-Term Follow-Up Study. Mathematica Policy Research.
Schochet, Peter Z., John Burghardt, and Sheena McConnell. 2008. Does Job Corps Work? Impact Findings from the National Job Corps Study, The American Economic Review:
1864-1886.
Stephan, James. 2008. Census Of State And Federal Correctional Facilities, 2005. http://www.bjs.gov/index.cfm?ty=pbdetail&iid=530. Bureau of Justice Statistics.
Ulmer, J., and M. Bradley. 2006. Variation in trial penalties among serious violent offenses.
Criminology 44:631–670.
Vining, Aidan, and David L Weimer. 2010. “An Assessment of Important Issues Concerning the
Application of Benefit-Cost Analysis to Social Policy.” Journal of Benefit-Cost Analysis 1 (01): 1–40. doi:10.2202/2152-2812.1013.
Table 1: Summary Statistics
(1) (2) (3)
All Cincinnati
Works Member
Non-Cincinnati Works Member
Black 0.84 0.84 0.84
White 0.15 0.14 0.15
Other Race 0.01 0.02 0.01
Female 0.51 0.45 0.53**
Married 0.10 0.09 0.11
Age 32.40 34.43*** 31.53
Family Size 1.19 1.27** 1.15
At Least a High School Degree 0.57 0.66*** 0.53
Transportation with Car 0.30 0.30 0.29
Hamilton County Resident 0.96 0.95 0.96
Felony Before Cincinnati Works 0.13 0.23*** 0.08
Misdemeanor Before Cincinnati Works 0.18 0.38*** 0.09
Felony – Five Years After Application 0.16 0.13 0.18**
Number of Observations 867 260 607
**
Mean is significantly higher at a 5% level of significance ***
Table 2: OLS Estimate of Cincinnati Works on Felony Charges
(1) (2) (3) (4)
No Controls Demographic Controls
Preferred Specification
Hamilton County Only
Cincinnati Works -0.046* -0.061** -0.091*** -0.095***
(0.026) (0.026) (0.027) (0.028)
Female -0.157*** -0.130*** -0.133***
Black 0.056 0.042 0.039
Other Race 0.022 0.018 0.054
College Degree -0.057 -0.047 -0.038
GED 0.111*** 0.100** 0.093**
High School Degree 0.011 0.022 0.019
Family Size 0.013 0.002 0.008
Days 0.000 0.000 0.000
Married -0.062 -0.056 -0.057
Age 0.000 -0.002 -0.002
Age2 -0.000 -0.000 -0.000
Prior Felonies 0.099* 0.093
Prior Misdemeanors 0.063 0.041
Demographic Controls Criminal Behavior Controls No No Yes No Yes Yes Yes Yes
Observations 867 864 864 804
R-Square 0.003 0.082 0.097 0.089
Standard errors in parentheses *
Mean is significantly higher at a 10% level of significance **Mean is significantly higher at a 5% level of significance ***
Table 3: Estimate of Cincinnati Works on Felony Charges, Robustness Check
(1) (2) (4) (5)
OLS Logit Probit PSM
Cincinnati Works -0.091*** -0.088*** -0.090*** -0.077*
(0.027) (0.029) (0.029) (0.045)
-0.077***
Kernel Matching Method (0.030)
-0.070**
Stratification Method (0.034)
Demographic Controls Criminal Behavior Controls
Yes
Yes
Yes
Yes
Yes
Yes
Yes
Yes
Observations 864 864 864 858
R-Square 0.097 0.116 0.117
Standard errors in parentheses *
Mean is significantly higher at a 10% level of significance ***
Table 4: Propensity Score Matching Characteristics
Inferior of Block Non Cincinnati Works Member
Cincinnati Works
Member Total
.06 45 4 49
.1 202 30 232
.2 90 17 107
.25 94 48 142
.3 102 56 158
.4 19 16 35
.5 11 24 35
.6 22 23 45
.7 11 36 47
.8 2 3 5
.9 0 3 3
Table 5: Estimate of Cincinnati Works on Felony Charges, By Felon
(1) (2) (3)
OLS Prior Felony
Charge
No Prior Felony Charge
Cincinnati Works -0.091*** -0.054 -0.104***
(0.027) (0.096) (0.027)
Demographic Controls
Criminal Behavior Controls
Yes
Yes
Yes
Yes
Yes
Yes
Observations 864 109 755
R-Square 0.097 0.127 0.075
Standard errors in parentheses ***
Table 6: Benefit-Cost Analysis Parameters
Standar d Error
Lower Bound [95%]
Upper Bound [95%]
Cincinnati Works (CW) members 260.0
0
Percentage charged with felony w/out CW 0.18 0.02 0.15 0.21
Members charged with felony w/out CW 45.84
Effect of Cincinnati Works -0.09 0.03 -0.15 -0.03
Members not in criminal system because of
CW 23.66
Percentage who would have been convicted 0.66 0.02 0.63 0.69
Members who would have been convicted 15.62
Percentage who would have been in prison 0.36 0.01 0.34 0.38
Percentage who would have been in jail 0.37 0.02 0.33 0.41
Members who would have been in prison 5.57
Length of prison sentence 6.62 0.93 4.77 8.47
Members who would have been jailed 5.75
Table 7: Benefit-Cost Analysis
2008 2009 2010 2011 2012 2013
Cincinnati Works Costs -$1,214,000
Number in Prison 1.11 1.11 1.11 1.11 1.11 Discounted Prison Benefits $173,954 $170,930 $168,002 $164,779 $161,540 Number in Jail 1.15 1.15 1.15 1.15 1.15 Discounted Jail Benefits $11,133 $10,933 $10,895 $10,745 $10,534 Total -$1,214,000 $185,087 $181,862 $178,897 $175,524 $172,074
NPV -$320,556
Table 8: Benefit-Cost Analysis with Different Cost Definitions
Average Costs
Medium-Run Marginal Costs
Short-Run Marginal Costs Annual Cost of Prison (2010 Dollars) $25,814 $11,428 $3,690
Annual Cost of Jail (2010 Dollars) $23,697 $17,604 $2,835
Total Benefits in Societal Savings $893,443 $411,804 $126,447 Total Cincinnati Works Costs (2010 Dollars) $1,214,000 $1,214,000 $1,214,000
Benefits / Person $3,436 $1,584 $486
Costs / Person $4,669 $4,669 $4,669
Benefit / Cost Ratio 0.74 0.34 0.10