ISSN Online: 2327-4379 ISSN Print: 2327-4352
DOI: 10.4236/jamp.2017.59156 Sep. 28, 2017 1855 Journal of Applied Mathematics and Physics
National Innovation-Oriented City Evaluation
Study Based on Two-Stage DEA Model
Xianbiao Wei, Yuzhen Duan, Mo Wang, Junxing Zhou, Xiaobao Peng
University of Science and Technology of China, Hefei, China
Abstract
The research on the evaluation indicator system of innovation-oriented cities has a long history. It presents different characteristics in different countries or regions. In 2006, China proposed the national strategy to build an innovation- oriented nation and subsequently approved more than 60 pilot cities in the country. The research on China’s innovation-oriented city assessment system is also increasing. On the basis of predecessors, this paper constructs innovation- oriented city evaluation indicator system with more links based on innovation link. It has three categories with 44 indicators in total according to input, in-termediate output and final output. It creatively introduces in two-stage DEA model on sharing input and constructs the evaluation model based on the above evaluation indicator system. This paper makes an empirical analysis on the innovation-oriented cities in Yangtze River Delta including Hefei, arrives at innovation efficiency difference and puts forward some countermeasures and suggestions for the analysis results.
Keywords
DEA, National Innovation-Oriented Cities, Assessment
1. Introduction
As an important factor to drive economic and social development, innovation has been widely regarded by scholars at home and abroad. With the conti-nuous development of China’s economy and the constantly changing of Chi-na’s economic structure and economic growth driving forces, the importance of innovation-oriented city construction is becoming more and more promi-nent. An innovation-oriented city conforms to the requirement of modern eco-nomic development. It regards innovation as core driving force for development of a city and speeding up development of the regional industry through the way
How to cite this paper: Wei, X.B., Duan, Y.Z., Wang, M., Zhou, J.X. and Peng, X.B. (2017) National Innovation-Oriented City Evaluation Study Based on Two-Stage DEA Model. Journal of Applied Mathematics and Physics, 5, 1855-1873.
https://doi.org/10.4236/jamp.2017.59156
Received: March 28, 2017 Accepted: September 25, 2017 Published: September 28, 2017
Copyright © 2017 by authors and Scientific Research Publishing Inc. This work is licensed under the Creative Commons Attribution International License (CC BY 4.0).
http://creativecommons.org/licenses/by/4.0/
DOI: 10.4236/jamp.2017.59156 1856 Journal of Applied Mathematics and Physics of innovation. It helps to improve the scientific and technological innovation ability, optimize configuration of a city’s internal production resource factors and then promote and coordinate the development of the city’s social economy in an all-round way. In order to improve the independent innovation ability and international competitiveness of a city, many cities in our country have also successively put forward the objectives and tasks to construct innova-tion-oriented cities. In fact, innovainnova-tion-oriented cities require being smart, then only to survive as platforms that suggest economic, urban, and environmental well being [1]. Research on innovation-oriented city construction in China has important practical significance. Evaluation on the efficiency of city innovation can provide a basic criterion for scientized and rationalized construction of in-novation-oriented cities and give a reference to cities’ rational allocation of re-sources on the premise of maximized innovative efficiency. At the same time, it is easier for efficiency evaluation to find the problems in the evaluation process faced by innovation-oriented cities construction so as to facilitate policy-making and manage the countermeasures.
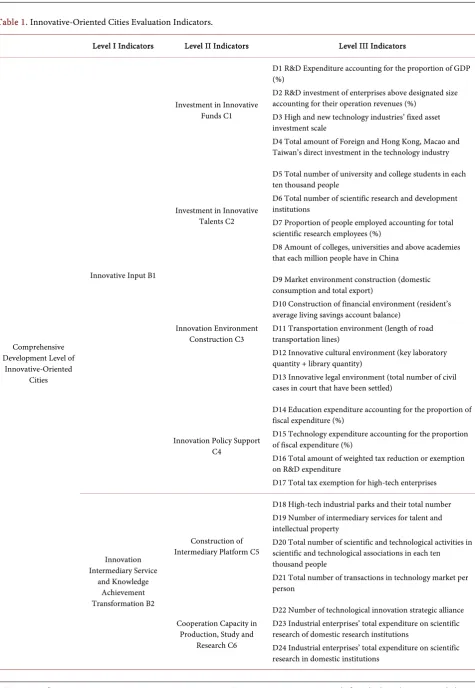
re-DOI: 10.4236/jamp.2017.59156 1857 Journal of Applied Mathematics and Physics sources for innovative development, the secondary indicator, innovative input, can be divided into innovative capital input, innovative talent input, innovative environment construction and innovative policy support four third-level indi-cators. The intermediary service and intellectual achievements transformation are divided into intermediary platform construction, industry-university-research cooperation ability and innovation diffusion absorption ability three third-level indicators in accordance with the basic model of collaborative innovation and open innovation. According to the effect of innovation-oriented city develop-ment, the innovative output indicator can be divided into four third-level indi-cators: technological innovation effect, economic pull effect, social contribution effect and ecological construction effect.
DOI: 10.4236/jamp.2017.59156 1858 Journal of Applied Mathematics and Physics promotion and economic sustainable development. The main indicators include total urban population, total economic development, labor force structure and technology R&D expenditures, etc. (James Simmie, 2001).
Scholars have constructed some innovation-oriented city evaluation systems. From the perspective of foreign scholars, the earliest to evaluate city innovation ability is Robert Huggins Association in Britain. Its main function is to build the indicator system to evaluate the intellectual output and science and technology influence of cities. It focuses on the competitiveness of the city. Later, the indi-cator evaluation system of city innovation capability and its framework have been perfected constantly. Among many indicators, European Innovation Scoreboard (EIS) is relatively common in utility. That index conducts its evalua-tion mainly around resources and policy support, which mainly includes three aspects: a city’s development environment, subject’s behavior during the devel-opment of an innovation-oriented city and the develdevel-opment achievements of an innovation-oriented city. Among them, subject’s behavior mainly focuses on the enterprise subject; development achievements mainly focus on the innovation output and economic growth. It can be seen from EIS’ evaluation system that the scope of its evaluation has certain limitations. The scope of the evaluation’s in-fluence factors is limited; the evaluation’s subject is singular; the performance output concerned is over concentrated on economic effect. At present, the eval-uation system is under revising and the current indicators has increased to 29, covering many aspects like economic development, employment, scientific re-search, education, social welfare and social stability. Another commonly used indicator is OECD’s Scientific Technology and Industrial Innovation Integral Card. It constructs the STI innovation indicator system, whose main function is the centralized evaluation on technology and intellectual output. It pays a heavy attention to knowledge and intellect’s influence on production and development. In 2010, the World Economy Forum (WEF) released Innovation Capacity Indi-cator (ICI). ICI is a composite IndiIndi-cator including elements such as institution, legal system. It carries out a systematic evaluation on innovation-oriented cities mainly from institutional environment, human capital, social participation, con-trol and legal framework, R&D situation and application of informative com-munication technology. The indicator is currently widely used internationally.
DOI: 10.4236/jamp.2017.59156 1859 Journal of Applied Mathematics and Physics and evaluated the innovation ability of 10 provinces and cities in eastern China. Liu Shunzhong et al. (2007) establishes input and output indicator by using DEA method and evaluates the regional innovation performance of China. Guan Jiancheng, et al. (2005) analyzes the influence of innovative system’s resources allocation in regional innovation institutions on innovation performance in China with DEA method. Ma Xiuzhen, et al. (2014) uses DEA method to empir-ically analyze the relative efficiency of technology input and output in Qingdao from 2001 to 2011. However, most studies on innovation-oriented cities only settle the innovation on the individual economic subject level and the develop-ment results of specific innovation subject. They do not consider innovation as a resource integration and coordination activity, lacking of system and develop-ment point of view.
2. China’s Innovation-Oriented City Input and Output
Indicator System
DOI: 10.4236/jamp.2017.59156 1860 Journal of Applied Mathematics and Physics with basic factors and environmental supporting capacity analysis, performance analysis, development path analysis, innovation network analysis, innovation chain construction analysis. Evaluation indicators are shown in Table 1.
The first-level indicators are determined to be innovative input, innovative intermediary service and intellectual achievements transformation and innova-tive output, which are mainly based on system principle of indicator institution. Namely, the process of determining the indicator is not to simply list those indi-cators but to consider connection and integrity between indiindi-cators and to pay attention to the combination of micro and macro indicators. When innova-tion-oriented city’ capacity is evaluated, innovative input, innovative interme-diary services and innovative performance output indicator are organically or-ganized, combining the innovation system theory. They offer a framework for evaluating innovation performance: the innovation value chain. It comprises the three main phases of innovation (idea generation, conversion, and diffusion) as well as the critical activities performed during those phases (looking for ideas in-side your unit; looking for them in other units; looking for them externally; se-lecting ideas; funding them; and promoting and spreading ideas companywide)
[8]. Multi-agent, multi-level and multi-dimensional innovative factors are con-sidered comprehensively. There are a few channels including technoparks, building research platforms with enterprises in different ways, and technology transfer offices to diffuse the knowledge [9]. All main links during an tion-oriented city’s development are holistically analyzed. In terms of innova-tive input, capital, talent, environment and policy are the most important ele-ments.
In terms of the intermediary service and intellectual achievements transfor-mation, we set platform construction, industry-university-research cooperation ability and innovation diffusion absorption ability as secondary indicators be-cause that process is based on the intermediary service platform’s connecting process towards input and output elements. In terms of innovative output, in-novation mainly benefits economic and social development through scientific and technological achievements. So, when we study science and technology in-novation effect, we also set economic development effect and social contribution effect as secondary indicators. Integrating concept and principle of ecological ci-vilization into innovation-oriented city evaluation system is the key to ensure healthy development of urbanization in China. At present, many cities have no consideration to consequences for the ecological environment during the de-velopment, so this paper especially introduces ecological construction effect of innovation-oriented cities into indicator system.
3. Indicator Weight Determination and DEA Model
Construction
DOI: 10.4236/jamp.2017.59156 1861 Journal of Applied Mathematics and Physics Table 1. Innovative-Oriented Cities Evaluation Indicators.
Level I Indicators Level II Indicators Level III Indicators
Comprehensive Development Level of
Innovative-Oriented Cities
Innovative Input B1
Investment in Innovative Funds C1
D1 R&D Expenditure accounting for the proportion of GDP (%)
D2 R&D investment of enterprises above designated size accounting for their operation revenues (%)
D3 High and new technology industries’ fixed asset investment scale
D4 Total amount of Foreign and Hong Kong, Macao and Taiwan’s direct investment in the technology industry
Investment in Innovative Talents C2
D5 Total number of university and college students in each ten thousand people
D6 Total number of scientific research and development institutions
D7 Proportion of people employed accounting for total scientific research employees (%)
D8 Amount of colleges, universities and above academies that each million people have in China
Innovation Environment Construction C3
D9 Market environment construction (domestic consumption and total export)
D10 Construction of financial environment (resident’s average living savings account balance)
D11 Transportation environment (length of road transportation lines)
D12 Innovative cultural environment (key laboratory quantity + library quantity)
D13 Innovative legal environment (total number of civil cases in court that have been settled)
Innovation Policy Support C4
D14 Education expenditure accounting for the proportion of fiscal expenditure (%)
D15 Technology expenditure accounting for the proportion of fiscal expenditure (%)
D16 Total amount of weighted tax reduction or exemption on R&D expenditure
D17 Total tax exemption for high-tech enterprises
Innovation Intermediary Service
and Knowledge Achievement Transformation B2
Construction of Intermediary Platform C5
D18 High-tech industrial parks and their total number D19 Number of intermediary services for talent and intellectual property
D20 Total number of scientific and technological activities in scientific and technological associations in each ten thousand people
D21 Total number of transactions in technology market per person
Cooperation Capacity in Production, Study and
Research C6
D22 Number of technological innovation strategic alliance D23 Industrial enterprises’ total expenditure on scientific research of domestic research institutions
DOI: 10.4236/jamp.2017.59156 1862 Journal of Applied Mathematics and Physics Continued
Innovative Absorption Diffusion Capability C7
D25 Total amount of expenditure for technology import D26 Total amount of technical assimilation expenditure D27 Total expenditure for technical transformation D28 Total expenditure for purchasing domestic technology
Innovative Output B3
Scientific and Technological Innovative
Effect C8
D29 Total number of patents issued in each million people D30 Scientific achievements and awards amount D31 Per capita technical contract transaction amount
Economic Development Effect C9
D32 GDP per capita (RMB 100 million)
D33 Value added of the tertiary industry accounting for the proportion of GDP (%)
D34 Labor productivity in high-tech industry (%) D35 Total amount of export in high and new technology industrial development zone (%)
Social Contribution Effect C10
D36 Per capita income value added of urban and rural residents (living standards of residents)
D37 Urban unemployment rate (driving employment capacity) D38 Value added of total city tax revenue (tax capacity) D39 Social welfare donation and relief expenditure (social responsibility ability)
Ecological Construction Effect C11
D40 Energy consumption rate per unit of GDP (%) D41 Amount of water reused in cities
D42 Comprehensive utilization rate of industrial solid waste (%)
D43 Total investment in environmental protection facilities D44 Green coverage rate in built-up area (%)
DOI: 10.4236/jamp.2017.59156 1863 Journal of Applied Mathematics and Physics determination methods have some defects. Analytic hierarchy process (AHP) is an indicator weight determining method combining subjective evaluation with objective evaluation. Entropy weight method is based on the variability of raw data to determine the weight of indicators. The greater the variation of indica-tors is, the more information will be reflected out and the bigger the indicator weight will be determined correspondingly. Although this method ensures the objectivity of the data processing, the cause of a big indicator variation is a lot. It is difficult to guarantee and explain the reason for a larger variation is due to a larger contribution from the indicator to the upper indicator. Particularly, when there is a large development difference between two evaluation objects, the eval-uation under this method becomes inaccurate and not objective. The corres-ponding maximum interest margin weighting method, variation coefficient me-thod and standard deviation meme-thod all have the above question, so they will not be explained in this paper. For the problems existing in many above evalua-tion-weighting methods, it can be seen that it should not only guarantee the principle of objective evaluation but also ensure the indicator weight size should show the degree of contribution to upper indicator and embody the real effect of each indicator to innovation and development when the indicator weight me-thod is chosen. Therefore, data envelopment analysis (DEA) is selected in this paper as determination method of indicator weight.
According to the present evaluation decision-making unit DMU, supposing that there are n innovation-oriented cities as evaluation objects, any one of the cities j is selected as a basic code of those innovation-oriented cities and
1,2,3,4, ,
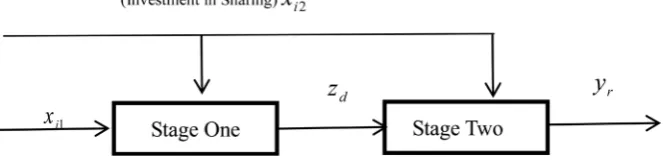
j= n. The evaluation of the whole innovation process can be divided into two links. The first link is mainly innovation input indicator’s evaluation on intermediary service and platform output efficiency, which includes the specia-lized inputs in the first stage and the sharing input used together with the second stage. The second stage is mainly intermediary service and intellectual achieve-ments transformation’s innovative performance to the final performance. Out-put of the first stage is to create the ultimate innovation performance so it is added into the performance creation in second stage as a new input. At this point, part of the first stage’s sharing input continues to be the input of the second stage. As the intermediate variable, all output in the first stage constitutes the second stage’s input.
According to the above evaluation link, each decision-making unit
(
1,2,3, ,)
j
DMU j= n has m input indicators during the whole innovation process in total. They are defined as x iij
(
=1,2, , m)
. Some of those m indica-tors are just the initial innovative input indicindica-tors in the first stage, which can be defined as xi j2(
i1=1,2,3,4, , , m i I)
1∈ 1; while others are input indicators that are shared by both stages, which can be defined as xi j2(
i2=1,2,3,4, , m)
,2 2
DOI: 10.4236/jamp.2017.59156 1864 Journal of Applied Mathematics and Physics generate s intermediate output correspondingly, which can be defined as
(
1,2, ,)
dj
z d= s ; later, they will be the input of the second stage. This paper as-sumes that all the intermediate output is the input in the second stage and partici-pate in the achievements creation. At the same time, t performance outputs will be generated at the end of second stage, which is marked as y rrj
(
=1,2,3,4, , t)
. Given the hysteresis of innovative input and the accessibility of innovative indi-cator data, the selecting phase of the final output indiindi-cator is delayed for two phases. The input xi j2(
i2=1,2,3,4, , , m i)
2∈I2 is shared by both stages, so we assume that all x ii j2 ,2∈I2 will be divided into two parts to distinguish theirproportions in those two inputting stages. One part is αi j i j2 x2 while another
part is
(
1−αi j2)
xi j2 , among which all αi j2 must be guaranteed within acer-tain interval range (note: the weights of input and output are respectively deter-mined as u ui1, , ,i2ηd ur).
By building the above model, we can not only ensure that the entirety is effec-tive but also ensure that each stage is effeceffec-tive. The related conceptual model is shown in Figure 1.
In order to better measure the efficiency in the two stages’ process, we will set a set of optimal weights for the intermediary link to maximize the overall inno-vation efficiency. Under the assumptions of the scale yield constant CRS, we mark the total innovative efficiency score as two stages’ weighted sum:
(
)
1 1 2 2
2 2
1 1
1 2
1 1 2 2 2
2 2 2
1
1
s t
d d r r
d r
s i i i i i
i I i I i i i d d i I
d
z u y
w w
u x u x u x z
η
α α η
= =
∈ ∈
∈
=
+
+ − +
∑
∑
∑
∑
∑
∑
Among them, w w1+ 2 =1.
The definition of the above overall efficiency model can ensure that the overall process is valid and each phase is valid for sure. On the premise of unchanged returns to scale, the holistic input of the overall input process can be expressed as:
1 1 1 1 2 2 2 2
1 s
i i j i i j d d
i I i I
d
u x u x η z
∈ ∈
=
+ +
∑
∑
∑
The overall output in this process can be directly expressed as:
1 1
s t
d d r r
d z r u y
η
= =
+
∑
∑
[image:10.595.209.541.628.712.2]The linear programming model is established as follows:
DOI: 10.4236/jamp.2017.59156 1865 Journal of Applied Mathematics and Physics
(
)
1 1 2 2
1 1 2 2
2 2
* 1 1
0
1 1 2 2 2
1
1
2 2 2 2 2
1
2 2 2
1
1 2
2 2 2
max
s.t. 1, 1,2,3,4, ,
1, 1,2,3,4, ,
1
,
s t
d d r r
d r
s i i j i i j i j d d
i I i I
d s
d d d
i i j i i j i j
i I i I
t r r r
s
i i j i j d d
i I
d
i j i j i j
z u y
u x u x z
z
j n
u x u x
u y
j n
u x z
L L j
η θ α η η α α η α = = ∈ ∈ = = ∈ ∈ = ∈ = + = + + ≤ = + ≤ = − + ≤ ≤ =
∑
∑
∑
∑
∑
∑
∑
∑
∑
∑
∑
1 2 1 1 2 2
1,2,3, ,
, , , , , , 1,2, , , 1,2, ,
i i d r
n
u u η u ≥ε i I i∈ ∈I r= t d= s
Since the above model is a fractional planning, it is difficult to solve. So, the model can be equally transformed by Charnes-Cooper transformation into:
(
)
(
)
1 1 2 2
2 2
1 1 2 2
* 0
1 1
1 1 2 2
1
2 2 2
1 1
1 1 2 2
1
1 2
2 2 2
max
s.t. 0, 1,2, ,
1 0, 1,2, ,
1
, 1,2,3
s t
d d r r
d r
s
d d j i I i i j i I i i j d
t s
r rj i I i i j i j d dj
r d
s
i i i i d d
i I i I
d
i j i j i j
z y
z x x j n
y x z j n
x x z
L L j
θ π µ
π ω ω
µ ω α π
ω ω π
α = = ∈ ∈ = ∈ = = ∈ ∈ = = + − + ≤ = − − + ≤ = + + = ≤ ≤ =
∑
∑
∑
∑
∑
∑
∑
∑
∑
∑
∑
1 2 1 2 1 1 2 2
, ,
, , , , , , 1,2, , , 1,2, ,
i i i i
n
i I i I r t d s
µ µ ω ω ≥ε ∈ ∈ = =
Since there is
∑
i I2∈2ω αi2 i j i j2 x2 in the model, the above model is stillnonli-near, which needs to be transformed into linear model through βi j2 =ω αi j i j2 2
to solve.
(
)
(
)
1 1 2 2
2 2
1 1 2 2
* 0
1 1
1 1 2 2
1
2 2 2
1 1
1 2 2
1
1 2
2 2 2 2 2
max
s.t. 0, 1,2, ,
0, 1,2, ,
1
, 1,2
s t d d r r d r s
d d j i I i i j i I i i j d
t s
r rj i I i i j i j d dj
r d
s i i i d d i I i I
d i j i i j i j i
z y
z x x j n
y x z j n
x x z
L L j
θ π µ
π ω β
µ ω β π
ω π
ω β ω
= = ∈ ∈ = ∈ = = ∈ ∈ = = + − + ≤ = − − + ≤ = + + = ≤ ≤ =
∑
∑
∑
∑
∑
∑
∑
∑
∑
∑
∑
1 2 1 2 1 1 2 2
,3, ,
, , , , , , 1,2, , , 1,2, ,
i i i i
n
i I i I r t d s
µ µ ω ω ≥ε ∈ ∈ = =
In order to better understand the mechanism of each link, the above overall efficiency is decomposed. On the premise to ensure overall efficiency, the effi-ciency of the first and second stages is highest. Based on the above model, we bring in two optimal weight *
1
w and * 2
w , * 1 1 * 2 2 1 i I i i1 1 i I i2 2i
w ω x β∗x
∈ ∈
DOI: 10.4236/jamp.2017.59156 1866 Journal of Applied Mathematics and Physics
* *
2 1 1
w = −w , * * * * 1, 2, 2,
i i i d
w w
β π
is the optimal solution of model w wi1, i2,β πi2, d. Under the premise that the overall efficiency is optimal, the maximum effi-ciency of the first phase is guaranteed and the model is as follows:(
)
1 1 2 2
1 1 2 2
2 2
1 1 1
* 1
1
1 1 2 2 2
1
1 1 2 2 2
1
2 2 2
1
* 1 1
0
1 2 2
max
s.t. 1, 1,2,3, ,
1, 1,2,3,4, ,
1
s d d d
i i i i i
i I i I
s d d j d
i i j i i j i j
i I i I
t r r r
s
i i j i j d dj
i I
d
s t
d d r r
d r
i i i i
i I
z
u x u x
z
j n
u x u x
u y
j n
u x z
z u y
u x u
η θ α η α α η η θ α = ∈ ∈ = ∈ ∈ = ∈ = = = ∈ = + ≤ = + ≤ = − + + = +
∑
∑
∑
∑
∑
∑
∑
∑
∑
∑
∑
∑
2 21 1 2 2
2 1
* 1 *
1 0
1 1 2 2 2
1 2
2 2 2
1 2 1 1 2 2
, 1,2,3, ,
, , , , , , 1,2, , , 1,2, , s
i d d
i I
d s
d d d
i i i i i
i I i I
i j i j i j
i i r d
x z
z w
u x u x
L L j n
u u u i I i I r t d s
η η θ α α η ε ∈ = = ∈ ∈ + ≤ + ≤ ≤ = ≥ ∈ ∈ = =
∑
∑
∑
∑
∑
Transform the above model into a linear model as follows:
(
)
(
)
(
)
(
)
1 1 2 2
2 2
1 1 2 2
* 1
1
1 1 2 2
1
2 2 2
1 1
*
0 0 1 1 2 2
1 1
* *
1 0
1 max
s.t. 0, 1,2, ,
0, 1,2, ,
1 0
s d d d s
d d j i I i i j i I i i j d
t s
r rj i I i i j i j d dj
r d
s t
d d r r i I i i i I i i
d r
s d d d
z
z x x j n
y x z j n
z y x x
w z
θ π
π ω β
µ ω β π
θ π µ θ ω ω
π θ ω = ∈ ∈ = ∈ = = ∗ ∈ ∈ = = = = − + ≤ = − − + ≤ = − + − + = ≤
∑
∑
∑
∑
∑
∑
∑
∑
∑
∑
∑
∑
1 1 1 1 2 2 2 2
1 2
2 2 2 2 2
1 2 1 1 2 2
1
, 1,2,3, ,
, , , , , , 1,2, , , 1,2, ,
i i i i
i I i I
i j i i j i j i
r d i i
x x
L L j n
i I i I r t d s
β
ω β ω
µ π ω ω ε
∈ + ∈ = ≤ ≤ = ≥ ∈ ∈ = =
∑
∑
The efficiency score of the first stage can be obtained through the calculation of the above model and the efficiency of the first stage are brought into the for-mula:
* 0 1 1
2
2
θ θ ω θ
ω
′′− ′′ ′′ =
′′
DOI: 10.4236/jamp.2017.59156 1867 Journal of Applied Mathematics and Physics linear model of the second stage can be obtained:
(
)
(
)
(
)
(
)
1 1 2 2
2 2
1 1 2 2
* 2
1
1 1 2 2
1
2 2 2
1 1
*
0 0 1 1 2 2
1 1
* 2
1 max
s.t. 0, 1,2, ,
0, 1,2, ,
1 0
t r r r s
d d j i I i i j i I i j i j d
t s
r rj i I i i j i j d dj
r d
s t
d d r r i I i i i I i i
d r s r r d i y
z x x j n
y x z j n
z y x x
w y
θ µ
π ω β
µ ω β π
θ π µ θ ω ω
µ θ ω = ∈ ∈ = ∈ = = ∗ ∈ ∈ = = = = − + ≤ = − − + ≤ = − + − + = ≤
∑
∑
∑
∑
∑
∑
∑
∑
∑
∑
∑
∑
(
)
2 2 2 2 2 1
1 2
2 2 2 2 2
1 2 1 1 2 2
1
, 1,2,3, ,
, , , , , , 1,2, , , 1,2, ,
s
i i d d
i I
d
i j i i j i j i
r d i i
x z
L L j n
i I i I r t d s
β π
ω β ω
µ π ω ω ε
∈ = − + = ≤ ≤ = ≥ ∈ ∈ = =
∑
∑
The calculation of the above model can obtain the efficiency score of the second stage. Bring the efficiency of the second stage into the formula
* 0 2 2
1
1
θ θ ω θ
ω
′′− ′′ ′′ =
′′
Then, the efficiency value of the first stage is obtained.
Based on the evaluation model constructed, 10 innovation-oriented cities in Yangtze River Delta urban agglomeration like Nanjing, Hefei and Changzhou, Wuxi, Hangzhou, Shanghai etc. is empirically evaluated and the gap between each other and the insufficiency are discovered.
4. Empirical Analysis of Evaluation Model—Taking
Innovation-Oriented Cities in Yangtze River Delta as
Examples
As the most intensified region with innovation-oriented cities in China, the Yangtze River Delta has strong guiding significance for the construction of in-novation-oriented cities in other areas of China. Therefore, this paper focuses on the advantages and existing problems and puts forward some countermeasures and suggestions for the construction of innovation-oriented cities in Yangtze River Delta. The study data are mainly from the Statistical Yearbook of Chinese Cities, the statistical yearbook of each city, the scientific and technological year-book and the public data of the municipal science and technology bureau.
DOI: 10.4236/jamp.2017.59156 1868 Journal of Applied Mathematics and Physics
4.1. Principal Component Analysis
The essence of the principal component analysis is a process of dimension re-duction. It classifies multiple interrelated indicators and extracts the main ingre-dients to reflect the main characteristics of a certain indicators, which is the main way to reduce number of variables. Factor analysis was conducted to test the validity of scales and ensure that questionnaire contents and structure are effective [11]. Through main factor analysis, the multiple variables are adjusted into fewer variables. We cut the relationship between those fewer variables so that they can reflect the information of the indicators to the uttermost. The main approach adopted by principal component analysis is accumulated to explain variance sum. Namely, if the cumulative interpretation variance of the selected principal component is more than 70%, we just keep the extracted principal component as general representative of the indicators. When building the indi-cator system in this paper, a total of three secondary indiindi-cators, 11 third-level indicators and 44 third-level indicators are established. In order to make the data envelopment analysis (DEA) has a simple calculation and a simplified model, we focus on main factor analysis from 11 three-level indicator to 44 four-level indi-cators and extract the variable reflecting a three-level indicator and then explain the variance changes of the third-level indicator to a great extent. Here we will conduct principal component analysis on the four-level indicators from the di-mension of 11 third-level indicators. Since both third-level indicators have de-fects when the intermediary platform constructing their data and the variables of industry-university-research cooperation are relatively small, those two third-level indicators will not be extracted for principal component and the original fourth-level indicators will be kept. The results of principal component analysis via SPSS software are as Table 2.
4.2. Empirical Findings
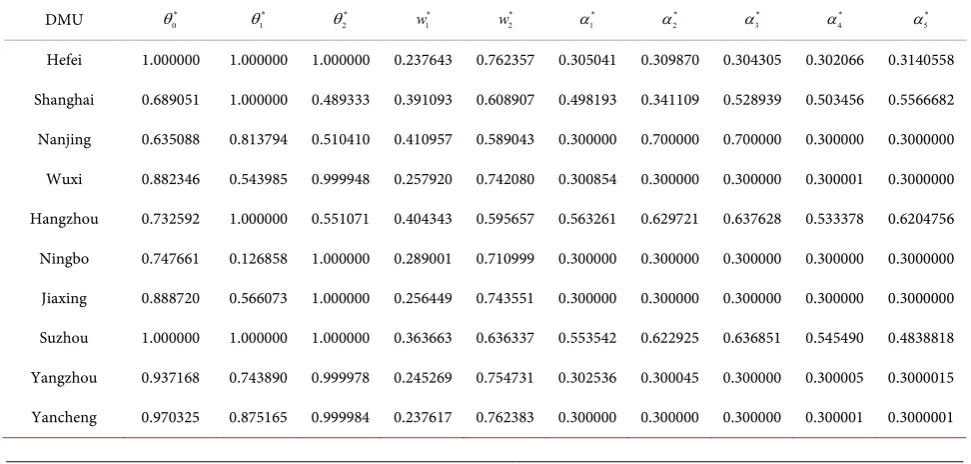
Based on results of principal component analysis, five input indicators, 6 output indicators and 5 intermediate variables are extracted from all indicator variables. They will be evaluated on their innovation efficiency according to the model de-sign. The data is imported into Matlab and the unknown parameters in the model can be solved in an optimization algorithm way. The results are shown in
Table 3 and Table 4.
DOI: 10.4236/jamp.2017.59156 1869 Journal of Applied Mathematics and Physics Table 2. Principal Factors Analysis of Capital Input Indicators.
Total Variance of Interpretation
Indicator’s Name
Initial Eigenvalues Extract and Load Quadratic Sum
Sum Variance % of Accumulation % of Sum Variance % of Accumulation % of
Capital Input Indicator
KMO = 0.79, Chi-Square = 26.69, Sig = 0.000 3.29 82.48 82.48 3.299 82.48 82.48
Innovative Talent Input Indicator
KMO = 0.72, Chi-Square = 24.10, Sig = 0.001 2.822 70.546 70.546 2.822 70.546 70.546
Innovative Environmental Construction Indicator
KMO = 0.648, Chi-Square = 31.56, Sig = 0.000 2.990 59.810 59.810 2.990 59.810 59.810
1.016 20.322 80.132 1.016 20.322 80.132
Innovative Policy Indicator KMO = 0.773, Chi-Square = 54.788,
Sig = 0.000 3.688 92.203 92.203 3.688 92.203 92.203
Innovative Absorption of Diffusion Indicator
KMO = 0.693, Chi-Square = 46.22, Sig = 0.000 3.513 87.813 87.813 3.513 87.813 87.813
Scientific and Technological Innovation Performance Indicator
KMO = 0.747, Chi-Square = 14.74, Sig = 0.002 2.543 84.766 84.766 2.543 84.766 84.766
Economy Development Performance Indicator
KMO = 0.744, Chi-Square = 48.214, Sig = 0.000 2.543 84.766 84.766 2.543 84.766 84.766
Social Contribution Performance Indicator
KMO = 0.640, Chi-Square = 21.989, Sig = 0.001 2.713 67.836 67.836 2.713 67.836 67.836
1.012 25.298 93.134 1.012 25.298 93.134
Innovative Talent Input Indicator 2.246 44.915 44.915 2.246 44.915 44.915
KMO = 0.435, Chi-Square = 24.200, Sig = 0.007 1.813 36.263 81.178 1.813 36.263 81.178
Table 3. Prioritized Efficiency Results of Stage I (CRS).
DMU *
0
θ *
1
θ *
2
θ *
1
w *
2
w *
1
α *
2
α *
3
α *
4
α *
5
α
Hefei 1.000000 1.000000 1.000000 0.237643 0.762357 0.305041 0.309870 0.304305 0.302066 0.3140558
Shanghai 0.689051 1.000000 0.489333 0.391093 0.608907 0.498193 0.341109 0.528939 0.503456 0.5566682
Nanjing 0.635088 0.813794 0.510410 0.410957 0.589043 0.300000 0.700000 0.700000 0.300000 0.3000000
Wuxi 0.882346 0.543985 0.999948 0.257920 0.742080 0.300854 0.300000 0.300000 0.300001 0.3000000
Hangzhou 0.732592 1.000000 0.551071 0.404343 0.595657 0.563261 0.629721 0.637628 0.533378 0.6204756
Ningbo 0.747661 0.126858 1.000000 0.289001 0.710999 0.300000 0.300000 0.300000 0.300000 0.3000000
Jiaxing 0.888720 0.566073 1.000000 0.256449 0.743551 0.300000 0.300000 0.300000 0.300000 0.3000000
Suzhou 1.000000 1.000000 1.000000 0.363663 0.636337 0.553542 0.622925 0.636851 0.545490 0.4838818
Yangzhou 0.937168 0.743890 0.999978 0.245269 0.754731 0.302536 0.300045 0.300000 0.300005 0.3000015
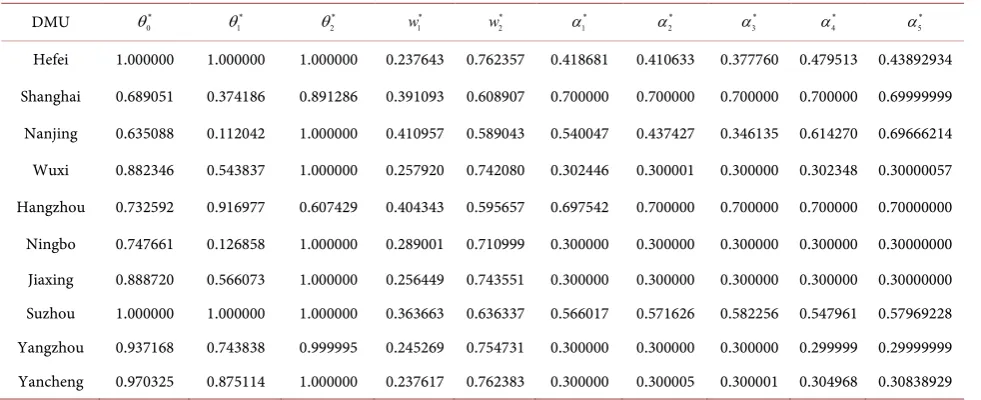
[image:15.595.55.541.507.739.2]DOI: 10.4236/jamp.2017.59156 1870 Journal of Applied Mathematics and Physics Table 4. Prioritized Efficiency Results of Stage II (CRS).
DMU *
0
θ *
1
θ *
2
θ *
1
w *
2
w *
1
α *
2
α *
3
α *
4
α *
5
α
Hefei 1.000000 1.000000 1.000000 0.237643 0.762357 0.418681 0.410633 0.377760 0.479513 0.43892934 Shanghai 0.689051 0.374186 0.891286 0.391093 0.608907 0.700000 0.700000 0.700000 0.700000 0.69999999 Nanjing 0.635088 0.112042 1.000000 0.410957 0.589043 0.540047 0.437427 0.346135 0.614270 0.69666214 Wuxi 0.882346 0.543837 1.000000 0.257920 0.742080 0.302446 0.300001 0.300000 0.302348 0.30000057 Hangzhou 0.732592 0.916977 0.607429 0.404343 0.595657 0.697542 0.700000 0.700000 0.700000 0.70000000 Ningbo 0.747661 0.126858 1.000000 0.289001 0.710999 0.300000 0.300000 0.300000 0.300000 0.30000000 Jiaxing 0.888720 0.566073 1.000000 0.256449 0.743551 0.300000 0.300000 0.300000 0.300000 0.30000000 Suzhou 1.000000 1.000000 1.000000 0.363663 0.636337 0.566017 0.571626 0.582256 0.547961 0.57969228 Yangzhou 0.937168 0.743838 0.999995 0.245269 0.754731 0.300000 0.300000 0.300000 0.299999 0.29999999 Yancheng 0.970325 0.875114 1.000000 0.237617 0.762383 0.300000 0.300005 0.300001 0.304968 0.30838929
The optimal solution of the model, namely the innovative efficiency, is the most direct indicator to show the effectiveness. When θ = 1, a DMU decision-making unit is effective for the DEA. When θ ≠ 1, a DMU decision-making unit is effec-tive for non-DEA.
Therefore, the above table embodies the innovation efficiency value of 10 ci-ties. It can be seen from the data in the table that Hefei and Suzhou overall in-novation performance θ is 1 whether it is the preference of the first stage or the second stage. That shows the city innovation system efficiency DEA is effective and realizes the technology effectiveness. Compared with the above cities, the total innovation efficiency of other cities has not reached 1, which is effective for non-DEA, indicating that there is an unreasonable allocation between innova-tion input and output in the region. On the efficiency results of the first stage preference, the overall inefficiency of Shanghai and Hangzhou is low, mainly due to the low efficiency of the second stage. The efficiency of Nanjing, Wuxi, Ning-bo, Jiaxing, Yangzhou and Yancheng is ineffective on both stages. On the effi-ciency results of second stage preference, the overall ineffieffi-ciency of Nanjing, Wuxi, Ningbo, Jiaxing and Yancheng is ineffective because of the low efficiency of the first stage, while Shanghai, Hangzhou and Yangzhou are ineffective on both stages.
5. Conclusion and Discussion
DOI: 10.4236/jamp.2017.59156 1873 Journal of Applied Mathematics and Physics Seen from empirical results in Yangtze River Delta region, many cities with significant economic efficiency and technological innovation have met a reduc-tion in their innovareduc-tion efficiency after considering social indicators and ecolog-ical indicators. This shows that adjustment of industrial structure should be speeded up and the development of independent entrepreneurship and innovative small and medium-sized enterprises should be encouraged so that social employ-ment opportunities can be improved during the construction of innovation- oriented cities. Simultaneously, enterprises should strengthen their commitment on social responsibility, promote employment through innovation, actively par-ticipate in social welfare and social relief, accelerate the recovery of labor force and lead the unemployed to be re-employed. In addition, accelerate the optimi-zation and upgrading of industrial structure, transform economy growth mode, make full use of technological innovation to cultivate and support new energy industry and improve resource utilization efficiency. We will increase supervi-sion and punishment on enterprises’ pollution discharge, promote the use of energy-efficient equipment and pollution control equipment and accelerate eco-logical civilization construction in cities.
References
[1] Jin, J., Gubbi, J., Marusic, S. and Palaniswami, M. (2014) An Information Frame-work for Creating a Smart City through Internet of Things. Internet of Things Journal, 1, 112-121. https://doi.org/10.1109/JIOT.2013.2296516
[2] Scott, A.J. (2006) Creative Cities: Conceptual Issues and Policy Questions. Journal of Urban Affairs, 28, 1-17. https://doi.org/10.1111/j.0735-2166.2006.00256.x [3] Hekkert, M.P., Suurs, R.A.A. and Negro, S.O. (2007) Functions of Innovation
Sys-tems: A New Approach for Analysing Technological Change. Technological Fore-casting & Social Change, 74, 413-432.
[4] Leydesdorff, L. (2005) The Triple Helix Model and the Study of Knowledge Based Innovation Systems. International Journal of Contemporary Sociology, 42, 12-27. [5] Cowan, R., Jonard, N. and Zimmermann, J.B. (2007) Bilateral Collaboration and the
Emergence of Innovation Networks. Management Science, 53, 1051-1067. https://doi.org/10.1287/mnsc.1060.0618
[6] Huang, Y.L., Lu, J. and Tang, L.R. (2002) The Study on Transforming Achievements of Technological Innovation into Intellectual Property. Soft Science, 53, 101-107. [7] Porter, M.E. (1990) The Competitive Advantage of Nations. Free Press, New York. [8] Hansen, B. (2007) The Innovation Value Chain. Harvard Business Review, 85, 121. [9] Olcay, G.A. and Bulu, M. (2014) Assessing the Role of Technology Transfer Offices
for Being an Innovative City: The Case of Istanbul. Kcws.
[10] Engel, J.S. and Del-Palacio, I. (2011) Global Clusters of Innovation: The Case of Israel and Silicon Valley. California Management Review, 53, 27-49.
https://doi.org/10.1525/cmr.2011.53.2.27
[11] Gronlund, N.E. and Linn, R.L. (1990) Measurement and Evaluation in Teaching. McMillan Company, New York.
Submit or recommend next manuscript to SCIRP and we will provide best service for you:
Accepting pre-submission inquiries through Email, Facebook, LinkedIn, Twitter, etc. A wide selection of journals (inclusive of 9 subjects, more than 200 journals)
Providing 24-hour high-quality service User-friendly online submission system Fair and swift peer-review system
Efficient typesetting and proofreading procedure
Display of the result of downloads and visits, as well as the number of cited articles Maximum dissemination of your research work