Munich Personal RePEc Archive
A new causality test for the analysis of
the export-growth nexus
Furuoka, Fumitaka
Asia-Europe Institute, University of Malaya
15 December 2018
Online at
https://mpra.ub.uni-muenchen.de/91467/
A new causality test for the analysis of the export-growth nexus1
Fumitaka Furuoka Asia–Europe Institute
University of Malaya 50603 Kuala Lumpur, Malaysia Tel (603) 7967-4645, Fax (603) 7954-0799
Email: [email protected]
Abstract
This paper proposes a new causality test or a Fisher-type causality test to examine empirically the export-growth nexus. To empirically demonstrate this new causality test procedure, the Fisher causality test is used to examine the exports-growth nexus in four Asian economies, namely Indonesia, Philippines, Hong Kong and Japan. The new causality test could detected a complex situation in the export-growth nexus in Asia. The Fisher causality test clearly pointed out that there are unidirectional causality from economic growth to exports in Indonesia, bidirectional causality between exports and economic growth in Philippines, no causality relationship between exports and economic growth in Hong Kong and Japan.
Key words:
Exports, economic growth, causality test, Asia
JEL codes F43, C22
1 This analysis used the Ox program. The author is grateful to Professor Jurgen A. Doornik of Oxford University for
1. Introduction
A fundamental question in economics is a cause of economic growth. There is still lacking of adequate understanding of a huge gap and difference between poor and rich countries. In other words, a crucial question still remains: why some countries ended up rich and other countries still remained poor. Two approaches to deal with this unanswered question, namely identifying the determinant of economic growth and examining the process of economic growth. In the first approach, economists generally agree with two main determinants of economic growth, namely capital and technology. Firstly, economic growth could be considered as a consequence of capital accumulation. In this line of reasoning, a higher capital per worker would determine the economic growth. Secondly, economic growth could be considered as a consequence of knowledge accumulation and diffusion. In this line of reasoning, a rapid adaptation of state-of-the-art technology would determine the economic growth. However, these two reasoning could not explain formidable hindrances and obstacle which prevented poor countries from accumulating capital or technology. In other words, there is a sheer number of other elements which would affect positively and negatively economic growth (The Economist, 2018a). An obvious strength of this approach is that this reasoning could offer an interesting insight on macroeconomic regularity for economic growth. On the other hand, due to a complicated nature of economic growth, it could be more difficult for economists to offer a comprehensive microfoundation for the underpinning socio-cultural and political context in the poor countries. In other words, a weakness of this approach is that elegant mathematical formula for growth could be too fancy to dissect a multifaceted heterogeneity of the poor countries around the world.
Despite its prominence in the second approach, the empirical analysis of the export-growth nexus often failed to offer a concrete evidence to prove a significant linkage between export sector and economic growth. The lack of consensus among researchers could be due to the methodological differences in the empirical analysis of the export-growth nexus. In other words, different causality tests would give different and contradictory results on the export-growth nexus (Bahmani-Oskooee and Alse 1993, Giles and Williams 2000a, 2000b, Furuoka, 2018). In order to overcome this methodological problem, the current study proposes to use a new causality test or a Fisher-type causality test to examine the relationship between exports and economic growth. To empirically demonstrate this new causality test procedure, the Fisher causality test is used to examine the exports-growth nexus in Asia.
In other words, the main contribution of the current paper is that it will use a new causality test or a Fisher-type causality test to examine the export-led nexus in Asia. In the line with the Fisher’s suggestion (Fisher, 1932), the Fisher causality test would combine significance levels of different causality tests. There could be two main advantages of this new causality test. Firstly, the Fisher type causality test would offer a better understanding of the export-growth nexus by synthesising methodological strengths of different causality tests. In other words, this new causality test would incorporate systematically advantages of different causality tests into a single causality test. Secondly, the Fisher causality test would yield a conclusive result by scrutinising a relative importance of contradictory findings from different causality tests. This is mainly because this new causality test is able to combine analytically different significance levels from different causality tests.
2. Data and methods
This study uses the Fisher causality test to examine empirically the relationship between real exports (EXP) and real Gross Domestic Product (GDP) in four Asian economies, namely Indonesia, Philippines, Hong Kong and Japan, over the period of 1970-2016. Due to lack of sufficient dataset, other Asian countries are exclude from the empirical analysis. The source of data is the World Development Indicators (World Bank, 2018). In the World Development Indicators database, the time-series data on the exports of goods and services (constant 2010 US dollars) are codified as NE.EXP.GNFS.KD and the time-series data on the Gross Domestic Product (constant 2010 US dollars) are codified as NY.GDP.MKTP.KD. The data were transformed into natural logarithms for the purpose of empirical analysis.
The empirical analysis of current research consist of three stages, namely the unit root test, the conventional causality test and the new causality test. In the first stage of empirical analysis, three different unit root tests, namely the Fourier ADF (FADF) test (Enders and Lee, 2012), the ADF with structural break (ADF–SB) test (Perron and Vogelsang, 1992) and the FADF–SB test (Furuoka 2017), are used to analyse the unit root process of exports and economic growth in Asia. These three unit root tests are based on the following equations (Furuoka 2017):
FDAF test: t
p i i t i t
t y c y
T kt T
kt t
y
1 1 2 1 ) 2 cos( ) 2
sin( (1)
ADF-SB test: t
p i i t i t t B t
t t DU D T y c y
y
1 1 )
( (2)
FADF-SB test: t
p i i t i t t B t
t DU DT y c y
T kt T
kt t
y
1 1 2
1 ) ( )
2 cos( )
2
where yt is the variable of interest, μ is deterministic term, εt is error term, β is the slope coefficient
for the deterministic trend, t is deterministic trend, γ is the slope coefficient for the trigonometric term, π is 3.14159, k is frequency in the Fourier approximation function, sin is the sine operator,
cos is the cosine operator, δ is the slope coefficient for the structural break dummy, DUt 1 if
B
T
t and DUt 0 if otherwise, TB is the breakpoint where structural break occurs, θ is the slope coefficient for the one-time break dummy, D(TB)t 1 if t TB and D(TB)t 0 if otherwise, ρ is
the slope coefficient for the lagged dependent variable, c is the slope coefficient for the lagged differenced dependent variable, p is the lag length which would be set to one due to limited number of observation. To test the hypothesis, the slope coefficients for the lagged dependent variable (ρ) should be non-zero if the time-series on exports or income would not contain a unit root. For this purpose, the t-statistic is used to test the null hypothesis 0 for all three estimation models.
In the second stage of empirical analysis, three standard causality tests, the Granger causality test (Granger, 1969), the Sims causality test (Sims, 1972) and the Geweke causality test (Geweke, Meese and Dent, 1982) are used to examine the causal relationships between exports and economic growth in Asia. These tests were are based on these equations (Geweke, Meese and Dent, 1982; Granger, 1969; Sims, 1972):
Granger causality test:
p i t p i i t i i t i
t LGDP LEXP e
LGDP
1 1
0
(4)
Sims causality test: t
p i i t i t p i i t i
t filtLGDP filtLGDP filtLGDP e
filtLEXP
1
2 1
1
0
(5)
Geweke causality test: t
p i i t i t p i i t i p i i t i
t LEXP LGDP LGDP LGDP e
LEXP
1
2 1
1 1
0
0
(6)
where α0 is the deterministic term, γi, γ0i, γ1i, γ2, βi, are the slope coefficients, et is the error term,
filtLEXPt is the pre-filtered LEXPt and filtLGDPt is the pre-filtered LGDPt, p is the number of lag
length which is set to three due to a limited number of observations and the Akaike Information Criterion (AIC) determined the optimal lag length, the reverse causality from economic growth to exports was estimated by interchanging the LGDP and LEXP in these equations.
In the third stage of empirical analysis, the new causality test or a Fisher-type causality test is used to examine causal relationships between exports and economic growth in Asia. Following the statistical method suggested by Fisher (1932), the Fisher causality test would combine significance levels of any conventional causality tests. In this study, the new causality test would combines significance levels of the Granger causality test, the Sims causality test and the Geweke causality test. The new causality test is based on the following formulate
N i i p 1 ) ln( 2 (7)
where pλ is the Fisher causality statistic that follows the chi-squared distribution with 2N degree of freedom, N is the number of causality tests, π1, π2 and π3 are the significance levels of the
study, N would be equal to three because the new causality test would combine of significant level of three causality tests.
3. Empirical findings
In the first stage of empirical analysis, three different unit root tests, namely the FADF test, the ADF–SB test and the FADF–SB test, are used to examine the unit root process of exports and income in four Asian economies, namely Indonesia, Philippines, Hong Kong and Japan. Table 1 reports the findings from unit root analysis on income. As findings in the table indicate, the FADF test failed to reject the null hypothesis of unit root in income time-series for all these Asian economies, except Japan. The ADF–SB test could reject the null hypothesis for Indonesia and Philippines while the unit root test failed to reject the null hypothesis for Hong Kong and Japan. Furthermore, the FADF–SB test could reject the null hypothesis for all these four Asian economies. These findings from the unit root analysis on income seem to indicate that the income time-series in these economies are stationary process or the I(0).
Table 1: Findings from unit root analysis on LGDP
Name of economies FADF test ADF–SB test FADF–SB test
Indonesia -3.173[1] -8.998***
(1996,0.59)
-13.210***[2] (1996,0.59)
Philippines -3.849[1] -4.354**
(1983,0.29)
-9.070***[1] (1983,0.29)
Hong Kong -2.808[1] -3.181
(1975,0.12)
-4.437*[1] (2005,0.76)
Japan -4.544**[1] -2.746
(1984,0.31)
-5.416**[1] (2004,0.74)
Notes: Numbers in brackets indicate optimal frequency; numbers in parentheses indicate the breakpoint (TB) and break-position (λ); * indicates significance at the 5% level, ** indicates significance at the 1% level; Critical values were obtained from Table 3 (Furuoka, 2017).
Table 2 reports the empirical findings from unit root analysis on exports. As the findings in the table shows, the FADF test failed to reject the null hypothesis of unit root in exports time-series for all these four Asian economies. The ADF–SB test could reject the null hypothesis for all four economies, except Hong Kong. Furthermore, the FADF–SB test is able to reject the null hypothesis for all these four economies. These findings from unit root analysis on exports seem to show that the exports time-series in these four Asian economies are stationary process or the I(0).
Table 2: Findings from unit root analysis on LEXP
Name of economies FADF test ADF–SB test FADF–SB test
Indonesia -3.188[1] -3.859*
(1981,0.25)
-5.383***[1] (1998,0.61)
Philippines -3.531[1] -3.743**
(2007,0.80)
-5.503***[1] (1984,0.31)
Hong Kong -2.934[1] -2.238
(1986,0.36)
-4.548*[1] (1996,0.59)
Japan -2.377[1] -3.497*
(2008,0.82)
-4.813**[2] (2008,0.82)
In the second stage of empirical analysis, three standard causality tests, namely the Granger causality test, the Sims causality test and the Geweke causality test, are used to examine the causal relationship between exports and economic growth in four Asian economies. The findings from these causality tests are reported in Table 3. As empirical findings in the table indicates, the Granger causality test failed to reject the null hypothesis of no causality from exports to income in all four economies. The Sims causality also failed to reject the null hypothesis in these four economies, except Philippines. Furthermore, the Geweke causality test confirmed the findings from the Sims causality test and rejected the null hypothesis only for Philippines. On the other hand, the Granger causality test could reject the null hypothesis of no causality from income to exports in Indonesia and Hong Kong while the causality test failed to reject the null hypothesis for Philippines and Japan. The Sims causality test could reject the null hypothesis for Indonesia and Philippines while the causality test failed to reject the null hypothesis for Hong Kong and Japan. Furthermore, the Geweke causality test failed to reject the null hypothesis for all four economies, except Indonesia. These findings from the three causality test that these three causality tests tend to produce a contradictory finding. In other words, these tests seem to fail to produce a consistent empirical results on the export-growth nexus in Asia.
Table 3: Findings from three standard causality tests
Name of economies
LEXP causes LGDP LGDP causes LEXP
Granger statistics
Sims statistics
Geweke statistics
Granger statistics
Sims statistics
Geweke statistics Indonesia 0.424[1] 0.318[2] 0.370[3] 6.811***[3] 52.730***[1] 11.646*[1]
Philippines 1..477[2] 6.599***[2] 3.282**[2] 2.024[1] 6.553*[2] 1.625[2]
Hong Kong 0.126[1] 2.468[1] 1.411[1] 4.715**[2] 0.001[1] 0.854[2]
Japan 0.561[1] 0.273[3] 1.414[1] 0.940[1] 0.765[3] 0.146[1] Notes: * indicates significance at the 10% level; ** indicates significance at the 5% level;
*** indicates significance at the 1% level; numbers in parentheses indicate the optimal lag length.
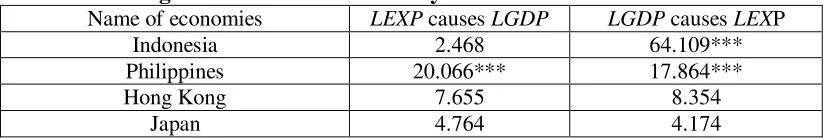
In the third stage of empirical analysis, new causality test or a Fisher-type causality test is used to examine the causal relationship between exports and income in four Asian economies. The Fisher causality test failed to reject the null hypothesis of no causality from exports to income in all these four economies, except Philippines. Furthermore, the Fisher causality test could reject the null hypothesis of no causality from income to exports for Indonesia and Philippines while the new causality test failed to reject the null hypothesis for Hong Kong and Japan. The empirical findings from the Fisher causality test clearly indicate that there are unidirectional causality from income to exports in Indonesia, bidirectional causality between exports and income in Philippines, no causality between exports and economic growth in Hong Kong and Japan.
Table 4: Findings from the Fisher causality test
Name of economies LEXP causes LGDP LGDP causes LEXP
Indonesia 2.468 64.109***
Philippines 20.066*** 17.864***
Hong Kong 7.655 8.354
Japan 4.764 4.174
[image:7.612.72.487.599.669.2]The summary of empirical findings from three standard causality tests and the Fisher causality test are reported in Table 5. The methodological advantage of the Fisher causality test clearly are clearly highlighted in this summary. Firstly, three standard causality tests consistently detected the unidirectional causality from economic growth to exports in Indonesia. These finding on the export-growth nexus in Indonesia was confirmed by the Fisher causality test. Secondly, three standard causality tests also consistently pointed out that there is no causality between exports and economic growth in Japan. These findings on the export-growth nexus in Japan was confirmed by the Fisher causality test. Thirdly, three standard causality tests failed to produce a consistent findings on the export-growth nexus in Philippines. The Granger causality test showed that there is no causality between exports and economic growth in Philippines. By contrast, the Sims causality test indicated the bidirectional causality between exports and economic growth in Philippines while the Geweke causality test detected a unidirectional causality from exports to economic growth in the country. The Fisher causality test confirmed the findings from the Sims test and indicated the bidirectional causality between exports and economic growth in Philippines. Finally, three standard causality tests also failed to produce a consistent findings on the export-growth nexus in Hong Kong. The Granger causality test detected a unidirectional causality from income to export in the economy. By contrast, the Sims causality test and the Geweke causality test showed that there is no causal relationship between exports and economic growth in Hong Kong. The Fisher causality test confirmed the findings from the Sims causality test and the Geweke causality test and indicated that there is no causal relationship between exports and economic growth.
Table 5: Summary of empirical findings
Name of economies Granger causality test
Sims causality test
Geweke causality test
Fisher causality test
Indonesia GDP→EXP GDP→EXP GDP→EXP GDP→EXP
Philippines GDP−EXP GDP↔EXP EXP→GDP GDP↔EXP
Hong Kong GDP→EXP GDP−EXP GDP−EXP GDP−EXP
Japan GDP−EXP GDP−EXP GDP−EXP GDP−EXP
Notes: EXP→GDP indicates a unidirectional causality from exports to economic growth. GDP→EXP indicates a unidirectional causality from economic growth to exports. GDP↔EXP indicates bidirectional causality between exports and economic growth. GDP−EXP indicates no causality between exports and economic growth.
4. Conclusion
References
Bahmani-Oskooee, M. & Alse, J. (1993). Export Growth and Economic Growth: An Application of Cointegration and Error-Correction Modelling. Journal of Developing Areas, 27: 535–542.
Geweke, J., R. Meese and W. Dent. 1982. “Comparing Alternative Tests of Causality in Temporal Systems: Analytic Results and Experimental Evidence”. Journal of Econometrics, 21:
161–194.
Granger, С. 1969. “Investigating Causal Relationship by Econometric Models and Cross-spectral Methods”. Econometrica, 37: 424–438.
Giles, J.A. & Williams, C.L. (2000a). Export Led Growth: A Survey of the Empirical Literature and Some Non-Causality Results. Part 1. Journal of International Trade & Economic Development,
9: 261–337.
Giles, J.A. & Williams, C.L. (2000b). Export Led Growth: A Survey of the Empirical Literature and Some Non-Causality Results. Part 2. Journal of International Trade & Economic Development,
9: 445–470.
The Economist (2018a). “Root and branch”, dated on 14 April 2018, p.67.
The Economist (2018b). “A hard place”, dated on 3 November 2018, p.66.
Enders, W. & Lee, J. (2012). The Flexible Fourier Form and the Dickey-Fuller Type Unit Root Tests. Economics Letters, 117: 196–199.
Fisher, R. (1932). Statistical Methods for Research Workers. London: Oliver and Boyd.
Furuoka, F. (2017). A New Approach to Testing Unemployment Hysteresis. Empirical Economics, 53: 1253–1280.
Furuoka, F. (2018) Exports and economic growth in Sub-Saharan Africa: New insights from innovative econometric methods, Journal of International Trade & Economic Development, 27: 830–855.
Perron, P. & Vogelsang, T.J. (1992). Non-stationarity and Level Shifts with an Application to Purchasing Power Parity. Journal of Business & Economics Statistics, 10: 301–320.
Sims, C. 1972. “Money, Income and Causality”. American Economic Review, 62: 540–552.