Munich Personal RePEc Archive
Did Central Banks apply the right
strategies after the financial crisis?
De Koning, Kees
15 November 2017
Online at
https://mpra.ub.uni-muenchen.de/82751/
Central banks strategies after the financial crisis© Drs Kees De Koning
____________________________________________________________________________________________
Did Central Banks apply the right strategies after the
financial crisis?
By
Drs Kees De Koning
15 November 2017
Central banks strategies after the financial crisis© Drs Kees De Koning
Table of contents Page
Introduction 3
1. Nearly all banks were rescued in 2008 4
2. How did the banking and financial sector develop after 2008 6
3. How did the U.S. household’ mortgage-borrowing crisis develop 8
over the last two decades 4. Some further considerations 12
4.1 The income-house price gap illustrated 12
4.2 The adjustment process 14
4.3 Policy actions after the financial crisis 16
5. Why did central banks not foresee the financial crisis? 17
6. A possible solution: a liquidity scheme for households 19
Central banks strategies after the financial crisis© Drs Kees De Koning
Introduction
Nearly ten years have past since the last financial crisis occurred, making it easier to reflect on whether the policies applied by the Federal Reserve, the Bank of England and the ECB had the intended effect on restoring economic and financial stability.
While stability has in time been restored, it has not been restored for all. Was it a stability action plan for the banking sector, for the financial markets generally or for the collective of individual households?
This question matters as the possible solutions are quite different for each sector of an economy.
In a previous paper: “Why it makes economic sense to help the have-nots in times of a financial crisis” the author highlighted three interrelated issues. The first one was timing. In the U.S. a (mortgage) borrowers’ crisis occurred in 2003, when the income and house price gap forced new borrowers to accept an amount of a mortgage loan far exceeding their income earnings growth over the period 1996-2003. The second issue was the macro-economic volume of lending. Between 1996-2007 there was a strong correlation between the volume of mortgage lending and the increases in house prices in the U.S. – not wholly surprising. The third issue was that mortgage lending volumes were not kept in line with average income growth over the period 2000-2007, which had already from 2006, resulted in a rapidly increasing level of foreclosure filings, completed foreclosures and home repossessions. By 2007-2008 the resultant financial crisis had occurred.
In 2008, the threat to the banking sector forced central banks to come to their rescue.
The solutions chosen: Liquidity supply, Quantitative Easing, lowering of interest rates to historical lows, reform of banking supervision, and legal reform in the case of the U.S. in the shape of the Dodd-Frank Act.
The banking sector and the financial sector both benefitted from these measures. The collective of individual households did not. They were under tremendous pressure to pay back the mortgage loans, which the U.S. banking sector had so recklessly granted them. The lowest interest rates on record failed to entice them to borrow more, neither in mortgages or consumer loans.
Central banks strategies after the financial crisis© Drs Kees De Koning
1. Nearly all banks were rescued in 2008
Whether it was in the U.S., the U.K. or in Europe under the guidance of the ECB, banks were rescued by the central banks with few exceptions. As Ben S. Bernanke described in a number of lectures about the Federal Reserve and the financial crisis1, the response of the Fed was to “calm a financial panic as a lender
of last resort”.
How did the U.S. banking system got into its liquidity problems in the first place? Three developments can be highlighted. The first one was the rapid growth of mortgage lending in the U.S. over the period 1996-2007 and the subsequent substantial increases in house prices. The second development was the softening in the quality standards of the mortgages granted. Prior to the early 2000s, homebuyers were required to make a significant down payment (10% or more) in order to obtain a mortgage. They also had to provide evidence of their income and assets situation. Especially from 2004 and later years, so-called subprime mortgages were granted to households who no longer needed to provide evidence of income and assets (self-certification) and were offered a much lower or even no down payment. Low start-up interest rates –below market rates- were also offered to entice more borrowers. The third development was that, on a large scale, U.S. investment banks started to get involved in the U.S. mortgage market, not just by funding and holding on to mortgages themselves, but by creating Collaterised Debt Obligations (CDOs) and derivative related products which were sold around the world. CDOs had credit ratings attached to them from top U.S. credit rating agencies which nearly all turned out to be erroneous.
The volume of lending per time period, the softening of lending standards and the internationalization of an initially U.S. domestic product like home mortgages were the causes of the crisis. The fact was that a mortgage borrowers crisis preceded the financial crisis by some four years and the authorities failed to act on it. The fact that in 2006 the level of foreclosure filings had increased by 65% over 2004 did not prompt to any discernable action by the authorities either. A self-correction of a boom period was regarded as a healthy solution to an overheated market. Only when a serious banking crisis appeared in 2008, were the authorities minded to act.
The U.S. banking sector was ill prepared for a rapid increase in doubtful mortgage debtors. The most vulnerable were some of the big brokerage houses, which, by 2007, had debt to capital ratios of 32 to 12. Also undercapitalized were
Freddie Mac and Fannie Mae, state sponsored enterprises, which specialized in providing long term funding for home mortgages.
1 https://press.princeton.edu/titles/9928.html
Central banks strategies after the financial crisis© Drs Kees De Koning
Lehman Brothers filed for bankruptcy on September 15, 2008. With assets of over $600 billion and a capital base of only $22.5 billion, the firm was unable to absorb the losses on its activities in the U.S mortgage markets. It became the largest bankruptcy case in U.S. history.
Fannie Mae and Freddie Mac were rescued in that the U.S. government guaranteed their mortgage bond obligations. Many banks were helped with liquidity support and some of the U.S. brokerage houses were taken over by U.S. banks; nearly all with support from the Fed. Even an insurance company, AIG, had to be rescued as they had issued guarantees and taken billions of dollars from credit default swaps, which provided insurance against the failure of mortgage bonds and CDOs.
In Europe, on 9th August 2007, BNP Paribas of France announced that it had
stopped trading in three of its investment funds exposed to the U.S. sub-prime mortgage markets as the liquidity in these markets had all but dried up. This date is widely taken as the starting date of the financial crisis.
In the U.K. Northern Rock, a building society, experienced funding problems for its mortgage book very soon after BNP Paribas announced its actions. On 14th
September 2007, it had to call on the Bank of England to ask for liquidity support, which was granted. A few days earlier, Northern Rock had experienced a run on its branches, the first ever for over 150 years in British banking history. Northern Rock’ balance sheet was unlike the one for most other building societies in that it relied for more than 70% on wholesale money markets for funding its mortgage portfolio. Most other U.K. building societies funded themselves mainly through customer deposits; the latter have a tendency to be less volatile than short-term interbank funding. The U.K. government decided to nationalize Northern Rock on 22nd February 2008.
Another building society, Bradford and Bingley, also experienced funding problems and the U.K. government took over the loan book and sold the branch network and its deposits to Bank Santander U.K.
The bigger problems were still to come in the U.K. in the form of Royal Bank of Scotland and Lloyds Bank. On the 12th October 2008, both were taken over with
Central banks strategies after the financial crisis© Drs Kees De Koning
In Spain some of the Caja’s – savings banks – suffered financial problems, as did some banks in Germany, Iceland, Ireland, Portugal, Italy and Greece.
In their liquidity support actions, the Fed, the Bank of England and the ECB all played their part, not only in supporting domestic banks, but also cross-border through currency swaps as overseas banks and their customers needed U.S dollars for their funding.
2. How did the banking and financial sector develop after 2008?
Central bankers and governments were quite taken aback with the financial market philosophy at the time. The bankers’ philosophy was that central banks and governments would be drafted in if banks got into problems. Some ten years ago, the “Too big to fail” philosophy was strongly prevalent.
In an extensive report: “A decade of change in capital markets; an analysis of what has and hasn’t changed in the capital markets industry since 2006”3, the
authors came to a number of conclusions:
• The biggest banks in the world have got bigger but less profitable over the past ten years. Assets are up by more than a quarter in real terms, but profitability has dropped by a third. The world’s 20 biggest banks have grown faster, with assets increasing 40% in real terms. Most of this growth has been in Asia, especially China; in Europe banks have shrunk significantly relative to GDP. Banks are safer and have more than twice as much capital today (depending on which measure you use).
• Investment banks have fared worse than any other sector of the industry through the financial crisis. Revenues have dropped by a third and pretax profits have nearly halved in real terms, while return on equity has plunged by more than two thirds. Costs have only fallen by 15% and for all the job cuts headcount is only down by a few percent.
• The asset management industry has emerged from the financial crisis relatively unscathed. Assets under management have increased by a quarter, but outside of the U.S, assets have shrunk relative to GDP. The industry is only marginally less profitable today than it was a decade ago.
3 “ A decade of change in capital markets’ by William Wright and Panagiotis
Central banks strategies after the financial crisis© Drs Kees De Koning
• In virtually every sector in the capital markets (most notably with banks and in the corporate bond and IPO markets) there has been a clear shift in the balance of power over the past decade from shrinking markets in Europe to faster growing markets in Asia. U.S. markets have also grown in real terms and relative to GDP.
• The pools of long-term capital such as pensions and insurance assets have grown in real terms but have struggled to keep up with rising GDP outside of the U.S., particularly in Asia. Meanwhile, high net worth individuals have got wealthier.
• Investors and issuers have shifted significantly from equities to bonds over the past decade. Stock markets have shrunk relative to GDP in every region outside the U.S., but global corporate and government bond markets have grown by two thirds in real terms.
• IPO activity has halved in real terms over the past decade but corporate bond issuance has more than doubled in real terms. Global M&A activity has shrunk by a third relative to GDP and investment banking fees have dropped by a quarter in real terms.
• Trading volumes have continued to rise over the past decade. Relative to GDP, equity trading and corporate bond trading have increased by more than a quarter, while derivatives and FX trading have increased in real terms by around a fifth. Exchanges have benefited from this growth: they are the only sector to emerge from the crisis both bigger and more profitable.
• Hedge funds, private equity and venture capital have flourished over the past decade with a surge in assets under management in real terms of between 70% and 110%. The persistence of high fees has not been matched by performance (except for venture capital).
Central banks strategies after the financial crisis© Drs Kees De Koning
3. How did the U.S. household’ mortgage borrowing crisis develop over the last two decades?
Unlike the banking and the larger financial sector, the household sector had no support in dealing with its financial problems when they occurred from 2003 onwards.
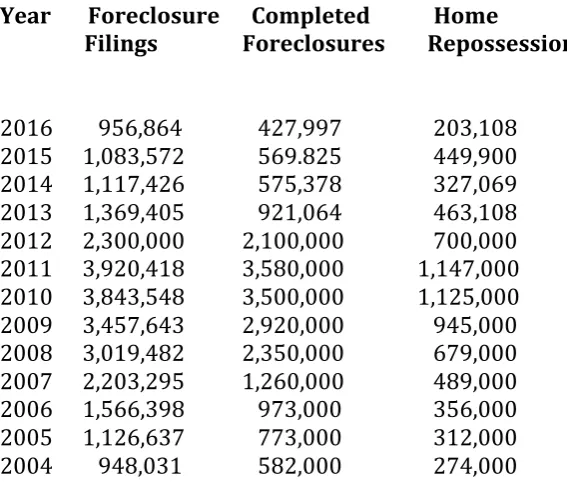
[image:9.595.86.512.473.745.2]Two tables can demonstrate the predicament of what happened to mortgage borrowers in the U.S.. The first table deals with volume growth in new mortgage lending per time period, new housing starts, actual average house prices, median nominal incomes and the affordable house prices based on nominal income growth. The table covers the period 1996-2016. The second table sets out the effects on households when they got into payment difficulties: the foreclosure filings, completed foreclosures and home repossessions over the period 2004-2016.
Table 1: The developments of the volume of mortgage lending, the annual housing starts, the average U.S. home sales price, the nominal median income of households and U.S. home sale prices based on such incomes
Year
1 Volume of Home mortgage
Lending X U.S.$ billion
2 Annual Housing starts X thousands 3 Average U.S. Home sales price X U.S. dollars
4 Median Household
Nominal Income X U.S. dollars
5 Income Affordability
House price X U.S. dollars 1996 329 1,370 166,400 35,492
Central banks strategies after the financial crisis© Drs Kees De Koning
Table 2: Foreclosure filings, foreclosures and home repossessions in the U.S. 2004-20164
Year Foreclosure Completed Home
Filings Foreclosures Repossessions
2016 956,864 427,997 203,108 2015 1,083,572 569.825 449,900 2014 1,117,426 575,378 327,069 2013 1,369,405 921,064 463,108 2012 2,300,000 2,100,000 700,000 2011 3,920,418 3,580,000 1,147,000 2010 3,843,548 3,500,000 1,125,000 2009 3,457,643 2,920,000 945,000 2008 3,019,482 2,350,000 679,000 2007 2,203,295 1,260,000 489,000 2006 1,566,398 973,000 356,000 2005 1,126,637 773,000 312,000 2004 948,031 582,000 274,000
In a paper by this author: “Why it makes economic sense to help the have-nots in times of a financial crisis”5, it was argued that there are two methods to measure
the affordability of home mortgages: the income-based method and the market based one.
The income-based method takes as a base year 1996 and subsequently calculates the mortgage amount a median income household can incur in following years on basis of nominal income growth. If incomes grow, mortgage amounts can grow in line with such income growth. The main characteristic of the income-based method is that the percentage of income available for consumption of other goods and services does not fluctuate much over time.
The market-based method is based on the actual average U.S. home sales price. This price is the result of the demand for housing -as owner-occupier or as renter- and the supply delivered by the homebuilders. A major factor in this supply and demand equation is the volume of funds made available by the banking sector.
In 2003, for instance, the market -based price of an average home was 5.68 times the nominal median household income as compared to 1997, when it was 4.76.
Central banks strategies after the financial crisis© Drs Kees De Koning
The latest available data for 2016 showed that this ratio has further deteriorated to 6.49 times. In the U.K. the house price to earnings ratio is currently at 7.2 times, which is almost at a record high. However, unlike in the U.S., many U.K. households are on a variable mortgage rate.
For households to commit to pay back an amount equal to at least 6 years of 100% of their income over a 30-year time period is an enormous decision and it is way too important to have bankers undermine such decision by excessive lending practices, either in volume or in softening terms and conditions.
As an example, by 2003, new U.S. mortgage borrowers had to borrow an additional $43,211 to acquire a home, compared to 1997 borrowers as the market price had grown faster than the income-based method would allow. For the 2003 homebuyers this was equal to a year’s gross income. If households can afford to spend 40% of their income on housing costs, the additional debt burden translates in 2.5 times the amount which equals $108,000 in future income and debt commitments.
The fact that the average mortgage borrower in 2003 had to spend substantially more on servicing a mortgage debt then a similar household in 1997, had substantial consequences for the 2003’s households’ group ability to spend on other goods and services. The average income growth for households buying a home in 1997 and 2003 were similar. This leads to the conclusion that the 2003 mortgage borrowers were left with less disposable income after mortgage debt servicing than the 1997 group of households. This erosion of income levels had already started in 1999 and by 2003 the actual average house sale price exceeded the income based affordability house price by 21.27%. No action was taken to stop this erosion in disposable income levels, therefore by 2007, the 2007 homebuyers group had to incur an extra debt of 1.5 times their annual median income level to get on to the housing ladder compared to the 1997 group of buyers. The groups of households affected by income erosion grew with every passing year from 1999.
The buffers were reached for at least 1.56 million households by 2006 as table 2 illustrates. These buffers increased substantially for larger and larger groups of households from 2007-2011. Only by 2012 did the numbers start to drop of. Only by 2016 did the number of foreclosure filings equal the numbers of 2004, a twelve-year adjustment period, but the adjustment came at a substantial cost to the homeowners.
The fact is that not only home mortgage borrowers, but also renters were affected in their disposable incomes. This is well illustrated in the annual report
Central banks strategies after the financial crisis© Drs Kees De Koning
on the: “State of the Nation’s Housing 2017” published by the Joint Center for Housing Studies of Harvard University6. On renters it states:
“By the Housing Vacancy Survey’s count, the number of renter households rose by 600,000 from 2015 to 2016, marking 12 consecutive years of growth and lifting net growth since 2005 to nearly 10 million.Although still solid, the level of renter growth in 2016 did represent a sharp deceleration from the previous two years.
Some 43.3 million households currently rent their housing, including more than 80 million adults and families with over 30 million children. The renter share of US households now stands at a 50-year high of 37 per cent, up more than 5 percentage points from 2004, when the homeownership rate peaked.
The surge in rental demand that began in 2005 is broad-based and includes several types of households that traditionally prefer homeownership—in particular, older adults, families with children, and high-income households. These changes reflect a number of factors, including the fallout from the mortgage foreclosure crisis as well as larger demographic shifts, particularly the ageing of the US population.
Indeed, older households aged 55 and over accounted for fully 44 per cent of renter household growth between 2005 and 2016. As a result, the share of renters in this age group increased to 27 per cent last year—up from 22 per cent in 2005. Renters under age 35 were responsible for the next largest share of growth (25 per cent), driven primarily by their delayed entry into the home buying market. Meanwhile, households in the 35–44 age range -the group that experienced the sharpest drop in home-ownership after the housing crash-contributed 14 per cent of renter household growth in 2005–2016 despite a net loss of households in this age range.
Families with children are also increasingly likely to rent rather than own their homes. The share of these households living in rental housing jumped from 32 per cent in 2005 to 39 per cent in 2016, accounting for 22 per cent of renter household growth over this period. The large increases in renting among families with children reflect high rates of foreclosure-induced exits from homeownership in combination with lower rates of home buying since the Great Recession. As a result of these shifts, the share of children living in rental housing climbed from 29 per cent in 2005 to 36 per cent in 2016.”
Central banks strategies after the financial crisis© Drs Kees De Koning
One may conclude from the above that the rental group of households were under the same income pressures as the owners groups, especially from 2005 onwards. Whether affected by an income-house price gap for new homeowners using a mortgage, or renting a home when house prices and rents were going up faster than incomes, both groups suffered the same deterioration in their disposable income levels. The most pronounced were the effects on the lower income classes as the 2017 State of the Nations Housing study illustrates.
4 Some further considerations
4.1 The income-house price gap illustrated
[image:13.595.86.531.404.662.2]Probably the best way to illustrate the income-house price gap is with the help of table 3. Table 3 sets out the costs of a 30 year fixed rate mortgage as provided by Freddie Mac, with a 10% down payment and an equal annual instalment for the principal amount.
Table 3: A comparison between the costs of an income and a market based house price
Year Interest
rate %
House Price U.S.$
Down Payment U.S.$
Interest Plus Principal U.S.$
Median Nominal Income U.S.$
Percent Of Income %
1997 7.60 173,494 17,349 17,092 37,005 46.2
2003* 5.63 203,089 20,309 16,384 43,318 37.8
2003** 5.63 246,300 24,630 19,869 43,318 45.9/55.8
2006* 6.41 226,025 22,603 19,820 48,201 41.1
2006** 6.41 305,900 30,590 26,824 48,201 55.7/72.2
*Indicates an income based house price
** Indicates market based house price
Central banks strategies after the financial crisis© Drs Kees De Koning
property ladder. In 2003, the income based house price method would have required a household to come up with $36,693 in order to buy an averaged priced home. For the next 29 years the outlay would have been $16,384. Based on the market based average home sales price, the outlay for a family would have been $44,499 in 2003 and $19,869 thereafter. For 2006, the income-based method would lead to an outlay of $46,423 in that year, while the market-based house price would have required $57,414 plus $7,004 more than the income based method for mortgage servicing interest and principal for the next 29 years.
Incomes can only be spent ones. If an income is allocated to buy a home, it cannot be spend on other goods and services. Therefore the costs of acquiring and servicing the debt for a home, restricts homebuyers in their disposable incomes to acquire other goods and services. Renters are also affected as rents follow the market values of homes in many cases.
The character of savings used for a down payment for acquiring a home is different from freely available savings in bank accounts or other liquid market instruments. Savings allocated to down payments are locked up in the value of a home; they are no longer accessible for instant consumption. If a homeowner wants to allocate such savings for consumption purposes, the house needs to be sold; but another place to live will need to be found instead, with all costs attached to it. The down-payment savings also do not get rewarded in the usual way of having an interest rate paid or receiving a dividend. The cash-out-flow is clear when it happens, but the cash-inflow is uncertain and cannot easily be converted into consumption, unless the homeowner gets a substantial income increase from other sources, like employment. There is another major difference with ordinary savings. Once the down payment is made from the buyer to the seller and the lender transfers the remainder sum to the seller, the mortgage contract will stipulate that any future home sale proceeds will first have to be used to settle the mortgage loan, before any money is transferred back to the home owner. In other words, the down-payment savings are subordinated to the lender’s legal claims.
It is for this reason that in table 3, the difference between the down-payment cash outlay between the income-based method and the market-based one, has been added as an extra cost. The result shows that the market-based method already requires 55.8% of the annual income of the homebuyer in 2003 and 72.2% by 2006
Central banks strategies after the financial crisis© Drs Kees De Koning
In the comparisons used in the Harvard’s State of the Nations Housing Study 2017, utility costs are included as part of the housing costs. If this were done for the median household in above example, in 2003, the allocation to housing costs (mortgage plus utilities) would well have exceeded 60% of their annual income, putting them in the “severe burdened” category of households.
The 30-year mortgage rates as charged by Freddie Mac did not come down until 2009. The rates were 5.84% in 2004, 5.87% in 2005, 6.41% in 2006, 6.34% in 2007 and 6.03% in 2008. What did come down was the short-term effective Fed funds rate, but the short-term rates diverged strongly from the long term ones in 2002, 2003, 2004 and 2005. The short-term rate hikes in 2006 and 2007 made very little difference to the 30 year fixed rates.
The conclusion to be drawn from the above is that when the margin between market-based house prices and income-based ones diverge, with the earlier ones growing more rapidly than the latter ones, whole sections of households are worse off than their counterparts who bought homes in earlier years: worse off means in this case, having less disposable income available for general consumption purposes. Such a shift negatively affects current and future economic growth levels.
4.2 The adjustment process
The Bank of England in its latest 2017 Financial Stability Report7 has developed
a diagram of a “self-reinforcing feed back loop”. It shows the potential relationship between an adverse house price fall, its collateral effect, the reaction of the banking community in reducing the supply of credit, the expectation of further house price drops and “fire sales” and the reinforcement of a house price shock.
Central banks strategies after the financial crisis© Drs Kees De Koning
The adverse shock in the case of the U.S. housing markets occurred already from 2003 to 2007, when the volume of mortgage lending and the softening of lending standards led to households being exposed to new mortgage loans, nearly all exceeding their growth in income levels. By 2006 the level of foreclosure filings was up by 65% over 2004. This process continued to well into 2012, before the levels dropped below the 2006 levels. Average U.S. home sales price reached their peak in 2007 at $313,600, dropped to $263,400 in 2011 and only by 2013 exceeded the 2007 peak for the first time since the financial crisis when they reached $319,300.
The phenomenon of the substantial drop in new housing starts commenced in 2007 when new starts dropped to 1.037 million from the level of 2006 of 1.649 million. By 2008 new housing starts dropped to 560 thousand and hovered around this figure to 2011. Only by 2016 did this level return to 1.226 million, which was still below the 1996 level, some 20 years earlier.
The most disturbing statistic is the number of home repossessions. Between 2006 and 2014 in total 6.23 million homes were repossessed. This is more than the five years total of new housing starts between 2012 and 2016. It is all the more disturbing as the need for new homes is based on population growth and some other factors as family size and location issues. The U.S. population growth level between April 2010 and April 2017 was 16.029 million people, or
Central banks strategies after the financial crisis© Drs Kees De Koning
translated into households of 3.14 persons per household as 5.1 million new households over this period.
The home repossessions had a dramatic impact on house price levels and on new housing starts and of course on the financial status of nearly all households at or below the median income level.
The main conclusion about the adjustment process is that it was based on contract law – the laws covering home mortgages – rather than on economic measures.
4.3 Policy actions after the financial crisis
• Lowering of interest rates. The objective of increasing or lowering short-term interest rates is to slow down or speed up economic activity. When rates come down, on the supply side, such action helps producers to reduce costs and perhaps expand production capacity. On the consumer demand side, the situation is completely different. The households that have an income of say more than twice the median nominal income level, would in most cases not enter into a loan agreement for buying consumer goods, irrespective of the level of short-term interest rates. The groups of households with an income of less than twice the median level may resort to short-term borrowings. In line with the income–house price gap situation, between 2003 and 2007, mortgage borrowers were in too parlour a state to enter into any borrowings on top of their existing obligations and so were the renters. Added to this, more than 7 million people lost their jobs between June 2006 and October 2009. That group was also in an equally unable to borrow their way out of financial problems. In respect of the lowering of the long-term rates the corporate sector switched from issuing equity capital to corporate bonds over the years after 2008. The collective reaction from the household sector to the lower interest rates rather than economy-boosting actions was to retrench and reduce the level of outstanding mortgage debt to the tune of $1.28 trillion over the period 2008-2014, or nearly 12% below its peak in 20088. The total level of consumer borrowings came down $2.643
trillion in Q3 2008 to $2.478 trillion in Q2 2010. Only by Q2 2011 it regained the level of Q3 20089.
Clearly, the effectiveness of an interest rate drop in achieving its core objective -both long and short-term rates- depends heavily on the level of indebtedness of households at a median and lower income level and how these households were affected by the income gap created by the diverging market and income based house prices.
Central banks strategies after the financial crisis© Drs Kees De Koning
• Liquidity supply: this helped banks and some insurance companies as in the U.K., where a £50 billion rescue package was devised. It was however aimed at and limited to the financial sector. No liquidity supply system was in operation for individual households.
• Quantitative easing: the act of buying up government debt and, as in the U.S., also mortgage bonds, provided relief but principally for investors holding such bonds. Of course, it helped governments also in funding their debts. For companies it was a reason to lean toward issuance of company bonds rather than more equity. For households in debt or having taken on new debt in the form of mortgages before 2007, their financial status had deteriorated so much that the lowering of long-term interest rates on mortgages was of no use. Added to this, the U.S. unemployment rate more than doubled between June 2006 when the unemployment rate was 4.6% and October 2009 when it became 10.0%. It took until November 2016 before the unemployment level returned to 4.6%. What has been poorly documented has been the correlation between unemployment rates and foreclosure proceedings. In April 2006 the actual number of unemployed (for 15 weeks or longer) was 2.083 million persons. By April 2010 it had risen to 9.130 million. More than seven million people were laid off during this period. If studies are right, in that 45% of unemployed could no longer afford their mortgage payments, then over 4 million foreclosures can already be explained from this cause alone.
The U.S. situation evolved in exactly the manner as spelled out by the Bank of England’s feedback loop.
5. Why did central banks not foresee the financial crisis?
Central banks strategies after the financial crisis© Drs Kees De Koning
House prices are the result of how much money is allocated to the buying power for homes. By 2003, the volume of new mortgage lending had increased by 326% over the level of 1997. This increase in buying power, strongly enhanced by the volume of new mortgages granted, did not result in the volume of new housing starts to go up with anything like the 326%, in effect the new housing starts increased by 31%, very respectable in its own right, but far from the money side of 326%. As a consequence in 2003, house prices, were, on average, $43,211 more than the income-based price could afford. For a median household income, it meant that an increase of 100% of a one-year median nominal income had to be financed.
Such a claim on household’s incomes does not come for free. It meant that home buyers and renters in 2003, were a lot worse off in terms of freely disposable income than their counterparts in 1997. This is especially true for households at or below the median income level.
The deterioration in disposable incomes was a gradual process as tables 1 and 3 indicate.
What should be stated is that in 2003, U.S. based banks and other finance companies competed for their mortgage loans to be accepted by the buyers. No single bank was responsible for the collective lending level that was reached in 2003. All banks together were responsible for the level of lending. Competition between banks, added with incentive schemes for bank employees who sold the most mortgages, does not square easily with an income-based lending policy.
One may wonder whether competition between banks will ever lead to an income-based approach being applied. The experience of 2004-2008 in the U.S. does not create confidence as softer and softer terms and conditions were accepted in order to get households to sign up to mortgages. The spike in sub-prime mortgages started in 2004 and lasted to 2007. It could not have come at a worse time for individual households and for the U.S. economy as a whole. The internationalisation of the funding sources for U.S. home mortgages spread the risks around the world. The “Great Recession” spread its tentacles around the globe.
Dr. Bernanke describes in his book: “The Courage to Act”10, how divided the U.S.
regulatory authorities were in 2008 and that no single authority had responsibility for the banking and financial sector as a whole. Authorities have changed, but one can still wonder whether the Fed has the tools today to stop a new wave of sub-prime mortgages. It could be argued that the quality of the current level of “normal” mortgages at 6.49 times the median nominal income could pose
Central banks strategies after the financial crisis© Drs Kees De Koning
a threat to future economic growth levels. Prime and sub-prime are relative terms!
There is another element worth mentioning: the Phillips curve linking the level of employment with the rate of (consumer price) inflation. Central banks in their models have been guided by this curve. However since 2008, the results of this link have been very mixed and as a consequence many economists have expressed their doubts about the continued relevance of the curve. Perhaps the curve should be rephrased in that rather than two elements to be considered: the pull and the cost-push ones, a new element is added: the demand-income gap option.
The latter option occurs when the market price of homes exceeds the income based home price over time, causing households incomes available for consumption to slow down as a higher percentage of their incomes is used for debt servicing.
6. A possible solution: a liquidity scheme for households
The tools available to central banks to counter the gap between market-based and income-based house prices fall short of what is required to achieve an adjustment period with the minimum of economic distortion for households.
The principal reason is that, by the time the financial crisis occurred, the central banks were no longer in charge. The lawyers took over, and they still are acting on behalf of the banking sector. Foreclosure filings, completed foreclosures and home repossessions are a backward way to solve a financial crisis as the “feed back loop”, so aptly developed by the Bank of England, shows. One side effect of the crisis was that lawyers were also working for the U.S. government to penalise the banks.
What seems missing is a need for a change in economic philosophy. Rather than just prioritising saving the banking sector, even when it was their collective actions which caused the financial crisis in the first place, there is a need to consider an additional model of economic adjustment: assisting the lower income classes in meeting their mortgage loan or rental obligations. This action may be beyond the remit of central banks, but not beyond governments. The U.S. government tried with a Home Affordable Refinance Program (Harp) and a Home Affordable Modification Program (Hamp) . However these programs were not based on the principle of the existence of an income gap, caused by the divergence of house prices and income developments.
Central banks strategies after the financial crisis© Drs Kees De Koning
the crisis, but legal means of foreclosure filings, completed foreclosures and home repossessions. The Bank of England’s feedback loop worked perfectly in this way, to the great detriment of individual households. With falling house prices, households had even less of a chance of any recovery of accumulated savings in the home. The poor were forced into deeper poverty. As stated above, this was not due to a fault of their own making.
There is another option, an economic one and one actually quite similar to providing temporary liquidity to the banking sector, when it ran into financial problems. It can be described as a liquidity support system for individual households. In a previous paper: “How the financial crisis could have been averted”11, the writer already illustrated such suggestion. The option could be
used when a cap on mortgage-lending levels had not been enforced. In such case the setting up of a National Mortgage Bank was recommended to help households overcome their liquidity squeeze. Such an NMB could act as a lender of last resort for individual households on basis of sharing part of the asset (the home) with the NMB for its cash-flow help. Such help should be differentiated for each income class that an individual household belongs to. Low-income earners should be helped most. This is not without precedent. The U.S. Home Owners Loan Corporation had been created for a similar purpose but was disbanded in 1936. Had such a Corporation been in existence in 2007-2008, it could have done wonders for maintaining the liquidity position for most mortgagors and even taken a subordinated share in the housing market while mortgage-lending levels synced with nominal increases in median household incomes. Rather than buying up mortgage backed securities to the tune of $1.8 trillion, an assistance scheme to directly help households to overcome their liquidity pressures would have been a much more effective way in avoiding the rapid increase in unemployment levels and the subsequent spike in U.S. government debt levels. Economic growth levels would also have been higher.
Lenders should pay a price to the NMB for the reduction in risks that the NMB facilitates. The borrowers should share – on a subordinated basis – with the NMB some of the wealth incorporated in the homes.
With the help of an NMB, mortgage borrowers can be helped – on a temporary basis- to overcome the economic pressures that excess mortgage lending levels have created for them. The help to households should apply to homeowners – occupiers only and not to landlords.
Liquidity support could also be considered for the lower income groups, who no longer were able to buy a home, but were forced into the rental markets. Such help could consist of a temporary rental support. Such a scheme would require a change in the law as the beneficiaries – the landlords – would be required to acknowledge such support by allowing the NMB to establish a subordinated mortgage on the property for the amount of help provided.
Central banks strategies after the financial crisis© Drs Kees De Koning
Moral hazard issue needs to be considered in the context of such a liquidity scheme. Does the benefit to a household –liquidity support- encourage taking on more borrowing, or borrowing irresponsibly? The support does come with a cost for the household: a transfer of part ownership over the property to the NMB. The gain for the household and the economy as a whole is that members of a household are able to stay in the home, rather than face becoming homeless at a substantial cost both to the household and the economy. The gain for the banking sector is that a potentially doubtful debtor remains current in its debt servicing obligations. For lending banks there is a cost attached to it: a transfer of part of the risk premium banks charge customers for taking on mortgage risks to the NMB. Both borrowers and lenders pay a price. For renters the situation is somewhat different. They are the victims of the income-house price gap and they can be evicted if they are not keeping up with rent payments. Their ultimate penalty is also homelessness. If a liquidity scheme included a wealth loss for the landlord –a subordinated mortgage established by the NMB equal to the liquidity support rendered to the renter- then landlords would most likely not accept rent levels far exceeding the income limits of the renter. If a landlord does not like to give up his property rights in this way, he may be given the option of lowering the rent levels. For the NMB it needs to be a judgment about reasonable levels of rents compared to income. Liquidity support for renters should not be a guaranteed right. It should also be restricted to median and low-income households only.
This solution is an economic, rather than a legal one and such a solution avoids the feedback loop effects as spelled out by the Bank of England’s financial stability report.
Drs Kees De Koning
15 November 2017
Chorleywood, U.K.
Central banks strategies after the financial crisis© Drs Kees De Koning
References:
• Bernanke, Ben (2013), The Federal Reserve and the Financial Crisis / Lectures by Ben S. Bernanke, page 83, paperback edition., Princeton University Press, New Jersey, U.S.A.
• Sorkin, Andrew Ross, (2009), Inside the Battle to Save Wall Street; Too Big To Fail, page 4, Penguin Books Ltd, London U.K.
• Wright, William and Asimakopoulos, Panagiotis (September 2017), A Decade of Change in Capital Markets, Analysis of What has and hasn’t changed in the Capital Markets Industry since 2006, New Financial., 23 Grafton Street, London, W1S 4EY, U.K.
• Statistic Brain Institute, Statistics on Foreclosure Filings, Completed Foreclosures and Home Repossessions 2004-2016, California, U.S.A.
• De Koning, Kees (2017), Why it makes economic sense to help the have-nots in times of a financial crisis, MPRA paper 82035,
https://mpra.ub.uni-muenchen.de/82035/
• Joint Center for Housing Studies of Harvard University (2017), The State of the Nation’s Housing 2017, Chapter 5, Rental Housing, pages 25 and 26, Harvard University, Cambridge, MA 02138, U.S.A
• Bank of England (2017, June) Financial Stability Report 2017, Issue 41, page 6, Figure A1, Feedback Loops between Mortgage Credit and House Prices can Amplify a Downturn, London, U.K.
• Federal Reserve Bank of St. Louis, Statistics on the Level of Outstanding Mortgage Amounts over the period 2008-2014,
https://fred.stlouisfed.org/series/HMLBSHNO
• Federal Reserve Bank of St. Louis, Statistics on the Outstanding Consumer Credit Amounts over the period 2008-2012;
https://fred.stlouisfed.org/series/CCLBSHNO
• Bernanke, Ben S. (2015), The Courage to Act, A Memoir of a Crisis and its Aftermath, Regulatory Authorities, pages 92-106, W.W. Norton & Company New York/London
• De Koning, Kees (2017, February), How the Financial Crisis could have
been averted, MPRA paper 77060