506 JOURNAL OF RANGE MANAGEMENT53(5), September 2000
Abstract
Water quality contamination by pathogens and nutrients from cattle fecal deposits is a concern on rangeland watersheds. The temporal and spatial deposition of fecal material relative to storm events and water-bodies determines much of the risk a grazing scheme presents to water quality. The objective of this study was to develop and evaluate a comparative technique to estimate cattle fecal loading across a watershed through time.
Once the method was developed, dry and wet season trials were conducted on a 138 ha experimental rangeland watershed at the San Joaquin Experimental Range in 1996–97. Fifty-four perma- nent 40 m2belt transects were established across the watershed.
Observers ocularly assigned a rank of 1 (smallest diameter) to 5 (largest diameter) to each fecal deposit within a transect. A regression relationship was developed to predict fecal deposit dry weight by rank. Load per transect was calculated as the total weight of all fecal deposits in a transect. All fecal deposits in transects were collected and actual fecal load determined. The comparative yield methodology was successfully adapted to esti- mate rangeland fecal loading. Regression relationships predict- ing fecal deposit dry weight by ranks were highly significant for all observers (p < 0.001). The R2values ranged from 0.97 to 0.99 in the dry season and 0.89 to 0.94 in the wet season. There was no significant difference between the weighed fecal load estimate and the estimates of observers using the comparative method (p
< 0.05). This method provides a rapid, simple method for esti- mating spatial and temporal livestock fecal loading on rangeland watersheds.
Key Words: water quality, pathogens, nutrients, grazing
Water quality contamination by pathogens and nutrients in live- stock fecal deposits is a subject of concern on rangeland water- sheds (Atwill 1996, Nader et al. 1998). Recent events in California illustrate the need for land managers to evaluate the risk of pathogen and nutrient loading that their grazing animals present to water quality on priority watersheds that supply munic- ipal drinking water (Barry et al. 1998). Managers need methods that provide site specific data to confirm or negate the risk of contamination. In situations where the risk is unacceptable, man- agers must be able to propose and defend viable grazing manage-
ment alternatives. If managers do not take this initiative, regulato- ry control of grazing on priority watersheds is likely.
Estimating the spatial and temporal loading of livestock fecal material, thus nutrients and pathogens, on a watershed is a critical step in determining the risk to water quality presented by grazing management schemes. The t i m i n g of fecal loading relative to runoff as well as its location relative to riparian areas and water- bodies determines much of the potential for contaminants in live- stock fecal deposits to reach source water.
Hand collection of fecal deposits from plots across a landscape is one method of estimating fecal loading. The process is time J. Range Manage.
53: 506–510 September 2000
A method for estimating cattle fecal loading on rangeland watersheds
KENNETH W. TATE, EDWARD R. ATWILL, NEIL K. MCDOUGALD, MELVIN R. GEORGE, AND DAVID WITT
Authors are rangeland watershed specialist, Agronomy and Range Science, University of California, Davis, Calif. 95616-8515; environmental health spe - cialist, School of Veterinary Medicine, University of California, Veterinary Medicine Teaching and Research Center, Tulare, Calif. 93274; natural resources and livestock advisor, University of California Cooperative Extension, Madera, Calif. 93637; range and pasture specialist, Agronomy and Range Science, University of California, Davis, Calif. 95616-8515; and range conservationist, USDA-NRCS, Madera, Calif. 93637.
Research was funded by UC Division of Agriculture and Natural Resources 1995-96 Competitive Grants Program, Grant #020.
Manuscript accepted 12 Dec. 1999.
Resumen
La contaminación del agua por patógenos y nutrientes prove- nientes de heces fecales del ganado es motivo de preocupación en las cuencas hidrológicas de pastizal. La deposición espacial y temporal del material fecal en relación a los eventos de tormen- tas y cuerpos de agua determina mucho del riesgo que un esque- ma de apacentamiento presenta para la calidad del agua. El objetivo de este estudio fue desarrollar y evaluar una técnica comparativa para estimar la carga de material fecal a lo largo de una cuenca hidrológica a través del tiempo. Una vez que el méto- do se desarrollo, se condujeron ensayos en las épocas seca y de lluvia de 1996 y 1997, los ensayos se llevaron a cabo en una cuen- ca hidrológica de pastizal de 138 ha situada en "San Joaquín Experimental Range". A lo largo de la cuenca se establecieron 54 transectos permanentes de 40 m2. Los observadores asignaron en forma ocular una clasificación del 1 (diámetro mas pequeño) al 5 (diámetro mas grande) a cada uno de los depósitos fecales encon- trados dentro del transecto. Se desarrollo una relación de regre- sión para predecir el peso seco del depósito fecal por categoría.
La carga por transecto se calculó como el peso total de los depósitos fecales dentro del transecto. Todos los depósitos fecales del transecto se colectaron y se determinó la carga fecal actual.
La metodología comparativa se adapto exitosamente para esti- mar la carga fecal del pastizal. Las relaciones de regresión para predecir el peso seco de los depósitos fecales por categoría fueron altamente significativos para todos los observadores (P < 0.001).
Los valores de r2variaron de 0.97 a 0.99 en la época seca y de 0.89 a 0.94 en la época de lluvia. No hubo una diferencia signi- ficativa entre la estimación de la carga fecal obtenida mediante pesaje y la estimada por los observadores utilizando el método comparativo (P < 0.05) Este método provee un método rápido y simple para estimar la carga espacial y temporal de depósitos fecales de ganado dentro de las cuencas hidrológicas de pastizal.
507 JOURNAL OF RANGE MANAGEMENT53(5), September 2000
and labor intensive and limits sample size.
A rapid, simple method is needed to esti- mate fecal loading. Observational methods based upon ranking systems have been successfully used to facilitate herbage yield estimation (Mannetje and Haydock 1963, Haydock and Shaw 1975, Reese et al. 1980, Gillen and Smith 1986, Frost et al. 1990, USDI-BLM 1996). These meth- ods have lower costs per plot which allows for increased sample size and improved estimates of population parameters at the landscape scale. Decreases in precision occur at the plot scale. Many accept this as a worth-while trade-off (Haydock and Shaw 1975, Reese et al. 1980).
The first objective of this study was to adapt the comparative herbage yield methodology to a method for estimating cattle fecal loading on rangelands. The second objective was to test the newly developed comparative fecal load method by comparing watershed scale loading estimates by several observers to estimates from hand collection and weighing of fecal deposits during wet and dry seasons.
Our null hypothesis was that this method would not accurately estimate watershed fecal loading across seasons or observers.
Methods
Study Site
The study was conducted on a 138 ha experimental rangeland watershed at the San Joaquin Experimental Range in Madera County, Calif. Vegetation is oak savanna with annual grassland understory.
Climate is Mediterranean with mean annu- al precipitation of 485 mm. Precipitation falls almost entirely as rainfall from November through May (wet season) with almost no precipitation falling from June through October (dry season). In November 1995, 54 permanent 40 m2belt transects were established across the watershed. An individual transect served as the experimental unit in this study.
Transects were 30.5 m long by 1.3 m wide and staked at both ends. Following a strat- ified-random design, the transects were distributed proportionally across the watershed to encompass slope classes of 0–10, 11–20, 21–30, >30%, with addition- al transects placed in the riparian zone and around livestock concentration areas.
Transect numbers per stratification were 14, 15, 5, 5, 10, and 5, respectively. The stratified sampling design was used to insure that important topographic and managerial areas representing the range of fecal loading on the watershed were
included. Transect starting points were randomly positioned within each stratifi- cation via random selection from a grid.
Orientation of the transects was deter- mined via random compass bearing. The watershed was grazed continuously with a 30 unit commercial, cow-calf herd from 1 January 1996 through 31 May 1997.
Comparative Fecal Load Method The comparative fecal load method described in this section closely follows the comparative herbage yield procedures outlined by Haydock and Shaw (1975) and addresses the first objective of our study.
The comparative herbage yield method uses the quadrat as both the basic unit for ranking and as a sample unit. Our compar- ative fecal load method used the individ- ual fecal deposit as the basic unit for rank- ing and the 40 m2 transect as the experi- mental unit. A transect could contain 0, 1, or numerous fecal deposits of various sizes. The transect fecal load (kg) was the sum of the weight of the fecal deposits in the transect. The comparative yield method bases rank (1, 2, 3, etc.) on esti- mated herbage dry weight (g). Our com- parative fecal load method used fecal deposit diameter (cm) to establish rank (1, 2, 3, etc.).
The first step was to select 5 reference fecal deposits to set the ranking scale for the sample period. Rank 1 (smallest) and 5 (largest) were established by surveying the general sampling area and selecting fecal deposits encompassing the range of sizes within the area. Once reference fecal deposits 1 and 5 were established, refer- ence fecal deposit 3 was defined to have a diameter half-way between 1 and 5.
Reference fecal deposits 2 and 4 were then selected to have diameters half-way between 1 and 3 and 3 and 5, respectively.
Following establishment of the reference fecal deposit dimensions, each observer spent 15 to 30 minutes calibrating their mind and eye to the reference set and the ranking scale it established for that specif- ic sample period and location.
The second step was to record the rank of each fecal deposit in a transect based upon the 5 references established in step 1.
Half scores were also utilized (1.5, 2.5, etc.). Data was recorded using the sheet developed by Frost et al. (1990) for com- parative herbage yield.
The third step was to rank and collect a set of fecal deposits for development of the calibration curve to calculate fecal deposit dry weight (g) from individual fecal deposit ranks. The calibration curve was derived by regression analysis where
fecal deposit dry weight was the depen- dent variable and fecal deposit rank the independent variable. Calibration was accomplished using the Type 3 method described by Haydock and Shaw (1975).
Approximately half way through sam- pling, observers collectively selected a minimum of 15 fecal deposits that covered the range of ranks from 1 to 5. These cali- bration fecal deposits were ranked by each observer and subsequently collected for dry weight determination.
The fourth step was to develop a cali- bration curve for each observer using regression procedures. Steps 3 and 4 were extremely critical because they quantified the individual biases of each observer.
The final step was to use the calibration curve to estimate dry weight (g) of each fecal deposit in a transect. Total fecal load (kg) for the transect was the sum of all individual fecal deposit weights. Fecal loading per unit area was calculated from the known area of the transect. Fecal load- ing parameters (mean, standard deviation, range, etc.) for this area were then estimat- ed from the entire set of transects dis- persed across the watershed.
Testing the Method
A dry and wet season trial were con- ducted to address our second objective of evaluating the method. The dry season trial began on 31 May 1996 when all fecal deposits were cleared from each transect.
The dry season trial ended and the wet season trial began when all transects were sampled and subsequently cleared on 1 November 1996. The wet season trial, and the study, ended 31 May 1997 when all transects were re-visited and sampled. All transects were sampled once at the end of each trial. Each observer worked indepen- dently. Following ranking of all fecal deposits in a transect, all fecal material was collected, dried at 60° C for 96 hours, and weighed to determine total dry weight fecal load. There were 4 observers in the dry season and 3 observers in the wet sea- son trial. Observers A and B participated in both trials. Observers C and D only par- ticipated in the dry season trial and Observer E participated only in the wet season trial. Calibration curves predicting fecal deposit dry weight from ranks were developed for each observer and the rela- tionship used to calculate individual watershed fecal load estimates.
Calibration curves for each observer in each season were developed using regres- sion, with adjusted multiple coefficients of determination (R2) and analysis of vari- ance for the regression coefficients used to
508 JOURNAL OF RANGE MANAGEMENT53(5), September 2000 characterize the significance of each
observer’s ability to predict fecal deposit weight as a function of rank. Both linear and quadratic regression models were test- ed. Regression models were forced through the origin because a zero rank must equal a zero fecal deposit dry weight.
To determine the need to develop separate calibration curves for each observer within a season, the equality of curves developed for Observers A, B, C, and D for the dry season and Observers A, B, and E for the wet season was tested. To determine the need to develop separate calibration curves for the dry and wet season, the equality of dry and wet season calibration curves for Observers A and B was tested.
Given that the intercept of all calibration curves was forced through 0, only the equality of slopes could be tested. The equality of the regression lines was tested by conducting pairwise F- tests following Dixon (1992) with the F-test calculated as, (Regression SS across groups)/( pi + g - p - 1) F =
(Residual SS within groups)/(N - g - pi ) where Residual Sums of Squares ( S S ) within groups = ∑ Residual SS of group i, Total SS = Residual SS of the data prior to grouping, Regression SS across groups = (Total SS - Residual SS within groups), p
= number of independent variables in the regression equation for all groups taken together, pi= number of independent vari- ables in the equation for the ith group, g = number of groups, and N = number of cases in all the groups combined.
Analysis of variance was used to test for differences between mean watershed fecal load estimates from hand collected sam- ples and comparative load based estimates from ranks for each observer. Differences between mean watershed fecal load esti- mates among observers was tested in the same model. Each trial (season) was sub- jected to an individual ANOVA.
Results and Discussion
Calibration Curves
Calibration curves for each observer in each season are presented in Table 1. The R2values for linear calibration curves across observers ranged from 0.84 to 0.94 and from 0.75 to 0.90 for the dry and wet season trials, respectfully. Based upon a 5 percentage point or greater improvement in R2values, the quadratic equation with observer rank and the square of the observer rank best fit the data (Table 1).
While there is no rule in comparative yield, Haydock and Shaw (1975) found
that the relationship between quadrat herbage dry weight and rank was explained by simple linear regression.
This is logical given that they selected their reference quadrats to insure a linear relationship between rank and quadrat dry weight. In developing their reference set, Haydock and Shaw (1975) specifically state that reference quadrat 5 be selected to have 5 times the dry weight as the quadrat for reference rank 1, and that ref- erence quadrat 3 be selected to have dry weight half-way between ranks 1 and 5.
This leads to the linear relationship for calibration curves that they were seeking for their method.
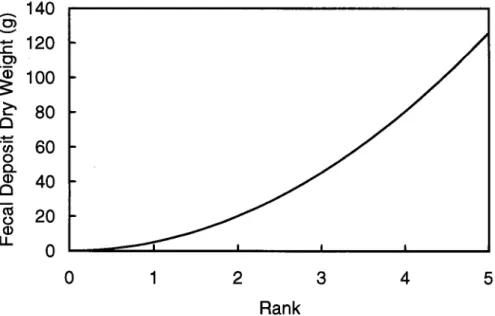
In our adaptation of the comparative yield method, the first step is to select ref- erence fecal deposits 1–5 based upon diameter. Considering that the shape of a fecal deposit can be approximated as a short cylinder, it becomes clear that the relationship between fecal deposit diame-
ter (2r) and fecal deposit dry weight (hπr2 x fecal deposit dry weight specific gravity) is not linear. Figure 1 illustrates the theo- retical relationship between fecal deposit rank and fecal deposit dry weight at a con- stant fecal deposit depth of 2 cm, a specif- ic gravity of 0.2, and with diameters for reference fecal deposit ranks 1, 3, and 5 equal to 2, 6, and 10 cm, respectively.
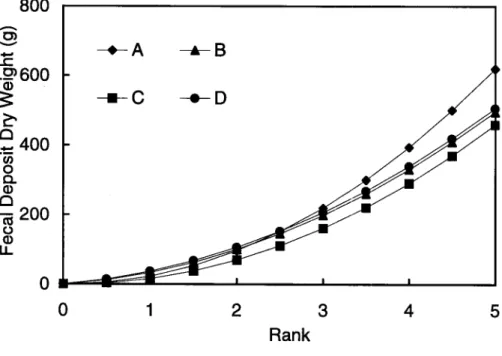
During the dry season, we found that 3 of the 6 pair-wise comparisons of calibra- tion curves among the 4 observers were significantly different (Table 1, Fig. 2).
For example, the calibration curve for Observer A compared to Observer B was significantly different based upon the pair- wise F-test for the equality of regression lines (P = 0.013). The predicted dry weight for a fecal deposit of rank 2 was 96 g compared to 99 g, or 394 g compared to 330 g for a fecal deposit of rank 4 for Observer A and B, respectfully. This result indicated that it was important to
Table 1. Comparative fecal load calibration curves developed for each observer for the dry and wet season trials that were used to predict fecal deposit dry weight from observer rank, n = 15 for each observer. Samples were taken on a 138 ha watershed at the San Joaquin Experimental Range in 1996–97.
Season Observer* Regression Equation R2
Dry Aa,1 –2.95(rank) + 25.36(rank2) 0.97
Bb,c,1 16.59(rank) + 16.50(rank2) 0.99
Cb –3.62(rank) + 19.07(rank2) 0.98
Da,c 20.35(rank) + 16.16(rank2) 0.97
Wet Aa,2 71.45(rank) + 16.78(rank2) 0.94
Ba, 2 19.01(rank) + 24.52(rank2) 0.93
Ea 35.10(rank) +23.40(rank2) 0.89
*Within each season, calibration curves for observers with the same letter were not significantly different (P < 0.05). For Observers A and B across seasons, calibration curves with the same number were not significantly different (P < 0.05).
Fig. 1. Theoretical calibration curve for fecal deposit dry weight predicted by rank when ref- erence fecal deposit ranks are established from fecal deposit diameter.
509 JOURNAL OF RANGE MANAGEMENT 53(5), September 2000
develop separate calibration curves for each observer during the dry season.
There were no significant differences among calibration curves for Observers A, B, and E during the wet season (Table 1, Fig. 3), which indicated it was not as important to develop separate calibration curves for each observer during this sea- son. In this season, a composite calibra- tion curve could have been developed and used for all observers.
Calibration curves for the dry and wet season were significantly different for both Observer A (P = 0.0004) and B (P = 0.001), which indicated it was important to develop separate calibration curves for each observer for each season. Fecal deposit dry weight for a given rank was consistently heavier during the wet season trial for both observers. This could be due to higher fecal deposit density under green versus dry feed conditions.
Given the differences in calibration curves for observers in the dry season and for Observers A and B across seasons, we recommend that individual calibration curves be developed for each observer in each season. We recommend that fecal deposit diameter be used as the principle variable in determining fecal deposit size and that the quadratic form be investigated when developing the best fit regression- based calibration curve. Reference fecal deposits should be reexamined each day of consecutive sampling. A new reference set should be developed when sampling is spread discontinuously over several days or when a change in fecal deposit appear- ance occurs. Changes in sample site, sea- son, cattle class or age, feed type or mois- ture, or a rainfall event can all alter the relationship between appearance and dry weight of fecal deposits and new calibra- tion curves should be developed.
Watershed Fecal Load Estimation There were no significant differences in watershed fecal load estimated by each observer using the comparative fecal load method and by hand collection for either the dry (P = 0.70) or the wet (P = 0.49) season trial (Table 2). Our null hypothesis that the comparative fecal load method developed in this study would not accu- rately estimate average fecal loading on the watershed across seasons or observers was rejected.
Regardless of method, there was high variability associated with watershed fecal load estimates. The observed variability verifies the need for a rapid, simple sam- pling method that allows increased sample size. Fifty-four transects represented the largest number that a 2 person team could Fig. 2. Calibration curves used to predict fecal deposit dry weight from ranks for Observers
A, B, C, and D for the dry season trial conducted on a 138 ha watershed at the San Joaquin Experimental Range on 1 November 1996.
Fig. 3. Calibration curves used to predict fecal deposit dry weight from ranks for Observers A, B, and E for the wet season trial conducted on a 138 ha watershed at the San Joaquin Experimental Range on 31 May 1997.
Table 2. Watershed fecal loads estimated by each observer using the comparative fecal load method and by hand collection for both dry and wet season trials, n = 54 for each estimate. Samples were taken on a 138 ha watershed at the San Joaquin Experimental Range in 1996–97.
Season Estimate Mean* SE
(kg ha-1)
Dry Hand Collected 37.2 8.2
Observer A 53.9 10.9
Observer B 50.1 10.6
Observer C 43.4 10.0
Observer D 48.8 10.1
Wet Hand Collected 27.6 7.3
Observer A 34.8 6.8
Observer B 23.3 5.0
Observer E 31.7 7.1
*There were no significant differences (P<0.05) between methods nor among observers within each season of sam- pling.
510 JOURNAL OF RANGE MANAGEMENT 53(5), September 2000 physically harvest in a single day from the
138 ha watershed evaluated in this study.
Mean time to collect all fecal material from each transect was approximately 5 minutes. Mean time for a person to con- duct the comparative fecal load method per transect was approximately 2 minutes.
At 54 plots, that was 4.50 and 2.25 hours of transect sampling time for the hand col- lection and comparative methods, respec- tively. Regardless of the number of tran- sects, the comparative fecal load method required an hour to select a reference fecal deposit set and sample the calibration fecal deposit set. Travel time between transects was faster for the comparative fecal load method because technicians were not carrying sacks of fecal material.
Travel time among transects accounted for about half of the time spent in the field each day. By employing the comparative f e c a l l o a d m e t h o d , s a m p l e s i z e w a s increased 45%, from 54 to 78 transects per day. Also, only 1 observer rather than the team of 2 employed in the hand collection method was required.
If transects are permanently established for estimation of loading over time, all fecal deposits should be cleared from the transect following ranking. This is not necessary for temporary transects where repeated sampling is not an objective.
Loading estimates for specific areas (flood-plain, uplands, etc.) of the water- shed can be developed if transect locations are stratified or targeted to adequately rep- resent the area of interest. If multiple
observers are used, load can be averaged across observers. It is recommended that when comparisons are to be made, a single observer or consistent set of observers be utilized to reduce potential bias from observer differences.
Conclusion
Estimating livestock fecal loading on rangelands via hand collection of fecal material from plots is cost prohibitive and limits sample size in a system where large numbers of samples are preferable. We were able to successfully adapt the com- parative herbage yield methodology to estimate livestock fecal loading on range- lands. This method provided a rapid, sim- ple method for collecting plot-based, site- specific estimates of spatial and temporal livestock fecal loading on rangelands.
When used in conjunction with a system- atic sampling scheme of plots across a pasture or watershed, fecal loading through time can be estimated at the ripar- ian, upland, pasture, or watershed scale.
Quantification of fecal loading through space and time is a critical first step in evaluating the risk to water quality under various grazing management scenarios.
Literature Cited
Atwill, E.R. 1996. Assessing the link between rangeland cattle and waterborne C r y p t o - sporidium parvum infections in humans.
Rangelands 18:48–51.
Barry, S.J., E.R. Atwill, K.W. Tate, T.S.
Koopmann, J. Cullor, and T. Huff. 1998.
Developing and implementing a HACCP- based program to control C r y p t o s p o r i d i u m and other waterborne pathogens in Alameda Creek Watershed: a case study, p.57–69. In:
Proc. of Amer. Water Works Assoc. Annu.
Conf. Dallas, Tex.
Dixon, W.J. 1992. BMDP Statistical software manual. University of California Press.
Berkeley, Calif.
Frost, W.E., N.K. McDougald, and M.R.
George. 1990. Herbaceous plant measure- ments, p.3–6. I n: W . J . C l a w s o n ( e d . ) , Monitoring California’s annual rangeland vegetation. Univ. of California, Div. of Agr.
and Natur. Resources. Leaflet 21486. Davis, Calif.
Gillen, R.L. and E.L. Smith. 1986. Evaluation of the dry-weight-rank method for determin- ing species composition in tallgrass prairie. J.
Range Manage. 39:283–285.
Haydock, K.P. and N.H. Shaw. 1975. T h e comparative yield method for estimating dry matter yield of pasture. Australian J. Exp.
Agr. and Anim. Husb. 15:663–670.
Mannetje, L.’t and K.P. Haydock. 1963. The dry-weight-rank method for the botanical analysis of pasture. J. Brit. Grassl. Soc.
27:268–275.
Nader, G.A., K.W. Tate, E.R. Atwill, and J.
Bushnell. 1998. Water quality effect of rangeland beef cattle excrement. Rangelands 20:19–25.
Reese, G.A., R.L. Bayn, and N.E. West.
1980. Evaluation of double-sampling estima- tors of subalpine herbage production. J.
Range Manage. 33:300–306.
USDI-BLM. 1996. Comparative yield method, p.116–122. I n: Sampling vegetation attributes.
Interagency Tech. Ref. BLM/ST-96/002+1730.
Denver, Colo.