J. Range Manage.
56: 328-333 July 2003
Utilization and grazing distribution of cattle at 4 stocking densities
FELIX R. BURBOA-CABRERA, WALTER H. SCHACHT, AND BRUCE E. ANDERSON
Authors are Forage and Range Scientist, INIFAP-SAGARPA-CIRNO, Boulevard del Bosque, No. 7 Col. Valle Verde, Hermosillo, Sonora, Mexico; Associate Professor and Professor, Department of Agronomy and Horticulture, P.O. Box 830915, University of Nebraska, Lincoln, Nebr. 68583-0915.
Abstract
The relationship between stocking density and grazing distrib- ution was studied in eastern Nebraska pastures seeded to a warm-season, tall-grass mixture and grazed at 4 stocking densi- ties: 9, 18, 27, and 54 steers ha'1. Each of 4 pastures was divided into 4 paddocks ranging in size from 0.18 to 1.12 ha. Paddocks within each pasture were grazed rotationally by 10 steers averag- ing 282 kg during 3 consecutive cycles (12, 36, and 24 days) from early June to late August in 1995 and 1996. Transects 12-m long were established in a grid pattern in each paddock. Six tillers each of big bluestem (Andropogon gerardii Vitman) and Switch- grass (Panicum virgatum L.) were marked permanently in each transect. Height and leaf length of marked tillers were measured before and after grazing in the last 2 grazing cycles in both years.
Utilization was estimated by the reduction in tiller height or leaf length. Estimates of grazing distribution were based on a unifor- mity index, which was calculated by summing the absolute differ- ences of tiller height or leaf length between adjacent transects.
Stocking density generally did not affect (P > 0.05) tiller height reduction which ranged from 19 to 22 cm and from 29 to 38 cm among the stocking densities in 1995 and 1996, respectively. In most grazing cycles, leaf length reduction for big bluestem was greater (P < 0.05) than for switchgrass while tiller height reduc- tion was similar between species. Spatial grazing distribution was not affected (P > 0.05) by stocking density but big bluestem was grazed more evenly (P < 0.05) than switchgrass in the last cycle in each year. Stocking densities as high as 54 steers ha
1on warm- season, tall-grass mixtures do not appear to be a major factor in affecting spatial grazing distribution or forage plant selection.
Key Words: big bluestem, switchgrass, uniformity index, herbage allowance
Plant cover of grazing land is heterogeneous because manage- ment and environmental characteristics affecting plant growth (e.g., soils, topography, climate) are discontinuous spatially and temporal- ly (Greig-Smith 1983). Given this heterogeneity, grazing animals are unlikely to make uniform use of a grazing unit; some areas are used heavily and others receive little or no use (Edwards et al.
1997). This uneven utilization affects the nutritional status of graz- ing animals as well as the dynamics of plant communities. When carrying capacity is not exceeded, range condition may improve when herbivores are more evenly distributed (Provenza 1991).
The authors wish to thank Mike Trammel! and Sandy Smart for technical assistance.
Published as Paper No.13552, Journal Series, Agriculture Research Division, University of Nebraska.
Manuscript accepted 12 Sept. 02.
Resumen
Se estudio la relacion entre la densidad de carga y la distribu- cion del apacentamiento en praderas del este de Nebraska sem- bradas con una mezcla de zacates altos de verano y apacentadas con 4 densidades de carga animal: 9, 18, 27 y 54 novillos ha
1.Cada una de las 4 praderas fueron divididas en 4 potreros var- iando en tamano de 0.18 a 1.12 ha. Los potreros dentro de cada pradera se apacentaron rotacionalmente con 10 novillos, (prome- diando 282 kg) durante 3 ciclos consecutivos, (12, 36, y 24 dias), de inicios de Junio a fines de Agosto en 1995 y 1996. En cada potrero se establecieron transectos de 12 m de largo en un patron cuadriculado. En cada transecto se marcaron permanen- temente 6 hijuelos de Big bluestem" (Andropogon gerardii Vitman) y 6 de "Switchgrass" (Panicum virgatum L.). La altura
y la longitud de las hojas de los hijuelos marcados se mido antes y despues del apacentamiento en los dos ultimos ciclos de apacentamiento de ambos anos. La utilizacion se estimo medi- ante la reduccion en la altura de los hijuelos y la longitud de la hoja. Las estimaciones de la distribucion del apacentamiento se basaron en un indice de uniformidad, el cual fue calculado sumando las diferencia absolutas de la altura del hijuelo y la lon- gitud de las hojas entre transectos adyacentes. La densidad de carga generalmente no afecto (P > 0.05) la reduccion de altura de
los hijuelos, la cual vario de 19 a 22 cm y de 29 a 38 cm entre las densidades de carga en 1995 y 1996 respectivamente. En la may- oria de los ciclos de apacentamiento, la reduccion de la longitud de las hojas de "Big bluestem"fue mayor (P < 0.05) que la de
"Switchgrass", mientras la reduccion de la altura del hijuelo fue similar para ambas especies. La distribucion espacial del apacen- tamiento no fue afectada (P > 0.05) por la densidad de carga, pero en el ultimo ciclo de cada ano, el "Big bluestem" fue apacentado mas uniformemente (P < 0.05) que el "Switchgrass".
Densidades de carga tan altas como 54 novillos ha
1en praderas
de mezclas de zacates altos de verano no parece ser un factor principal que afecte la distribucion espacial o la seleccion del for- raje de la planta.
The consequence of uneven utilization has been reported regu- larly in the literature and recommendations to alleviate this prob- lem have been developed (Gammon and Roberts 1978, Vallentine 2001). Strategies used to improve grazing distribution include reduction of paddock size, improved water distribution, strategic placement of salt and supplements, and increasing stocking densi- ty. A common practice used to increase stocking density is inten- sive subdivision of grazing units (Gerrish and Morrow 1999, Vallentine 2001).
Increased stocking density is reported to improve grazing dis- tribution because of the role animal density plays in modifying
328 JOURNAL OF RANGE MANAGEMENT 56(4) July 2003
herbage allowance (Roth et al. 1986, Bailey and Rittenhouse 1989). The rela- tionship between stocking density and grazing distribution has been investigated with experimental designs that do not allow for isolation of stocking density from other grazing variables (Kirby et al.
1986, Walker et al. 1989). Most of these studies arrived at different stocking densi- ties by using various grazing systems that caused confounding with management strategies and stocking rates (Smith and Owensby 1978, Senock et al. 1993). Most studies also have been conducted under extensive conditions where treatment replication is difficult and labor con- straints limit sampling intensity and rigor- ous evaluation of the variables observed (Kirby et al. 1986, Pierson and Scarnec- chia 1987, Hart et al. 1993). Moreover, stocking densities studied were relatively low (less than 15 AU ha') because of low carrying capacity (Kirby et al. 1986, Pierson and Scarnecchia 1987, Walker et al. 1989).
Studies conducted in small paddocks may isolate responses to stocking density more effectively by eliminating the effect of distance to water and other variables related to grazing distribution. The objec- tives of this study were to use small pad- docks to determine spatial variability in utilization of big bluestem (Andropogon gerardii Vitman) and switchgrass (Panicum virgatum L.) and the effect of stocking density on utilization of a warm- season grass mixture.
Materials and Methods Study site
The study was conducted in 1995 and 1996 at the University of Nebraska Agricultural Research and Development Center near Mead, Neb. (96° 33' W, 41 ° 11' N, 315 m elevation) at the western edge of the tallgrass prairie region.
Climate is continental, characterized by wide seasonal variations. Average maxi- mum daily temperatures range from 0.1°
C in January to 31.5 ° C in July. Average minimum daily temperatures range from -11.4° C in January to 18.9° C in July.
The long-term (1960 to 2000) annual pre- cipitation averages 741 mm, and about 75% of this falls during the growing sea- son (April through September) (HPRCC 1997). The topography varies from nearly level to slopes of less than 3%. The promi- nent soil in the study site is a Sharpsburg silty clay loam (fine, montmorillonitic, mesic, Typic Argiudoll), and most of the
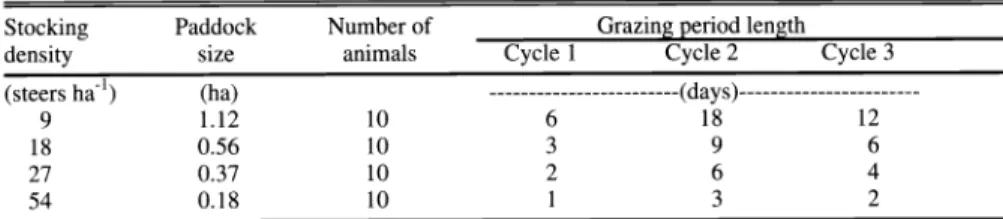
Table 1. Description of 4 stocking density treatments.
Stocking Paddock Number of period length
density size animals
12 3
(steers ha') (ha) ---(days)---
9 1.12 10 6
180.56 10
39 6
27 0.37 10 2 6 4
54 0.18 10
1 32
parent material is loess of Peorian age (Soil Conservation Service 1965).
Four pastures of seeded warm-season grass and averaging 2.23 ha were used.
These pastures were grazed from mid-June through August at about 7 AUM ha' dur- ing the previous several years by cattle as part of a rotational grazing system. Big bluestem, switchgrass, and indiangrass [Sorghastrum nutans (L.) Nash] were the
dominants in the pastures. Smaller
amounts of little bluestem [Schizachyrium scoparium (Michx.) Nash] and sideoats grama [Bouteloua curtipendula (Michx.) Ton] were present. To reduce the hetero- geneity of the canopy structure, all pas- tures were burned in early May 1995.
Pastures were fertilized in May 1995 and 1996 with 90 kg N ha'.
Grazing treatments
Each of the 4 grazing units represented
1
replication and was divided into 4 pad- docks ranging in size from 0.18 to 1.12 ha (Table 1). The paddocks in each grazing unit were grazed rotationally by 10 cross- bred yearling steers, averaging 282 kg (0.63 AU), for 72 days from early June to late August in both 1995 and 1996.
Treatments were 4 stocking densities, resulting from the 4 paddock sizes.
Stocking rate was identical at 324 steer days ha' (204 AUD ha') for each of the 4 treatments because larger paddocks had proportionally longer grazing periods (Table 1). Steers were grazed rotationally through the paddocks of each grazing unit in 3 grazing cycles of 12, 36, and 24 days in length from the beginning to the end of the grazing season. A grazing cycle refers to
1rotation through the paddocks in a grazing unit. Different cycle lengths were used to match forage availability and growth rates during the different periods in the growing season. The first cycle was rapid to reduce differences in maturity of plants in the paddocks within each grazing unit. Previous research (Anderson 1997) indicated that a 36-day cycle was well suited to a warm-season tall-grass pasture during the growing season. At the end of the 36-day cycle in both years, we finished with a 24-day cycle because the amount of
available forage was too low to support a 36-day cycle.
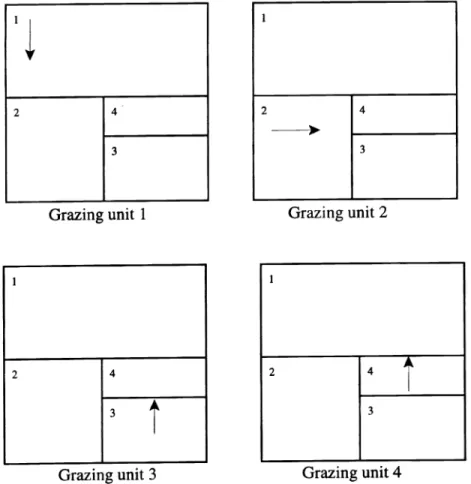
Within each grazing unit, the grazing cycle began in a different sized paddock to balance differences in plant growth stages during the grazing season across grazing units (Fig. 1). Thus, steers began grazing the 1.12-ha paddock in
1grazing unit, the 0.56 ha in another, the 0.37 ha in the third, and the 0.18 ha in the fourth grazing unit.
Direction of rotation always was from the larger paddock to the next smaller one, except when animals were rotated from the 0.18-ha paddock to the 1.12-ha pad- dock. Cattle were moved in mid-morning when rotation was scheduled. Fresh water and trace mineralized salt blocks were available in each paddock. The cattle grazed smooth bromegrass (Bromus iner- mis Leyss.) during the 45 days before being moved to the study site.
Sampling and variables measured
Transects, 12-m long, were arranged in a grid pattern in a north-south and east- west direction in each pasture. There were 17, 14, 11, and 8 transects in each of the 1.12, 0.56, 0.37, and 0.L8-ha paddocks, respectively. Ends of each transect were permanently marked with wooden stakes identified with metal tags. Along each transect, 6 tillers each of big bluestem and switchgrass were marked with colored, 14-gauge solid-core copper wire loosely wrapped around the tillers' bases. Marked tillers were approximately
1m apart and species alternated. Tiller measurements, taken before and after grazing, were height (from the soil surface to the tip of the highest fully extended leaf) and total length of green leaf blades per tiller. The same transects and sampling procedures were used during each grazing cycle and year. Tiller measurements were not made in the first cycle because the measure- ments required more time than available in the short, first cycle.
Tiller height reduction and leaf length reduction were estimated by subtracting post-grazing from pre-grazing tiller height and leaf length, respectively. Tiller height reduction and leaf length reduction were adjusted for growth during the grazing
JOURNAL OF RANGE MANAGEMENT 56(4) July 2003 329
D 1995 1996 O Long Term
Apr May June July Aug
Fig. 1. Monthly precipitation during the growing season for 1995, 1996, and 30- year average at Mead, Neb.
period using a modification of the method described by Morris (1969). Growth rate adjustments were made independently for each grazing unit and species. Growth rate was obtained by marking 10 tillers of each species in each of 3 exclosures (1.2 x 1.5 m) placed randomly in the largest paddock of each grazing unit and measuring these tillers at the beginning and end of each grazing period. Daily growth increment was calculated by dividing the difference of final minus initial tiller height or leaf length by the number of days of grazing.
Daily growth increment then was multi- plied by the days of grazing in each pad- dock to determine the amount of increase in tiller height or leaf length for the aver- age tiller in each paddock. Reduction in tiller height or leaf length in a grazed pad- dock was adjusted by adding the growth occurring during the grazed period.
A uniformity index (Abuja and Schachter 1983, Hacker et al. 1988) was used to analyze treatment differences in spatial distribution of defoliation intensity of big bluestem and switchgrass. Within each paddock, the uniformity index was calculated by summing the absolute differ- ences in mean tiller heights, or leaf
lengths, between adjacent transects along the north-south and east-west grid pattern.
This arrangement used 22 differences for the 1.12-ha paddocks, 17 differences for the 0.56-ha paddocks, 12 differences for the 0.37-ha paddocks, and 8 differences for the 0.18-ha paddocks. The sum of absolute differences in each paddock was divided by the number of differences to obtain the uniformity index. This index does not have a unit and higher values imply less uniformity for the variable evaluated. Uniformity indices were calcu- lated for tiller height before grazing, tiller height after grazing, tiller height reduc- tion, leaf length before grazing, leaf length after grazing, and leaf length reduction.
Herbage biomass was estimated before each grazing period by hand clipping the
current year's growth at ground level in randomly placed 0.55-m2 quadrats.
Samples were dried in a forced-air oven at 60° C until weight was constant. Number of samples collected in each paddock var- ied according to the size of the paddock and ranged from 5 in the smallest pad- docks to 10 in the largest.
Experimental Design
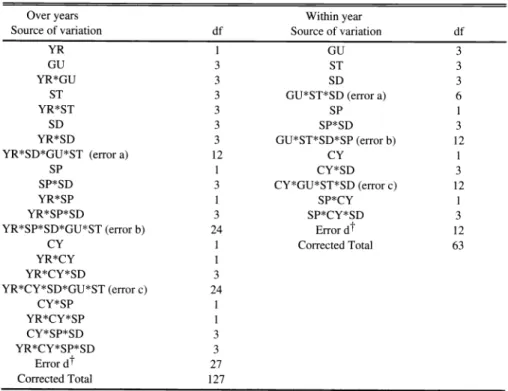
The experimental design was a modifi- cation of the standard procedure for a Latin square (Lenter and Bishop 1993) arranged in a split plot (Table 2). The major sources of variation were stage (i.e., order in which paddocks were grazed in each grazing unit), grazing unit, and treat- ment (i.e., stocking densities and species).
Paddocks were the main plot and grass species the split plot (Anderson et al.
1995). Cycle was included as a split factor in the analysis to determine the consisten- cy of the variables studied through the grazing season. Analyses of tiller data included cycles 2 and 3 only because tiller height data was not collected in the first cycle, whereas analysis of standing crop yield data included all 3 cycles. When sta- tistical analysis for a variable resulted in interactions with year, analysis was con- ducted within individual years (Table 2).
Analysis of the data was conducted using the Statistical Analysis System with the Mixed Procedure (SAS 1995). The
error term used to test each variable is shown in Table 2. Least significant differ- ence (LSD) was used to separate means when analysis showed significant (P <
0.05) treatment effects.
Results and Discussion
In 1995, precipitation in April and May was higher than the long-term average, whereas precipitation in June, July, and August was much lower than the long-term average (Fig. 2; HPRCC 1997).
Distribution of precipitation followed a similar pattern in 1996 except that the wet spring extended into June before giving way to a relatively dry July and August.
Precipitation from April through August in 1995 and 1996 was 344 and 465 mm, respectively, compared to the long-term average of 453 mm. Average monthly max- imum air temperature from April through August 1995 was generally higher than the long-term average whereas the average maximum air temperature in 1996 was lower than the long-term average through June before increasing above the long-term average in July and August. Effect of year on utilization or grazing distribution likely was related to differences in weather pat- terns between 1995 and 1996.
Table 2. Components of the analysis of variance used to test effects of stocking density (SD), graz- ing units (GU), stage of grazing (ST), species (SP), cycles (CY) and years (YR) on tiller height and leaf length reduction and on uniformity indices in paddocks grazed by cattle.
Over years
Source of variation df
year Source of variation
YR
1GU
3GU
3ST
3YR*GU
3SD
3ST
3GU*ST*SD (error a) 6
YR*ST
3SP
1SD
3SP*SD 3
YR*SD
3GU*ST*SD*SP (error b)
YR*SD*GU*ST (error a)
12CY
1SP
1CY*SD 3
SP*SD
3CY*GU*ST*SD (error c)
YR*SP
1SP*CY
1YR*SP*SD
3SP*CY*SD 3
YR*SP*SD*GU*ST (error b) 24 Error dt
CY
1Corrected Total
3
1
3 3
Error d1 27
Corrected Total
127330 JOURNAL OF RANGE MANAGEMENT 56(4) July 2003
1
2
1
3
Grazing unit 1
1
2 4
3
Grazing unit 3
1
2 4
3
Grazing unit 2
1
2 4
3
Grazing unit 4
Fig. 2. Paddock arrangement and starting point (T) in the rotation of each grazing unit.
Utilization
Stocking density did not affect (P = 0.47) tiller height reduction in 1995, whereas tiller height reduction in 1996 for the 27 steers ha' treatment was less (P = 0.04) than for the lower 2 stocking density treatments (Table 3). This difference was largely due to the unexplainably low tiller height reduction for the 27 steers ha'
treatment in cycle 3 in 1996, where height reduction was much lower in
1grazing unit (15 cm) than the average for the other grazing units (29 cm). When data were analyzed across years, but without data from cycle 3 in 1996, there were no differ- ences (P = 0.44) among stocking densities.
Leaf length reduction was not affected in either year by stocking density (P > 0.60).
Realizing that tiller height reduction and leaf length reduction are indices of utiliza- tion, stocking density did not affect uti- lization nor did it likely affect the efficien- cy of harvest of the available forage in the experimental pastures. In addition, there was no stocking density x species interac- tion (P = 0.66) for tiller height reduction or leaf length reduction indicating that stocking density had no effect on species selectivity.
Animal preference for switchgrass and big bluestem was different in 1995 than in 1996. Tiller height was reduced more (P = 0.01) in 1995 for switchgrass than for big bluestem while tiller height reduction was not different (P = 0.10) for the 2 species in 1996 (Table 3). Leaf length reduction was similar (P = 0.73) between species in 1995 but was 70% greater (P = 0.01) for big bluestem than for switchgrass in 1996 (Table 3).
Species selectivity changed by cycle for tiller height reduction (P = 0.01) and leaf length reduction (P = 0.01) in 1995. Tiller height was reduced 35% more for switch- grass than for big bluestem in cycle 2, but
tiller height reduction did not differ between switchgrass and big bluestem in cycle 3 (Table 4). In 1996, tiller height reduction was not different (P > 0.70) for the 2 species within either cycle. Leaf length reduction was greater for big bluestem than for switchgrass in cycles 2 and 3 of both years except in the second cycle of 1995 when leaf length reduction of switchgrass was greater. In the third cycle, big bluestem tended to be shorter and more leafy with relatively few elon- gated or reproductive tillers while switch- grass tillers were mostly reproductive, tall, and less leafy. Based on leaf length reduc- tion as an indicator of utilization, the cattle preferred big bluestem in the third cycle of both years.
Grazing Distribution
Uniformity indices, based on grass tiller heights (0=6.4, SD=1.3) and leaf lengths (0=17.3, SD=1.8), were similar for all treatment paddocks before the first grazing cycle in 1995. Uniformity indices were lower at this time than for any other col- lection period in the following 2 years, indicating relatively uniform stands in terms of tiller height and leaf length at the initiation of the study. Prescribed burning in late spring 1995, before initiation of the study, helped develop this uniformity. Fire on tallgrass prairie reduces heterogeneity of community and canopy structure because it minimizes the effect of previous
patch grazing and promotes uniform growth of grass communities (Andrew 1986, Collns 1989).
Indices for tiller height before grazing, tiller height after grazing, and tiller height
Table 3. Tiller height reduction (THR) and leaf length reduction (LLR) in 1995 and 1996 by stock- ing density and species averaged over cycles 2 and 3 in warm-season grass paddocks'.
1995 1996
Source of variance THR LLR THR
Stocking density (steers ha')
---(cm)---
9 19a 50a
18
22a 57a
27 21a 57a
54 22a 60a
LSD (0.05) Species
5.0
Big bluestem 19a 57a
Switchgrass 23b 56a
LSD (0.05) 3.3 6.7
'Different letters within a column and source of variance indicate means are different at P < 0.05.
JOURNAL OF RANGE MANAGEMENT 56(4) July 2003 331
Table 4. Tiller height reduction (THR) and leaf length reduction (LLR) for big bluestem (BB) and switchgrass (SW) in grazing cycles 2 and 3 averaged over stocking densities during 1995 and 1996.1
THR LLR
Cycle BB SW (0.05) BB (0.05)
1995 ---(cm)---
2 23a 31a
3 15a iSa
1996
2 43a 41a
3 28a 24a
1Different letters within row and plant measurement indicate means are different at P < 0.05.
reduction did not vary among stocking densities (P = 0.52, P = 0.64, and P = 0.56, respectively) but indices for tiller height after grazing (P = 0.01) and tiller height reduction (P = 0.01) were greater in 1996 (11.9 and 11.5, respectively) than in 1995 (8.7 and 8.5, respectively). The lack of dif- ferences in tiller height indices among stocking densities indicates that stocking density did not influence utilization or spatial distribution of defoliation at the patch or paddock level. The higher indices for tiller height after grazing and tiller height reduction in 1996 suggest that the increased spatial variability in tiller height over the 2 years was the cumulative effect of selective grazing in the paddocks.
Because paddocks were not burned in year 2 before grazing, unevenness established in year
1due to patch grazing was carried over and accentuated by selective grazing during the second year.
Differences in tiller height indices between cycles were not consistent (P = 0.01) by species. The indices for tiller height after grazing and tiller height
reduction were greater (P = 0.01) for big bluestem in cycle 2 than in cycle 3; where- as, these same indices did not differ between cycle 2 and cycle 3 for switch- grass. Moreover, the indices for tiller height after grazing and tiller height
reduction for big bluestem and switchgrass were not different in cycle 2, but in cycle 3 the indices were 59 to 95% greater (P = 0.01) for switchgrass than for big bluestem (Table 5). As mentioned earlier, a high proportion of switchgrass tillers was reproductive by the third cycle. Field observations indicated that leaves were stripped from reproductive tillers leaving
the culms largely intact while vegetative tillers were grazed close to ground level.
This grazing pattern resulted in a wide range of extended tiller heights. Big bluestem tillers were mostly vegetative in the third cycle and were utilized more heavily and evenly than switchgrass.
Like the tiller height reduction index, the leaf length reduction index was not affected by stocking density (P = 0.87) but increased (P = 0.04) from 1995 (19.5) to 1996 (24.2).
These differences were not consistent between species (P = 0.02). During 1995, the leaf length reduction index for switch- grass and big bluestem did not differ but the index was greater for switchgrass (27.4) than for big bluestem (21.1) in 1996. The index for leaf length after grazing varied similarly to the leaf length reduction index.
The leaf length reduction index was greater (P = 0.01) for both species in cycle 2 than in cycle 3 (27 vs. 17 averaged over the 2 years). Steers apparently had the opportunity to graze more selectively in cycle 2 than in cycle 3 because of higher herbage allowance. Herbage mass (Table 6) peaked in cycle 2 in both years.
Herbage allowance at the beginning of cycle 2 ranged from 100 to 820 kg DM
AUM', whereas herbage allowances in cycle 3 were 60 to 380 kg DM AUM'.
Stocking densities, at identical stocking rates, had little influence on level of uti- lization or spatial distribution of defolia- tion of switchgrass and big bluestem in a mixed sward. Hart et al. (1993) concluded that pasture size and distance to water were key variables affecting livestock grazing distribution in eastern Wyoming.
Percentage use of standing herbage did not differ among locations within small pas-
tures (24 ha) whether they were grazed continuously or grazed rotationally (Hart et al. 1993). Walker et al. (1989) found that uniformity of grazing was not affected by a 74-fold change in stocking density (0.17 vs 12.5 AU ha') on rangeland in the Rolling Plains of Texas. Both Walker et al. (1989) and Stuth et al. (1987) reported that cattle were more selective for plant communities or preferred sites in rotation- ally-grazed (higher stocking density) pas- tures than in continuously-grazed (lower stocking density) pastures. Kirby et al.
(1986) also found no relationship between stocking density and uniformity of utiliza- tion on mixed prairie in North Dakota.
Studies (Senock et al. 1993) reporting stocking density effects on utilization and/or grazing distribution generally included confounding factors, such as dis- tance to water, topography, or stocking rate, which does not allow an explicit test of stocking density and livestock grazing behavior relations. In our study, distance to water was less than 240 m in all pastures, which is less than the distance reported to affect grazing distribution (Gerrish and Davis 1999). Furthermore, pasture relief was nearly level in all pastures, thus removing topography as an influential fea- ture on animal foraging behavior (Cook 1966). In addition, stocking rate was kept constant for all treatments by manipulating the length of grazing period.
The principal factors that varied among stocking density treatments in our study were paddock size, initial herbage allowance (Table 6), and grazing period length. Paddock size primarily affects dis- tance to water and, as already stated, dis- tance to water in our study always was less than the critical distance reported to affect grazing distribution (Gerrish and Davis 1999). High herbage allowance and longer grazing periods commonly are given as reasons for development of poor or patchy distribution (Kothmann 1984, Vallentine 2001) because animals have more opportunity to select preferred for- age sites and plants and then return to those sites later in the same period to graze regrowth of grazed plants. In our study, herbage yields at the beginning of a
grazing cycle generally did not differ
Table 5. Uniformity indices for tiller height before grazing (THBI), tiller height after grazing (THAI), and tiller height reduction (THRI) for big bluestem (BB) and switchgrass (SW) in 2 grazing cycles averaged across 4 stocking densities and 2 years.
THBI THAI THRI
Cycle BB SW (0.05) (0.05) (0.05)
2 7.6Aa 8.OAa 1.08 9.SAa 11.4Aa 228 10.2Aa 11.4Aa 2.11
3 6.OAb 9.5Bb 1.31 6.9Ab 13.4Ba 1.93 6.9Ab 11.7Ba 1.53
1Different uppercase letters within row and index and different lowercase letters within column indicate means are different at P < 0.05.
332 JOURNAL OF RANGE MANAGEMENT 56(4) July 2003
Table 6. Standing crop yields in warm-season grass paddocks at 4 stocking densities in 1995 and 1996 at the beginning of each grazing cycle.l
Stocking Cycle
1Cycle 2 3
density 1995 1996