J. Range Manage.
56:174-184 March 2003
Mineral concentration dynamics among 7 northern Great Basin grasses
DAVE GANSKOPP AND DAVE BOHNERT
Authors are Rangeland Scientist, USDA-ARS, Eastern Oregon Agricultural Research Center', 67826-A Hwy. 205, Burns, Ore. 97720; and Range Animal Nutritionist, Oregon State University, E.O.A.R.C., 67826-A Hwy. 205, Burns, Ore. 97720.
'The Eastern Oregon Agricultural Research Center is jointly operated by the USDA-Agricultural Research Service and the Oregon Agr. Exp. Sta. of Oregon State University.
Abstract
Livestock and wildlife managers must be aware of the nutritional dynamics of forages to sustain satisfactory growth and reproduction of their animals and assure fair value for pasture.
Despite a history of livestock grazing in the northern Great Basin, annual and seasonal mineral concentrations of many of the region's prominent grasses have not been measured. We addressed this problem with monthly sampling (April-November) of 7 cool-season grasses at 6 sites during 1992, a drier than average year (86% of mean precipitation), and 1993 when precipitation was 167% of average (255 mm). Grasses included: Poa sandbergii Vasey, Bromus tectorum L., Sitanion hystrix (Nutt.) Smith, Agropyron spicatum (Pursh) Scribn. & Smith, Festuca idahoensis Elmer, Stipa thurberiana Piper, and Elymus cinereus Scribn. &
Merr. Phosphorus, K, Ca, Mg, Mn, Fe, Cu, Zn, and Na were assayed, and initial statistical analysis was a split-split-plot with main effects of species, years, and months and all possible inter- actions. For a preponderance of the minerals, (Zn and Na exclud- ed) the 3-way year x month x species interactions were significant (P < 0.05) indicating that main effects did not function indepen- dently. Generally, mineral concentrations averaged about 41 %
higher among the grasses for the drier of the 2 years (1992).
Copper, Zn, and Na concentrations were below required levels for beef cattle (9.9, 28.8, and 672 mg kg', respectively) among all the grasses for all sampling periods. Seasonally deficient miner- als included Ca, Mg, P, K, and Mn. Calcium and Mn were largely deficient (< 3.2 and 1.15 g kg'', respectively) for beef cattle early in the growing season with levels rising as grasses matured.
Seasonal patterns of Mg were variable among the grasses, increasing in some as the season progressed, remaining stable among others, and declining with maturity in yet others.
Phosphorus and K levels were typically adequate (>1.94 and 5.76 g kg'1, respectively) for beef cattle early in the growing season and declined to deficient levels by July and August. Iron was of no concern, because concentrations were more than adequate for cattle (> 48 mg kg 1) among all the grasses for all seasons. While a mixed stand of forages can extend the period of adequate mineral nutrition for cattle in some instances, we suggest that a supple- ment be available season-long on northern Great Basin range- lands and that the formulation include at least Ca, Mg, P, K, Cu, Zn, Mn, and Na in available forms and proper ratios.
Technical Paper No. 11899 Oregon Agr. Exp. Sta.
Manuscript accepted 16 May 02.
Resumen
Los manejadores de fauna y ganado deben estar enterados de las dinamicas nutricionales de los forrajes para sostener un crecimiento y reproduccion satisfactorios de sus animales y ase- gurar el valor favorable de sus praderas. A pesar del historial de apacentamiento de ganado en la Gran Cuenca del Norte las con- centraciones anuales y estacionales de minerales de muchos de los zacates importantes de esta region no habian sido medidas.
Nosotros abordamos este problema con muestreos mensuales (Abril - Noveembre) de 7 zacates de estacion fria en 6 sitios, durante 1992, un ano mas seco que el promedio (86% de la pre- cipitacion promedio) y en 1993 cuando la precipitacion fue 167%
de la precipitacion promedio (255 mm). Los zacates muestreados fueron: Poa sandbergii Vasey, Bromus tectorum L., Sitanion hys- trix (Nutt.) Smith, Agropyron spicatum (Pursh) Scribn. & Smith, Festuca idahoensis Elmer, Stipa thurberiana Piper, and Elymus cinereus Scribn. & Merr. y los minerales determinados fueron P, K, Ca, Mg, Mn, Fe, Cu, Zn y Na. El analysis estadistico inicial fue un diseno experimental de parcelas subdivididas, en el que los efectos principales fueron las especies, anos y meses y todas sus posibles interacciones. Para la mayoria de los minerales (excluyendo Zn y Na) las interacciones triples ano x mes x especie fueron significativas (p < 0.05) indicando que los efectos principales no actuan en forma independiente. Generalmente las concentraciones de minerales promediaron aproximadamente 41% mas en los zacates del ano mas seco (1992). Las concentra- ciones de Cu, Zn y Na estuvieron por abajo de los niveles requeridos por el ganado para carne (9.9, 28.8 y 672 mg respectivamente), esto fue para todos los zacates y todos los periodos de muestreo. Los minerales estacionalmente defi- cientes incluyeron al Ca, Mg, P, K y Mn. El Ca y Mn fueron muy deficientes (< 3.2 y 1.15 g kg"1, respectivamente) para el ganado para carne al inicio de la estacion de crecimiento y los niveles fueron incrementando conforme los zacates madu- raron. Los patrones estacionales de Mg variaron entre las especies de zacates, incrementando en algunos de ellos con- forme la estacion de crecimiento avanzo, permaneciendo estable en otros y disminuyendo con la madurez en otros. Al inicio de le estacion de crecimiento los niveles de P y K fueron adecuados (>1.94 y 5.76 g kg 1, respectivamente) para el ganado para carne y disminuyeron a niveles deficientes en Julio y Agosto. Respecto al Fe no hubo preocupacion porque las con centraciones fueron mas que adecuadas para le ganado (>48 mg kg'), esto fue para todas las especies y todas las estaciones.
Mientras que en algunas situaciones una comunidad con
174 JOURNAL OF RANGE MANAGEMENT 56(2) March 2003
diversas especies forrajeras puede exten- der el periodo de una nutricion adecuada de minerales para el ganado, nosotros sug- erimos que en los pastizales de la Gran Cuenca del norte se tenga una suple- mentacion de minerales disponible durante toda la estacion y que la formu- lacion incluya al menos Ca, Mg, P, K, Cu, Zn, Mn y Na en formas disponibles y rela- ciones adecuadas.
Key Words: copper, zinc, manganese, sodium, iron, phosphorus, magnesium, potassium, calcium, Poa sandbergii, Bromus tectorum, Sitan ion hystrix, Agropyron spicatum, Festuca idahoensis,
Stipa thurberiana, Elymus cinereus
Stockmen and wildlife managers must be aware of the nutritional concentrations of forages on rangelands to assure ade- quate growth and reproduction of their animals and make informed decisions when purchasing supplements. Similarly, those marketing pasture should also be aware of the nutritional characteristics of their forages to assure reasonable and fair returns. Despite a history of livestock grazing in the northern Great Basin, there have been few efforts to quantify the sea- sonal and annual mineral concentrations of the region's most prominent rangeland grasses (Murray et al. 1978, Mayland and Shewmaker 1997).
The northern Great Basin experiences an arid Mediterranean climate with about 80% of the annual precipitation occurring in the fall, winter, and spring months when low temperatures hinder plant growth.
Rangeland grasses typically begin growth with warming temperatures in the spring, and herbage accumulation stops upon depletion of soil moisture in mid- to late- July (Sneva 1982, Ganskopp 1988).
Hickman (1975) presented Ca and P pro- files for 4 grasses common to the region, and Murray et al. (1978) and Mayland and Shewmaker (1997) described the seasonal dynamics of 9 elements for 2 introduced and 5 native grasses in southern Idaho.
Neither source, however, addressed the year to year disparities in nutritive value associated with precipitation differences.
Rates of gain for livestock reflect the nutritional dynamics of the region's for- ages with mature cows gaining up to 1.86 kg day' early in the growing season and losing 0.4 kg day' by mid- to late-August (Raleigh and Wallace 1965, Turner and DelCurto 1991). Within the same period, calf gains may range from 0.7 to as little as 0.1 kg day' (Turner and DelCurto 1991). Mineral supplementation has not
been intensively studied in this region, however, Murray et al. (1978) reported enhanced April-December gains in cattle supplemented with protein, phosphorus, and sulfur and slightly elevated gains of supplemented calves from August to December. Later, Mayland et al (1980) documented increased weight gains by grazing cattle supplemented with addition- al zinc.
Our objective was to characterize sea- sonal and annual mineral concentrations of 7 of the region's most prominent range- land grasses. This was accomplished via monthly sampling at 6 sites during 1992, a drier than average year, and 1993 when
above average precipitation occurred.
Materials and Methods
Six collection sites were identified near Bums, Ore. with each supporting a broad array of forages. Specific locations, eleva- tions, and soil classifications for each site were reported by Ganskopp and Bohnert (2001). Among the 6 sites, mean soil depth was 69 cm (se = 5.1), and elevation ranged from 1,375 to 1,472 m (x =1,429).
Along an east/west line, the sites spanned 118 km, and north/south extremes encom- passed 75 km. Climatological data report- ed herein were acquired at the Northern Great Basin Experimental Range (119° 42' 30"W 43° 29' 37"N) with the location identified as the Squaw Butte Experiment Station in N.O.A.A. records (N.O.A.A.
1991 through 1994).
The shrub layer at each site was domi- nated by Wyoming big sagebrush
(Artemisia tridentata subsp. wyomingen- sis Beetle) with occasional occurrences (<10% relative cover) of mountain big sagebrush (Artemisia tridentata subsp.
vaseyana (Rydb.) Beetle) at upper eleva- tions. Dominant perennial grasses were typically bluebunch wheatgrass (Agropyron spicatum (Pursh) Scribn. & Smith) or Idaho fescue (Festuca idahoensis Elmer).
Subordinate grasses included Sandberg's bluegrass (Poa sandbergii Vasey), bottle- brush squirreltail (Sitanion hystrix (Nutt.) Smith), Thurber's needlegrass (Stipa thurberiana Piper), giant wildrye (Elymus cinereus Scribn. & Merr.), prairie Junegrass (Koeleria cristata
Pers.), and in disturbed areas, the intro- duced annual cheatgrass (Bromus tecto- rum L.). All of these grasses are common in the sagebrush steppe, and with the exception of prairie Junegrass, one or another may dominate the herbaceous layer depending on site specific conditions
and environmental factors (Daubenmire 1970, Hironaka et al. 1983).
We evaluated 7 grasses in this study.
Among these were Sandberg's bluegrass, a small stature, early maturing, caespitose, perennial grass and cheatgrass, an early maturing winter annual. The remaining 5
perennial grasses included bottlebrush squirreltail, bluebunch wheatgrass, Idaho fescue, Thurber's needlegrass, and giant wildrye. With the exception of giant wildrye, which can attain heights of up to 2 m, these are mid-size caespitose grasses.
In both years (1992 and 1993) we visited all 6 locations and sampled each within a 3- day interval at the end of each month.
Months sampled included April-November in both years.
Yearly precipitation compiled on a cal- endar year basis at the Northern Great Basin Experimental Range was 106 and 140% of the long-term average (x = 283 mm, n = 41) for calendar years 1992 and 1993, respectively (N.O.A.A. 1992-1993).
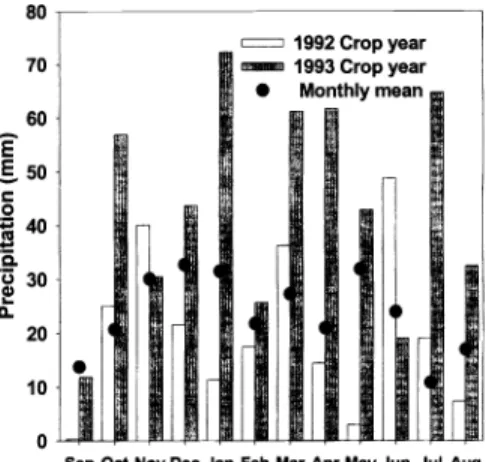
Sneva (1982), however, discovered that yearly forage yield in the region was most closely correlated with precipitation accu- mulated on a crop year or September through June basis. Based on that premise, accumulations for the 1992 and 1993 growing seasons at the Northern Great Basin Experimental Range were 86 and 167% of the crop year average (255 mm), respectively (Fig. 1). Both years of the study, however, experienced higher than average mid- to late-growing season rain- fall. June-July precipitation totaled 68 mm in 1992 compared to an average of 34 mm.
In 1993 pooled July- August precipitation
Sep Oct Nov Dec Jan Feb Mar Apr May Jun Jul Aug
Fig. 1. Monthly precipitation for 1992 (Sept.
1991-June 1992) and 1993 (Sept.
1992-June 1993) crop-years, plus the months of July and August in 1992 and 1993, and mean monthly accumulations (n
= 41) for the Northern Great Basin Experimental Range near Burns, Ore.
JOURNAL OF RANGE MANAGEMENT 56(2) March 2003 175
Table 1. P-values derived from a split-split-plot analyses of variance for mineral content of 7 grasses commonly found on northern Great Basin range- lands near Burns, Ore. Main effects were species of forage (N = 7), years (1992 and 1993), and months (Apr.-Nov.). Shaded values are not statisti- cally significant (P> 0.05).
SOURCE DF P K
Species (S) 6
Year (Y) 1
0.001 0.001
0.001 0.003 0.045 0.001
Y x S 6 0.001: 0.018 0.002
Month (M) 7 0.001 0.001 0.001 0.001
MxS 42 0.001 0.001 0.001
Y x M 7 0.001 0.001 0.001
Y x M x S 42 0.009 0.001 0.001
was 97 mm exceeding the long term mean of 27.2 mm by nearly 70 mm. Mean April-July temperatures were 2.5° C
warmer than average (x = 12.4° C) in 1992 and 1.6° cooler than average in 1993. A model based on precipitation accumulations for predicting annual herbage yields in the region furnished pro- duction estimates of 542 kg ha' for 1992 and 1,257 kg ha' for 1993 (Sneva 1982).
For the most part the grasses exerted few reproductive stems in 1992 and exhibited a wealth of reproductive effort in 1993.
At each site, samples were harvested from at least 6 plants per species by clip- ping to a 2.5-cm stubble and compositing materials by species. Greater numbers of plants were used for small stature grasses like Sandberg's bluegrass. Plants at each site were sampled as they were encoun- tered along a pace transect until adequate amounts of material were obtained. Each site experienced light (< 40% utilization) summer/fall grazing by cattle, but only ungrazed plants were included in our col- lections. Samples harvested before spring growth consisted of leaves and culms pro- duced in the previous growing season.
After growth initiated in the spring, crowns of the caespitose grasses were lightly crushed and the brittle and broken old-growth brushed aside before samples were collected. Plant materials were stored in labeled, paper bags in the field and transported to Eastern Oregon Agricultural Research Center headquarters where they were oven-dried at 60° C for 48 hours, ground to pass a 1-mm screen, and stored in plastic bags at room temperature for subsequent chemical assays. Samples were analyzed for calcium (Ca), phosphorus (P), magnesium (Mg), potassium (K), cop- per (Cu), zinc (Zn), manganese (Mn),
Mineral
0.001 0.001 .zpJ#3i`ii
0.004 0.001
0.001 0.001 0.001
0.001 0.001 0.001
0.001 0.010 0.002
sodium (Na), and iron (Fe). Assays were performed by The Research Extension Analytical Laboratory at The Ohio State University using Inductive Coupled Plasma (ICP) spectroscopy (Vela et al.
1993, Sirois et al. 1994). The specific instrument was an Applied Research Laboratory ICP Model 137'. Plant samples were dry-asked, treated with HNO3, dis- solved in HCL, and aspirated via an argon carrier into the ICP plasma chamber where ionized elements were quantified by emis- sion spectroscopy (AOAC 1990).
To establish a reference point for the various minerals, the required levels in forages for beef cattle were extracted from NRC (1996) requirements. The reference animal was a 5-yr old 454 kg Hereford x Angus cross cow, trailing its third 120-day old calf, 60 days post breeding, with a body condition score of 5, and consuming 2.5% (11.4 kg dry matter basis) of body weight per day.
Experimental design was a randomized complete block with 6 replications (sites) and 3 factors (years (n = 2), months (n = 8), and species of forage (n = 7)). Initial analyses employed a split-split-plot analy- sis of variance with species as whole- plots, years as subplots, and months as sub-subplots (Petersen 1985). The replica- tion x species error term (30 df) tested for species effects. The replication x year x species error term (35 df) tested the main effect of years and year x species interac- tion. The species x year x replication x month error term (490 df) tested for main effects of months, species x month, and
'Tradenames are supplied for information only and do not constitute endorsement by USDA-ARS of any product to the exclusion of others that may be suit- able.
CA MG MN FE
0.001 0.001 0.001 0.001
ZN
0.001 0.001 0.006 0.003 0.001 0.001
NA
0.019 0.001
0.001
s
0.001 0.002 0.036
0.001 0.046
0.001 0.001
species x year x month interactions.
Because all year main effects and 21 of 27 interactions involving year effects (Table 1) were significant P < 0.05), data were sorted by year, and each year analyzed separately employing a split-plot analysis of variance with species serving as whole plots and months as subplots. Mean separations between adjacent months within a species and year were obtained with Fisher's pro- tected LSD procedures (Fisher 1966) with statistical significance accepted at P <
0.05. All "+" symbols within this manu- script are associated with standard errors derived from 6 observations.
Results and Discussion Statistical analyses
With our initial split-split-plot analyses of variance, the 3-way year x month x species interaction was significant (P <
0.05) for 7 of 9 elements (exceptions were Zn and Na (Table 1)). That being the case, the 3 main effects did not function inde- pendently, and a majority of the data must be presented in a 3-way format. To briefly communicate the relative amounts of vari- ation associated with our initial split-split- plot analyses, component variances were totaled across all 9 elements. Year, month, and species main effects respectively accounted for 42, 29, and 9% of the total variation (data not shown). Among the 2- way interactions year x species constituted 2.1% month x species 1.8%, and year x month 9.6%. The 3-way year x month x
species interaction contributed 0.6%.
Among error terms, number 1 (rep x
species) contributed 1.0%, number 2 (species (rep x year)) contributed 0.7%, and error term 3 approximately 0.4%.
176 JOURNAL OF RANGE MANAGEMENT 56(2) March 2003
Table 2. P-values derived from separate split-plot analyses of variance for 1992 and 1993 mineral content of 7 grasses found on northern Great Basin rangelands near Burns, Ore. Main effects are species of forage (N = 7) and months (Apr.-Nov.). Shaded values are not statistically significant (P>
0.05).
1992
SOURCE DF P
Species (S) 6 0.004
Month (M) 7 0.001
M x S 42 0.001
Minerals
CU
0.001 0.001 0.001
NA
SOURCE DF P
Species (S) 6 0.001
Month (M) 7 0.001
M x S 42 0.001
Replications or sites accounted for 3.7%
of the total variation.
When year effects were removed from the model and each year analyzed separate- ly, 15 of 18 month x species interactions (Table 2) were significant (P < 0.01). That being the case, species did not react simi- larly as we progressed from month to month within years and again data must be presented for each species at monthly inter- vals for the majority of the data. Two of the
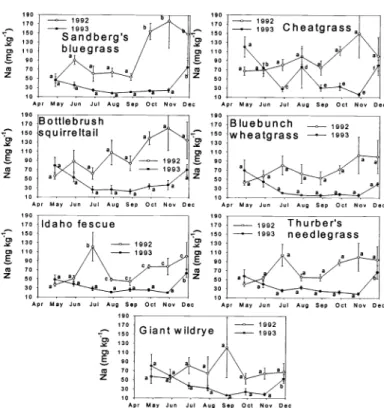
3 month x species exceptions involved Na (P > 0.13) in both 1992 and 1993. Main effects of species and month were signifi- cant (P < 0.02), however, suggesting that while Na concentrations differed among the grasses, they responded similarly as we progressed from month to month. The third exception to a significant (P = 0.23) month x species interaction was Zn in 1992.
Species effects were not significant (P = 0.32) either in that analysis suggesting that monthly means compiled across species would adequately describe Zn dynamics of the grasses in 1992. Both main effects and the month x species interaction were signif- icant (P < 0.01) for Zn in 1993, however.
When components of these analyses of variance were totaled across years and min- erals, month effects accounted for 46% of the total variation, species of grass about 31%, replications or locations about 12.5%, the species x month interaction 4.9%, error term number 1 about 3.8%, and error term two, 1,9%. Again, given the preponderance of significant 2 and 3-way interactions in our analyses, data will be presented at monthly resolutions for each year for each species of grass.
K CA MG MN FE
0.001 0.001 0.001 0.001 0.001
0.001 0.001 0.001 0.001 0.001
0.001 0.001 0.001 0.001 0.001
1993
Minerals
K CA MG MN FE
0.001 0.001 0.001 0.001 0.002
0.001 0.001 0.001 0.002 0.001
0.001 0.001 0.001 0.001 0.003
Calcium
Among grasses and for the duration of the study, mean Ca concentration was 2.99 g kg' (± 0.08). Given that all interactions were significant (P < 0.05) among all analyses, there was great variability among forages and months and between years (Fig. 2). With the exception of the winter annual, cheatgrass, most of the grasses began the growing season with a Ca content just at or below 3.2 g kg', the concentration necessary to meet NRC (1996) requirements for beef cattle.
Sandberg's bluegrass, however, never exceeded the recommended Ca level for cattle in any month of either year.
Sandberg's bluegrass responded to November precipitation in 1992 with ele- vated (P < 0.05) Ca levels that approached the required level, and cheatgrass respond- ed with significant increases (P < 0.05) to November rains in both years. Among the medium and large stature perennial grass- es (bottlebrush squirreltail, bluebunch wheatgrass, Idaho fescue, Thurber's needlegrass and giant wildrye), however, Ca content typically peaked well above recommended levels in late-July and then declined as these grasses matured and entered quiescence. None of these 5 grass- es, however, exhibited significant increas- es in Ca levels with the arrival of fall (October/November) moisture.
A general pattern evident among all the grasses was that Ca levels were typically higher (P < 0.05) during the dry 1992 growing season than the more moist 1993 months. The dilution of mineral concen- trations with more favorable growing con-
0.014 0.001
CU ZN NA
0.001 0.001 0.012
0.001 0.001 0.001
0.001 0.001
ditions is frequently seen and attributed to accumulation of more carbon under opti- mal conditions. Conversely, growth restriction during drought is accompanied by mineral concentration. With minimal selective grazing among these forages, cattle could have easily ingested sufficient Ca during the full 8-month sampling peri- od of 1992. By selecting for cheatgrass early in the growing season and bluebunch wheatgrass later in the year, cattle could have potentially acquired sufficient Ca for 7 of the 8 months sampled in 1993. All of the grasses, however, were Ca deficient for cattle during the late June-July inter-
val of 1993. Typically though, unless cat- tle are heavily lactating or foraging on rapidly growing herbage on acid, sandy, or organic soils, clinical signs of Ca deficien- cies are rare among grazing beef cattle (Underwood 1981).
Magnesium
Pooled across years, months, and for- ages mean Mg content was 0.94 g kg 1 (±
0.006), and the concentration necessary to meet NRC (1996) requirements was 1,15 g
kg'. Like Ca, all interactions were signifi- cant (P < 0.01) among all 3 analyses of variance (Tables 1 and 2) again indicative that annual and seasonal Mg contents of the grasses were quite variable among year, month, and species combinations.
Cheatgrass exceeded the required level of Mg from early May to late June of both years (Fig. 3). Idaho fescue also equaled or exceeded the Mg requirements of cattle in the early growing season, and both bot- tlebrush squirreltail and giant wildrye fur-
JOURNAL OF RANGE MANAGEMENT 56(2) March 2003 177
5 . 0
4.5 1 Sandberg's
-
1992 5.0 4.54.0 bluegrass 1993 4.0
3.5 i Y 3.5
D1 3.0 DC 3.0
tQ 2.5 1 CS 2.5
U 2.0 ai U 2.0
1.5 10
Apt May Jun Jut Aug Sep Oct Nov Sec Apt
10
Y
DC
U CS
5.0 4.5 4.0 3.5 3.0 2.5
May Jun Jut Aug Sep Oct Nov Sec
2.0 Bluebunch
15 wheatgrass
10
-o-- 1992
-- 1993
Apt May Jun Jut Aug Sep Oct Nov Sec Apt May Jun Jut Aug Sep Oct Nec Sec
Y DC DC CS
U
Apt May Jun Jut Aug Sep Oct Nov Sec 5.0 4.5 4.0 3.5 3.0 2.5 0 2
a
-0- 1992
-..- 1993
. , Thurber ' s
Apt May Jun Jut Aug Sep Oct Nov Sec
. 1.8 1.5 1.2 DC
0.9 DC
0.0
1 . 5
0 T needlegra,ss r
Apt May Jun Jut Aug Sep Oct Nov Sec 5.0
1.0 a .-
Apt May Jun Jut Aug Sep Oct Nov Sec
Fig. 2. Mean calcium content (±SE bars) of 7 grasses sampled over 8 months at 6 sites in the sagebrush steppe near Burns, Ore. in 1992 and 1993. The dashed horizontal line denotes required Ca content of forages for a 454 kg cow. Adjacent monthly means within a year sharing a common letter are not significantly (P > 0.05) different.
Fisher's protected LSD (P = 0.05) = 0.85 and 0.84 g kg'1, respective- ly, for 1992 and 1993.
nished adequate levels of Mg from July into November of 1992. Both Sandberg's bluegrass and cheatgrass responded to October rains with significant increases in Mg that exceeded requirements of cattle in 1992. Magnesium content of bluebunch wheatgrass marginally approached the required level for cattle for only 1-sam- pling period each year. Both bluebunch wheatgrass and Thurber's needlegrass were notable because neither species exhibited a significant (P > 0.05) month to month change in Mg content for either year. When pooled across species within years, selective grazing by cattle could have furnished adequate Mg level for all but the last 15 days of November in 1992.
In 1993, however, none of the grasses pro- vided adequate Mg from mid-August through late-November. Grass tetany gen- erally occurs during early spring, when grasses are exhibiting rapid vegetative growth (McDowell and Valle 2000), and lactation demands of cattle are peaking.
With the exception of cheatgrass, which was found primarily on disturbed sites, and giant wildrye early in the 1993 grow- ing season, our grasses were marginally satisfactory or deficient for Mg from late-
1.8
0.0
0.3
Apt May Jun Jut Aug Sep Oct Nov Sec
Apt May Jun Jut Aug Sep Oct Nov Sec
Giant wildrye -- 1992
. Lb T 1993
Apt May Jun Jut Aug Sep Oct Nov Sec
Fig. 3. Mean magnesium content (±SE bars) of 7 grasses sampled over 8 months at 6 sites in the sagebrush steppe near Burns, Ore.
in 1992 and 1993. The dashed horizontal line denotes required Mg content forages for a 454 kg cow. Adjacent monthly means within a year sharing a common letter are not significantly (P>
0.05) different. Fisher's protected LSD (P = 0.05) = 0.34 and 0.24 g kg', respectively, for 1992 and 1993.
April into late June. Bottlebrush squir- reltail, Idaho fescue, and giant wildrye fur- nished adequate Mg for the July-October period in 1992, but nearly all of the grass- es were deficient beyond late-June for the
1993 growing season.
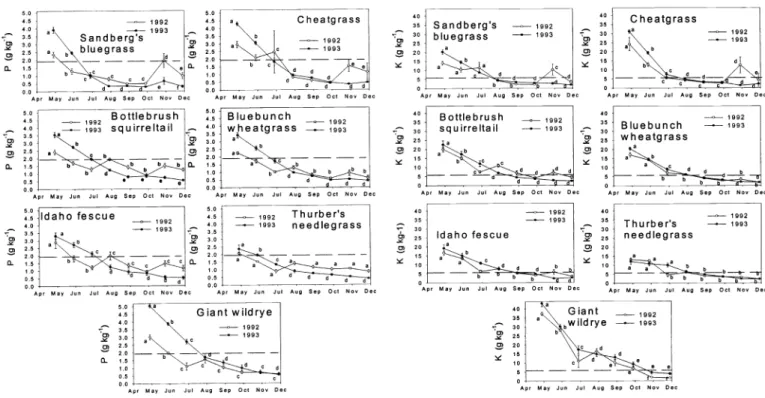
Phosphorus
Mean P concentration among grasses over the trials was 1.42 g kg' (± 0.09), and the concentration necessary to meet NRC (1996) requirements was 1.94 g kg 1.
Maximum and minimum values detected were 5.04 and 0.28 g kg', respectively.
While all interactions were again signifi- cant (P < 0.01) among all 3 analyses of variance (Tables 1 and 2), P did not exhib- it the same degree of year to year variabil- ity among species and months (Fig. 4) as Ca and Mg. The general pattern among the
grasses was that P levels equaled or exceeded cattle requirements early in the growing season and rapidly declined to inadequate levels by late July or early August in both years. Phosphorus levels were consistently higher (P < 0.05) for the early portions of the 1993 growing season than for the early months of 1992. In
1992, cheatgrass sustained adequate levels of phosphorus until mid-July, while all of the remaining grasses were largely defi- cient by mid-June. Sandberg's bluegrass and cheatgrass responded to October 1992 precipitation with significant (P < 0.05) increases in P during November, but ade- quate P levels for cattle were not sustained into December. The other medium stature grasses showed no significant (P > 0.05) responses to fall moisture in either year.
On a worldwide basis, the most preva- lent mineral deficiency among livestock is probably phosphorus (Underwood 1981).
Phosphorus deficiencies are more promi- nent among tropical grasses than temper- ate forages (McDowell et al. 1984), and the most devastating result of deficiency among cattle is reproductive failure
(McDowell and Valle 2000). Where seri- ous deficiencies occur, lactating cows may not enter oestrus until they cease milking or are supplemented with phosphorus (Lammond, 1970). Olson (1971) noted increased gains by cattle on southern Idaho cheatgrass ranges when phosphorus was supplemented.
178 JOURNAL OF RANGE MANAGEMENT 56(2) March 2003