J. Range Manage.
56: 402-409 September 2003
Remote sensing for cover change assessment in southeast Arizona
OSMAN C. WALLACE, JIAGUO QI, PHILIP HEILMA, AND ROBIN C. MARSETT
Authors are Research Scientist, Department of Geography/CGCEO, Michigan State University, East Lansing, Mich. 48824; Assistant Professor, Department of Geography/CGCEO, Michigan State University, East Lansing, Mich. 48824; Research Scientist, USDA-ARS Southwest Watershed Research Center, Tucson, Ariz. 85719; Research Scientist, USDA -ARS Southwest Watershed Research Center, Tucson, Ariz. 85719.
Abstract
Understanding landscape conversion is vital for assessing the impacts of ecological and anthropogenic disturbances at regional and global scales. Since rangelands cover nearly half of the global land surface, and because a large part of rangelands is located in semi-arid ecosystems, they serve as critical land cover types for determining regional biodiversity, global biogeochemical cycles, and energy and gas fluxes. For such vast ecosystems, satellite imagery is often used to inventory biophysical materials and man- made features on Earth's surface. The large area coverage and frequent acquisition cycle of remotely sensed satellite images make earth observation data useful for monitoring land conver- sion rates at different spatial scales. Remote sensing could also be used for temporal assessment of semi-arid ecosystems by provid- ing complimentary sets of rangeland health indicators. In this paper, temporal satellite data from multiple sensors were exam- ined to quantify land use and land cover change, and to relate spatial configuration and composition to landscape structure and pattern. The findings were correlated with the role of fire to bet- ter understand ecological functionality and human and/or natural activities that are generating environmental stressors in a rapidly developing, semi-urban census division located in southeastern Arizona. Results indicate that conversion of a fire-suppressed native grassland area has 2 spatial components; in the rural areas, grass is being eliminated by increasingly homogeneous shrub and mesquite-dominated areas, whereas in the urban and suburban areas, grass as well shrubs and mesquite are being elim- inated by a fragmented and expanding built landscape.
Key Words: land conversion, landscape indices, fire suppression, rangeland maintenance, semi-arid, grasslands
Land cover change may be the most significant agent of global change; it has an important influence on hydrology, climate, and global biogeochemical cycles (Skole et al. 1997). Characterizing the forcing factors that drive changes in landscapes, and the resul- tant impacts on biogeochemical and hydrological cycles and energy and gas fluxes, is essential to understand the total Earth system and the effects of natural and human-induced changes on the global environment. Further, assessment of environmental responses to drivers of changes in land cover and land use, partic- ularly in parts of the world that are currently undergoing the most stress, such as semi-arid rangelands, is an important function
Manuscript accepted 7 Dec. 02.
Resumen
La conversion del paisaje que entiende es vital para evaluar los
impactos de disturbios ecologicos y humanos en las escalas regionales y globales. Desde las praderas cubra casi la mitad de la superficie global de la pista, y porque una parte grande de praderas esta situada en los ecosistemas semiaridos, sirven como tipos criticos de la cubierta de pista para determinar biodiversi- tad regional, ciclos biogeoquimicos globales, y flux de la energia y del gas. Para tales ecosistemas extensos, las imagenes basadas en los satelites se utilizan a menudo para inventariar los materi- ales bioffsicos y las caracteristicas artificiales en la superficie de la tierra. La cobertura grande del area y el ciclo frecuente de la adquisicion de imagenes basadas en los satelites remotamente detectadas hacen datos de la observacion de la tierra utiles para vigilar indices de conversion de la pista en diversas escalas espa- ciales. La deteccion alejada se podia tambien utilizar para el gravamen temporal de los ecosistemas semiaridos proporcionan- do a conjuntos elogiosos de indicadores de la salud de las praderas. En estos datos basados en los satelites de papel, tempo- rales de los sensores multiples fueron examinados para cuantificar el cambio de la utilizacion del suelo y de la cubierta de pista, y para relacionar la configuracion y la composicion espaciales con la estructura y el modelo del paisaje. Los resultados fueron correla- cionados con el papel del fuego para entender mejor funciones ecologicas y las actividades humanas y/o naturales que estan generando las tensiones ambientales en rapidamente convertirse, division semi-urbana del censo localizaron en el Arizona del sud- este. Los resultados indican que la conversion de un area nativa fuego-suprimida del prado tiene dos componentes espaciales; en las areas rurales, la hierba esta siendo eliminada por el arbusto cada vez mas homogeneo y las areas mesquite-dominadas, mien- tras que en las areas urbanas y suburbanas, se chiban tambien arbustos y el mesquite esta siendo eliminado por un paisaje con- struido hecho fragmentos y que se amplia.
(Nemani et al. 1996). The benefits of such assessments include understanding the consequences of land cover and land use changes as they impact ecological processes, and evaluating which human activities contribute to changes occurring on the landscape.
Remotely sensed data are inherently suited to provide informa- tion on land cover characteristics related to ecological and dynamic aspects of developed regions at various spatial and tem- poral scales (Ridd 1995). However, few studies have looked at how remote sensing may be utilized to develop complimentary indicators for determining rangeland conditions. Recently, a con-
402 JOURNAL OF RANGE MANAGEMENT 56(5) September 2003
sensus has been developing that environ- mental analysis requires a set of comple- mentary indicators for a complete study of the causes and threats to ecological sys- tems and for their protection and restora- tion (U.S. EPA 1997, 1999). Landscape indices quantify aspects of spatial pattern that can be correlated with ecological processes (O'Neill et al. 1988). In this context, numerous mathematical indices have been developed that allow the objec- tive description of different aspects of landscape structure, function, and change.
While traditionally satellite data were used to address questions concerning vegetation types and amounts, this paper asked a dif- ferent question: How can satellite data be used to assess land conversion and cover change, study spatial configuration and composition of landscape elements, and, hence, assist in understanding the ecologi- cal integrity of a semi-arid grassland
ecosystem?
The paper's main objective is to evalu- ate rangeland conditions through remotely sensed imagery in a census division that is
undergoing rapid urban and suburban development. The utility of remote sens- ing as an ecological assessment tool will
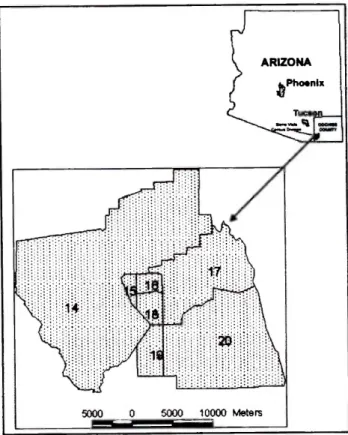
be determined by examining not only land Fig. 1. Study site: Sierra Vista census division (census tracts 14-20), southeastern use land cover change, but also the spatial Arizona.
arrangement and complexity of cover types in a semi-arid rangeland ecosystem.
Finally, an assessment of changes corre- lates satellite findings with effects of fire suppression. The assessment is conducted for aiding in the development of sustain- able land use practices, successful regional planning, and effective policy implemen- tation.
Materials and Methods
Study Area
The formerly rural Sierra Vista (31.6 N, 110.3 W) census division is a thriving community of 55,000 that serves as the regional urban center for southeastern Arizona (Figs.
Iand 2). Located approxi- mately 120 kilometers southeast of Tucson, Ariz., the city is surrounded by the Huachuca, Dragoon, and Mule Mountains, and is bordered on the east by the San Pedro River. Changes in land management techniques such as increased grazing intensity and frequency due to diminishing pastureland, coupled with tremendous urban growth have altered the vegetation patterns and dynamics in the San Pedro River basin (Qi et al. 2000). In the last 30 years, the Sierra Vista census division has experienced a sizable increase
Landsat ETM+ image of Sierra Vista Census Division, 1999
scime
Image Motadata Data at Acgtrisit cn October 12. 1999 DJSUm NAD83 Spharotdt GRS 1980 Pixel sire; 30 meters
PrtsidoTAA.
xonn 12Ckmrm
,.UV1:
iUSGS. Ert>s
D1
CanterFig. 2. Landsat ETM+ 4,3,2 composite image and metadata of Sierra Vista census division, 1999.
JOURNAL OF RANGE MANAGEMENT 56(5) September 2003 403
Table 1. Land cover area totals and temporal assessment of land cover change, selected years.
R R
lcover area totals
198
assessment of land cover change 19
:
ura -
5U: Urban 1973 1985 1999 Gain/ Gain/ Gain/
Loss Loss Loss
---(ha)---
(ha) (%) (ha)
R: Grass 3493 2679 1882 -814 -23% -797 -30% -1611 -46%
R: Shrub/scrub 7765 8194 8311 429 6% 117 1% 546 7%
R: Mixed Mesquite 3040 3241 3652 201 7% 411 13% 612 20%
R: Urban/unvegetated 1377 1562 1787 185 13% 225 14% 410 30%
R: Agr./Specialized 112 114 164 2 2% 50 44% 52 46%
R: Water/Clouds 74
7164 -3 -4% -6 -8% -9 -12%
U: Grass 7541 6340 6150 -1201 -16% -190 -3% -1391 -18%
U: Shrub/scrub 9141 8908 8714 -233 -3% -194 -2% -427 -5%
U: Mixed Mesquite 4709 4542 4470 -167 -4% -72 -2% -239 -5%
U: Urban/unvegetated 3347 4531 5146 1184 35% 615 14% 1799 54%
U: Agr./Specialized 115 484 386 369 321% -98 -20% 271 236%
U: Water / Clouds 85 133 72 48 56% -61 -46% -13 -15%
Total: Grass 11034 9019 8032 -2015 -18% -987 -11% -3002 -27%
Total: Shrubscrub 16906 17102 17025 196 1% -77 0% 119 1%
Total: Mixed Mesquite 7749 7783 8122 34 0% 339 4% 373 5%
Total: Urban/unveg. 4724 6093 6933 1369 29% 840 14% 2209 47%
Total: Agr./Specialized 227 598 550 371 163% -48 -8% 323 142%
Total: Water/Clouds 159 204 137 45 28% -67 -33% -22 -14%
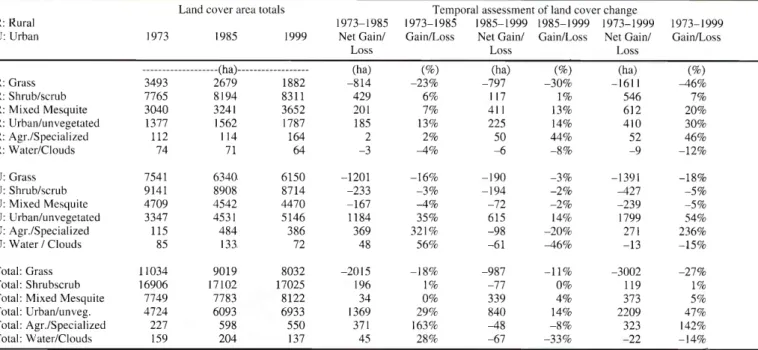
in developed land due mostly to its increasing regional importance and popu- larity as a retirement spot. According to satellite data, in the period between 1973 and 1999, the total area of developed land rose from 4,724 ha to 6,933 ha-a 47%
increase (Table 1). Most of the new urban growth took place over areas of native, perennial grasslands in the San Pedro River basin located in the southeastern quadrant of the census division. These transitional zones are characterized by unpaved roads, new utility corridors, and substantial residential development in the southeastern quadrant of the 1999 image (Fig. 3).
the Sierra Vista census division was used as the study area mask. The coverage was obtained from the USGS National Biological Information Infrastructure.
Image Processing
To remove the effects of atmospheric scattering from the images, Chavez's improved dark object subtraction (Chavez 1988) was utilized for the 1973 MSS image. For the 1985 TM and 1999 ETM+
images, a location-specific correction method, called the refined empirical line (Moran et al. 2001), was used for atmos- pheric correction. To correct the inherent
geometric distortion, all images were resampled to 1973 MSS ground resolu- tion, projected to the Universal Transverse Mercator projection, and the 1973 and 1985 images were co-registered to the orthorectified 1999 image with acceptable root mean square error of less than 0.05 pixel. Resampling and image-to-image registration was necessary for temporal assessments of land cover change and landscape indices. To reduce image noise and improve visual interpretability, images were modified using a 3-by-3 low-pass local- average spatial filter before classification.
Data Sources
As typically is the case with most long- term, multi-temporal land use and land cover studies, this paper utilized satellite images from different sensors (Landsat I Multispectral Scanner (MSS), Landsat 5
Thematic Mapper (TM), and Landsat 7
Enhanced Thematic Matter (ETM+)) at various scales and resolutions for assess- ing land use and land cover change. The images were acquired during the growing season and their acquisition was relatively close to the maximum green-up time in the region (usually late August through early October). The dates of acquisition were 5 Sep. 1973 (MSS), 30 Sep. 1985 (TM), and 12 Oct. 1999 (ETM+). All the imagery was acquired from the Arizona Regional Image Archive. A political boundary cover- age consisting of 7 census tracts comprising
1 999 urban transition zone
in Sierra Vista census division
Urbarsize areas
.5,'f 7 Eiaa
Fig. 3. 1999 urban transition zone in Sierra Vista census division.
404 JOURNAL OF RANGE MANAGEMENT 56(5) September 2003
Image Classification
A multispectral classification was per- formed using the supervised algorithm approach with maximum likelihood para- metric decision rule. Known a priori land cover types were identified by combina- tion of previously published vegetation maps, fieldwork data, recent personal field observations (utilized for the 1999 image classification), and personal interviews with U.S. Department of Agriculture per- sonnel with over 30 years of classification experience in the region. The selected sites in the remotely sensed data represented homogeneous examples of these known land cover types. Before the supervised classification algorithm was applied to the images, image data were merged with topographic information. A mosaicked 7.5-minute 1990 USGS digital elevation model with 30-meter contour interval was registered to the images to remove mon- tane forest and oak woodland areas in the Huachuca Mountain region. Species that have very similar spectral characteristics (e.g., velvet mesquite (Prosopis velutina Woot.), oaks (Quercus L.), quaking aspen (Populus tremuloides Michx.), and ever- greens) occupy quite different elevation ranges. The majority of the Upper Sonoran life zone species such as oaks, Mexican pinyon pine (Pines cembroides Zucc.), juniper (Juniperus L.), as well as transi- tion life zone species such as open pon- derosa pine (Pines ponderosa P.& C.
Lawson), characteristically found in eleva- tions of 1,800 meters (6,000 feet) and higher, were removed since grasslands, shrubs, and mesquite do not correspond to this elevation range. Use of ancillary ele- vation data thus aided in delineating the habitats and various associations between land cover characteristics associated with most anthropogenic disturbances. A 3-by-
3 majority filter was applied for post-clas- sification smoothing in order to reduce the pixel-by-pixel spectral variability encoun- tered by the classifier. Finally, the classifi- cation results were labeled based on the resource-oriented USGS Land Use/Land Cover Classification System Level I (Anderson et al. 1976).
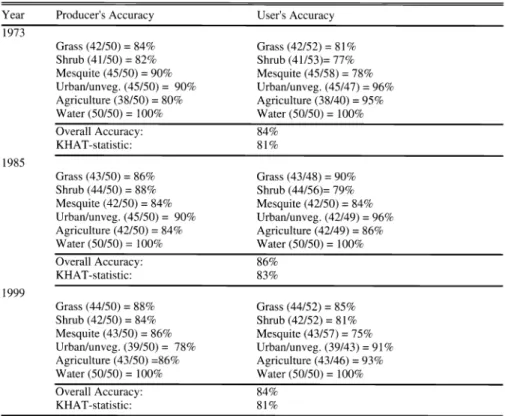
Classification accuracy assessment of land use/land cover maps required com- parison of 2 sources of information: (1) the imagery-derived classification data, and (2) reference data (ground truth). As a broad guideline, 50 ground points were selected outside of training areas using systematic random sampling and field- checked for each land cover category included in the classifications. Accuracy results for the 1973, 1985, and 1999 clas-
Table 2. Accuracy assessments for 1973, 1985, and 1999 supervised maximum likelihood classifications.
Year Producer's Accuracy User's Accuracy
1973
Grass (42/50) = 84% Grass (42/52) = 81%
Shrub (41/50) = 82%
Mesquite (45/50) = 90%
Urban/unveg. (45/50) = 90%
Agriculture (38/50) = 80%
(41153)= 77%
Mesquite (45/58) = 78%
Urban/unveg. (45/47) = 96%
Agriculture (38/40) = 95%
Water (50/50) =100% Water (50/50) =100%
Overall Accuracy: 84%
KHAT-statistic: 81%
1985
Grass (43/50) = 86% Grass (43/48) = 90%
Shrub (44150) = 88%
Mesquite (42/50) = 84%
Urban/unveg. (45/50) = 90%
Agriculture (42/50) = 84%
(44/56)= 79%
Mesquite (42/50) = 84%
Urban/unveg. (42/49) = 96%
Agriculture (42149) = 86%
Water (50/50) =100% Water (50150) =100%
Overall Accuracy: 86%
KHAT-statistic: 83%
1999
Grass (44/50) = 88% Grass (44/52) = 85%
Shrub (42/50) = 84%
Mesquite (43/50) = 86%
Urban/unveg. (39/50) = 78%
Agriculture (43/50) =86%
(42/52) = 81%
Mesquite (43/57) = 75%
Urban/unveg. (39/43) = 91%
Agriculture (43/46) = 93%
Water (50150) =100% Water (50/50) =100%
Overall Accuracy: 84%
KHAT-statistic: 81%
sifications are listed in Table 2. Producer's accuracy (measures errors of omission, e.g., 8 pixels that should have been classi- fied as "grass" were omitted in 1973 in Table 2), users' accuracy (measures errors of commission, e.g., 10 pixels were improperly included in the "grass" catego- ry in 1973 in Table 2), overall accuracy (percent of pixels correctly classified), and the Kappa statistic (percent of how much a given classification is better than a classi- fication resulting from chance) for the 3
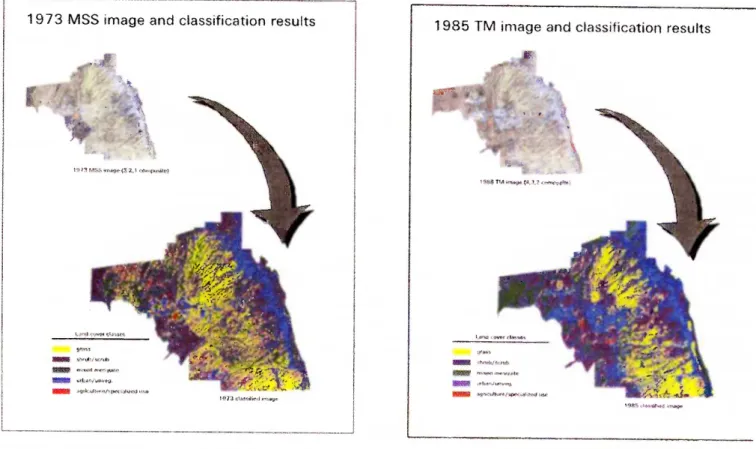
images were all above 80 percent. Satellite and classified images for 1973, 1985, and 1999 are displayed in Figures 4, 5, and 6, respectively.
Landscape Indices
For complete ecological assessments of managed ecosystems, there is a need to quantify aspects of spatial configuration and composition that can be correlated with other ecological processes such as land use/land cover change and the role of fire. To that end, satellite images offer another unique facility for observing and documenting landscape structure, func- tion, and change. There is a wide variety of landscape metrics and many software programs to calculate them (O'Neill et al.
1988, Turner and Gardner 1991). Many of these metrics have been shown to be high- ly correlated with one another (Riiters et al. 1995). In a factor analysis study,
Riiters et al. (1995) analyzed 55 landscape metrics for their statistical independence.
They concluded that the information con- tained in the 55 metrics could be narrowed down to 5 metrics. These metrics have also been proposed for implementation as watershed integrity indicators, landscape stability and resilience indicators, and biotic integrity and diversity indicators (U.S. EPA 1997). The metrics include patch density, edge density, Shannon's Diversity Index, Interspersion and Juxtaposition Index, and Contagion. These indices were derived directly from the classified images using the FRAGSTATS software (McGarigal and Marks 1995).
However, because the Patch Density, Edge Density, and Shannon's Diversity Index are dependent on the size of the smallest spatial unit mapped and the number of dif- ferent categories distinguished, the 1973 classified image was resampled to the spa- tial resolution of 1985 and 1999 images, i.e., 30 meters. Shannon's Diversity Index, a structural measure of the area distribu- tion of classes, did not display any varia- tion due to census division's large area extent, and was not interpreted. In addi- tion, the census division was partitioned into rural and urban zones based on census tract population statistics before landscape metrics were calculated for improved interpretation of different land use patterns and associated spatial structures. The U.S.
JOURNAL OF RANGE MANAGEMENT 56(5) September 2003 405
1973 MSS image and classification results
1 1
1985 TM image and classification results
Fig. 4. 1973 MSS image and classification results.
Census Bureau defines a rural area as one that is not urban (U.S. Department of Commerce 1992). "Urban" is defined as
either an urbanized area or places with populations of 2,500 or more outside urbanized areas. An urbanized area includes places and their adjacent densely settled surrounding territory that together have a minimum population of 50,000 (U. S.
Department of Commerce 1992). Two regions of census tracts meeting the defined criteria for urban and rural areas of the cen- sus division were selected from the imagery (Fig. 7). Descriptions of the metrics, how to interpret their value, and outputs are listed in
Fig. 5. 1985 TM image and classification results.
1973, 1985, and 1999 classified imagery clearly reveal endemic changes unique to rural and urban landscapes of the census division. Table
1and Figure 8 reveal sub- stantial loss of grass cover in both rural and urban sectors of the census division.
Between 1973 and 1999, net loss of grass cover for rural zones was 46%, and of the 1,611 grassland ha converted in rural areas, 65% was replaced by shrub and mesquite. During the same time, urban zones experienced an 18 and 5% net loss in grass and shrub/mesquite, respectively,
and 69% of this loss was converted to
urban/unvegetated land cover. These results clearly suggest different land use mechanisms, and drivers of land cover change for rural and urban areas of the census division. Although loss of grass cover is significant in both sectors, shrub and mesquite invasion is apparent in the rural areas, whereas built areas in the urban sector replaced grass as well as shrub and mesquite. Both of these land use mechanisms of conversion result in habitat degradation on native grasslands.
Table 3. The reader may refer to McGrigal Table 3. Outputs and descriptions of landscape metrics.
and Marks (1995) for a more complete assessment of landscape metrics.
Results and Discussion Land Cover Changes
The expected general model for the land cover classes should describe a strong dif-
ferentiation between each class.
Specifically, urban/unvegetated cover in the urban sector should substantially increase, and shrub and mesquite covers should replace grass cover in rural areas.
Land cover area totals derived from the
PD ED IJI
1973 (30m) Rural
Urban 35.6 133.4
Total 33.6 128.0
1985 Rural 81.7
Urban 87.1 189.5
Total 82.2 186.7
1999 Rural 128.3
Urban 170.1 260.2
Total 145.8 242.7
PD: Patch Density
-expresses the number of patches within the entire reference unit on a per area basis (100 ha).
ED: Edge Density
-length of all borders between different classes in a reference area divided by the total area of the reference unit (100 ha).
IJI: Interspersion and Juxtaposition Index
-analyzes the adjacency of
each patch with all other patch types, and measures the extent to which classes are interspersed.
Contagion: measures the extent to which classes are aggregated or clumped.
406 JOURNAL OF RANGE MANAGEMENT 56(5) September 2003
1999 ETM-+- image and classification results
+iih ,«<y
47<,,.
v,crdFig. 6. 1999 ETM+ image and classification results.
Landscape Changes
The first expected general model for landscape change detection was that the farther away the site from the urban center (located in center of Fig. 2), the lower the
fragmentation and shape complexity.
Hence, the rural sector was expected to display lower values for Edge Density, Patch Density, Interspersion and Juxtaposition Index, and higher values for Contagion as compared to the urban sector in a single scene. In a time series, rural indicators should remain constant in a healthy ecosystem. The second model states that the urban sector should have higher shape complexity since it consists of a mixture of roads, residential, business, and industrial areas. Visibly, the urban area is more fragmented than non-urban areas in the census division and should have higher fragmentation values. In a time series, urban Edge Density, Patch Density, and Interspersion and Juxtaposition Index should increase, and Contagion should decrease. Table 3 shows the results for landscape indices with respect to different sectors and years.
The output indicates substantial and increasing grassland disturbance in both rural and urban sectors between 1973 and 1999. Urban areas have higher shape com-
Urban and non-urban (rural) sectors
of sierra Vista census division, 1999
Fig. 7. Urban and non-urban (rural) sectors of Sierra Vista census division, 1999.
plexity, or modification (Edge Density) values than rural areas in both space and time although the difference is not substan- tially large. Urban fragmentation values over space and time (increasing Intersper- sion and Juxtaposition Index, Patch Density and decreasing Contagion) indicate dissected and equally adjacent classes in an expanding urban landscape. However, sig- nificant modification is also occurring in the rural landscape. From 1973 to 1999, the northwest corner of the rural census divi- sion experienced a substantial increase in
mesquite, and the northeast quadrant wit- nessed significant conversion of grass to shrub (Figs. 4, 5, and 6). Clumping (decreasing Interspersion and Juxtaposition and increasing contagion) and high modifi- cation (increasing Edge Density and Patch Density) in rural areas, coupled with sub- stantial loss of grass cover identified by land cover change indicate expanding communities of homogeneous and aggre- gated shrub and mesquite. The increasing rural modification and urban fragmenta- tion of grasslands indicate that the habitat
--- --- ---
-----
151V --
----
_01
-
R: rural U: urban
R - grass U - grass
I
R - shrub shrub urban urban
-814 -1201 429 -797 .190 117 -1611 -1391 546