An Experimental and Numerical Study on Wake Vortex
Noise of a Low Speed Propeller Fan
Soichi Sasaki1, Ikki Torise2, Hidechito Hayashi1
1System Science Division, Graduate School of Engineering, Nagasaki University, Nagasaki, Japan 2Graduate School of Engineering, Nagasaki University, Nagasaki, Japan
Email: [email protected]
Received September 20, 2012; revised November 2, 2012; accepted November 11, 2012
ABSTRACT
In order to clarify the relationship between the aerodynamic noise and the flow regime around the rotating blade of a propeller fan operated at the maximum efficiency point and the off-design point, the characteristics of fans with differ-ent solidity impellers were analyzed experimdiffer-entally. At the off-design point, the broadband noise of the high solidity fan was much larger than that of the low solidity fan because the relative velocity increased according to the solidity and the noise sources increased because of the number of blades. In the case of the low solidity fan, the broadband noise due to wake vortex shedding was generated at the off-design point in the low flow rate domain and the maximum effi-ciency point because the relative flow around the blade separated easily.
Keywords: Fan; Flow Phenomenon; Aerodynamic Noise
1. Introduction
In the field of construction machinery, it is necessary to generate a large amount of artificial wind to cool the en-gine because the wind due to the traveling speed of an automobile is likely of little benefit to the machine. However, increasing the needed flow rate of the fan leads to an increase in the associated noise. Because of the trade-off between the flow rate and fan noise, clarifying the relationship between the aerodynamic characteristics and the fan noise in the design phase is an important technical issue [1]. For example, in order to balance the resistance from the radiator and the engine, the operation point of the cooling fan is shifted to a so-called off-de- sign point that is lower than the maximum efficiency point. Therefore, it is necessary to analyze the mecha- nism of the aerodynamic noise at the realistic operation point that is generated from not only the maximum effi- ciency point but also the off-design point in the low flow rate domain [2]. Kodama et al. indicated that the discrete frequency noise of a jet fan was generated because of the interference between the rotating blade and the inclined flow, which has one lobe number [3]. In a study on the aerodynamic noise of the propeller fan, the authors veri- fied experimentally the mechanism of the discrete fre- quency noise of a propeller fan generated because of the pseudo rotor-stator interaction [4]. In such previous studies, there are not a few study cases about the mechanism of the discrete frequency noise synchronizing with the blade passing frequency of the high specific
speed fan [5]. On the other hand, in a study on the turbulent noise of a low pressure axial fan, Fukano et al.
suggested that the broadband noise was mainly generated because of the vortex shedding to the wake if the turbulence of the incoming flow to the fan is weak [6]. Whereas the relationship between the tip vortex and noise has been discussed in a study of the aerodynamic noise from the propeller fan [7], there are several reports stating that the affect of the tip vortex on the fan noise is small in the vicinity of the design point [8]. Thus, several factors related to the flow regime affect the fan noise at the main operation points. Therefore, in order to discuss the relationship between the flow regime around the ro-tating blade and fan noise, when the complex aerody-namic phenomena are exclusively discussed focusing on a specific noise, an effective result of the specific noise phenomenon might be obtained.
In this study, we focused on the wake vortex noise of the propeller fan driven at the maximum efficiency point and the off-design point, and sought to clarify the rela-tionship between the flow regime around the rotating blade and the broadband noise. The characteristics of the propeller fans having different solidity impellers are es-timated experimentally. We mainly discuss the influence of the wake on the broadband noise of the fan.
2. Experimental Procedure
2.1. Experimental Apparatus
main dimensions of which are listed in Table 1. The
blade design is the same and only the number of blades,
B, varies. Thus, when the number of blades increases, the solidity of the impeller also increases. Herein, the impel-lers with 7, 14, and 21 blades are referred to as P7, P14, and P21, respectively.
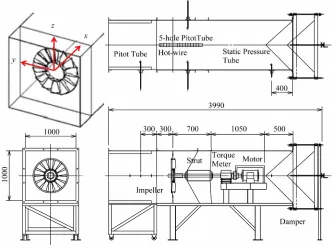
A schematic view of the experimental setup is shown in Figure 2. The height and width of the duct are 1 m
each, while total length of the duct is approximately 4 m. The dynamic pressure is measured 600 mm upstream of the impeller disc using a Pitot tube. The flow rate is de-duced from the dynamic pressure. It is controlled by an adjustable throttle at the duct exit. The static pressure of the fan is measured 400 mm upstream from the exit. The rotational speed of the driving shaft is 1200 rpm. The shaft torque of the motor is measured using a torque me-ter (Ono-Sokki; SS-500); the efficiency of the fan can be estimated on the basis of the ratio of the shaft power to the theoretical power. The flow coefficient φ, the static pressure coefficient ψs, the power coefficient λ, and the
efficiency η are summarized below as
2 2 2
2 2 3
2 4
,
π 1
8 ,
π 1
s s
t
P Q
U D U
L D U
ν
ν
(1)
The flow in the wake is characterized using a hot-wire anemometer system (KANOMAX JAPAN, Inc.) and a 5-hole Pitot tube. A 1/2-inch microphone (ONO-SOKKI; LA-4350) is set 1.0 m from the impeller inlet, on the axis.
[image:2.595.308.539.242.448.2]The frequency content of the delivered signal is provided by an FFT analyzer, with a bandwidth of 25 Hz.
Figure 3 shows the overall view of the fan model used
[image:2.595.308.537.244.449.2]for the numerical simulation. A commercial code (SCRYU/ Tetra, Software Cradle Co., Ltd.) was used for the nu-merical simulation. The mechanisms downstream of the fan, such as motors and bearings, are omitted in this model. The body and entire length of the apparatus were designed using the same dimensions as the real apparatus. The minimum grid width on the blade surface was cho-sen as y+ = 50. Approximately four million grid elements
Table 1. Main dimensions of the impeller.
Impeller P7 P14 P21
B 7 14 21
σ 0.443 0.887 1.330
C (mm) 122
D (mm) 613
t (mm) 3
(a) (b) (c)
[image:2.595.100.224.344.405.2]Figure 1. Test impellers.(a) P7; (b) P14; (c) P21.
[image:2.595.131.463.475.726.2]
Blade
Boundary Layer (y+=50)
Inlet ( P0=0 )
Inlet ( Q =const. )
Impeller
Figure 3. Fan model for the numerical simulation.
were used to solve the whole flow field in the fan. A constant flow rate was set at the inlet boundary of the model, whereas a static pressure of 0 Pa was set at the outlet side.
2.2. Analysis of Wake Vortex Noise
Fukano et al. [2] proposed a prediction equation for the sound power generated from a fan as
6 3
0
π d
2400 SPAN
B E
a DW z
, (2)where B is the number of blades, ρ is the density of the air, D is the wake width, W is the relative velocity, z is the span-wise coordinate, and a0 is the speed of sound.
The relative velocity was defined by the inlet velocity [2]. The relationship between the sound power and sound pressure at the measurement point is defined as
2 2 2 0
4π
2 3 cos
E R
p a
, (3)
where R is the distance between the noise source and the observation point (R = 1.0 m) and θ is the angle that ex-presses the directivity of the sound (θ = 0˚). The sound pressure level is defined by
2
2
10log
p
o p L
p
, (4)
where p0 is the reference sound pressure (20 μPa).
Typical velocity fluctuations measured by the hot-wire anemometer in the wake are plotted in Figure 4. The
I-type hot-wire probe (KANOMAX; 0251R-T5), inclined according to the absolute flow angle measured by the 5-hole Pitot tube, is mounted on the experimental appa-ratus. Though incomplete, the measurement gives access to the wake width. The circumferential velocity at the measurement position can be used to change the time scale to a length scale in order to evaluate the width of the wake. The widths of the wake measured in the abso-lute coordinate system and the relative coordinate system
are related, as shown in Figure 5. The center line of the
wake is assumed to be parallel to the stream line at the relative flow angle β, so the width of the wake measured in the absolute coordinate system becomes Da. The width
in the relative coordinate system is given by the line from A to C.
3. Results and Discussion
3.1. Characteristics of the Propeller Fan
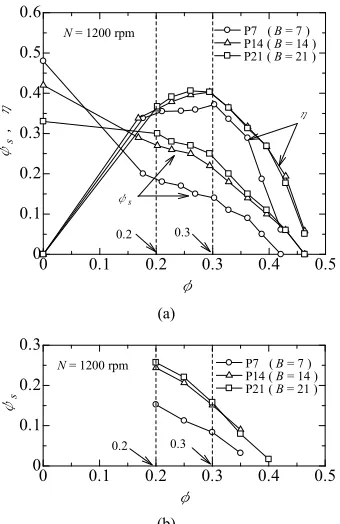
The aerodynamic characteristics of the propeller fans are shown in Figure 6. In the characteristics of the actual fan,
the static pressure coefficient of P21 is the highest over a wide range of flow rates; however, the maximum effi-ciency of P21 is the same as that of P14. This is because the shaft power of P21 must be large because of the change in the inertia moment from the increase in the number of blades. The characteristics of the static pres-sure by the numerical simulation represented the ten-dency of the measured values. In this study, in order to take into account the actual driving conditions, the char-acteristics of the fans at the maximum efficiency point (φ
= 0.30) and at the off-design point in the low flow rate domain (φ = 0.20) are analyzed.
The characteristics of the sound pressure level of the propeller fans are given in Figure 7. Notably, the
aero-dynamic noise of the propeller fans is not proportional to
0.04 0.045 0.05
20 30
t , msec.
V
, m
/s
N = 1200rpm
φ= 0.30
r/R = 0.81
time mean velocity Da
[image:3.595.59.287.87.215.2]P21
Figure 4. Velocity fluctuation measured by the hot-wire anemometer.
D A
C B
β
α
[image:3.595.337.507.426.527.2] [image:3.595.370.476.569.706.2]0 0.1 0.2 0.3 0.4 0.5 0
0.1 0.2 0.3 0.4 0.5 0.6
ψs
,
η
φ
N = 1200 rpm P7 ( B = 7 ) P14 ( B = 14 ) P21 ( B = 21 )
0.2 0.3
η
ψs
(a)
0 0.1 0.2 0.3 0.4 0.5 0
0.1 0.2 0.3
φ ψs
P7 ( B = 7 ) P14 ( B = 14 ) P21 ( B = 21 )
N = 1200 rpm
0.2 0.3
[image:4.595.89.259.84.346.2](b)
Figure 6. Aerodynamic characteristics. (a) Experiment; (b) Numerical simulation.
0 0.1 0.2 0.3 0.4 0.5 80
90 100
P7 (B = 7) P14 (B = 14) P21 (B = 21)
N =1200rpm
φ
Lp
, d
B
[image:4.595.312.539.84.421.2]0.2 0.3
Figure 7. Noise characteristics.
the number of blades because the noise level of P21 at the maximum efficiency point is the lowest. On the other hand, the noise level of P21 is the highest among these fans when the operation point changes to the off-design point. In the next section, we take into account these ba-sic characteristics and compare the flow regimes of P7 and P21.
3.2. The Fan Noise at the Off-Design Point
The flow field in the meridian plane is presented in Fig-ure 8. The operation point is the off-design point (φ =
0.20). Figure 8(a) shows P7, and Figure 8(b) shows P21.
The lines indicate the mean velocity iso-contours, and the amplitude of the velocity fluctuations is superimposed as a color map. In both figures, the main flow domain of the fan is formed in the span range: 200 mm < r < 300 mm.
(a)
(b)
Figure 8. Flow field in the m ional plane at the off-design
the velocity gradients. Therefore, the noise sources are
ustic sources around the ro-ta
erid
point measured by the hot-wire probe. (a) P7 (off-design point); (b) P21 (off-design point).
in
likely to be on the blade surface in the upstream con-tinuation of the location of large fluctuating intensity. At the off-design point, the velocity fluctuations in the wake of P21 are much higher than those in the wake of P7. The intensity of the velocity fluctuation follows the same trend as the noise characteristics of the fan at the off- design point (see Figure 7).
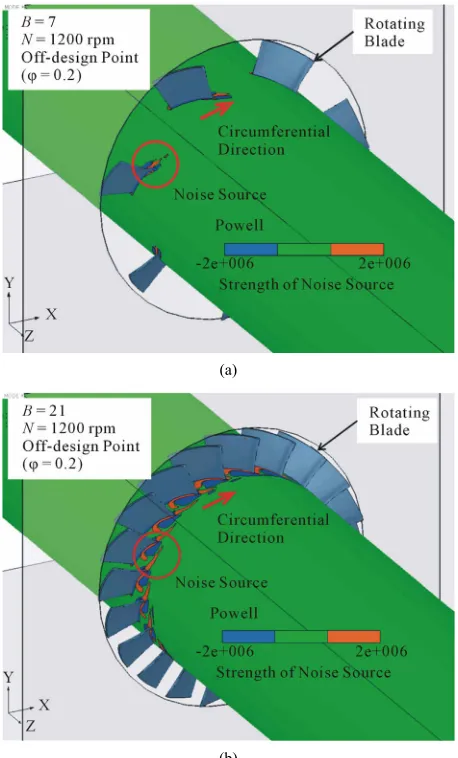
The distribution of the aco
ting blade is shown in Figure 9. The location in the
radial direction of the sectional view is in the vicinity of the main flow domain (r/R = 0.75). The source term of the sound source suggested by Powell and Howe is util-ized for visualization of the distributed acoustic source around the rotating blade [9,10]
22 2
p
2 c p div
t
ω u , (5)
where p is the sound pressure, is the vorticity vector,
co
ω
[image:4.595.90.255.392.496.2](a)
[image:5.595.58.287.84.463.2](b)
Figure 9. Distribution of th coustic sources around the
tating in the circumferential direction have been
span direction distributions of the wake are given in
o’s m
e a rotating blade. (a) P7; (b) P21.
ro
formed in the vicinity of the trailing edge of the blade. P21 has more acoustic sources around the rotating blades than P7 because P21 has a larger number of blades than P7.
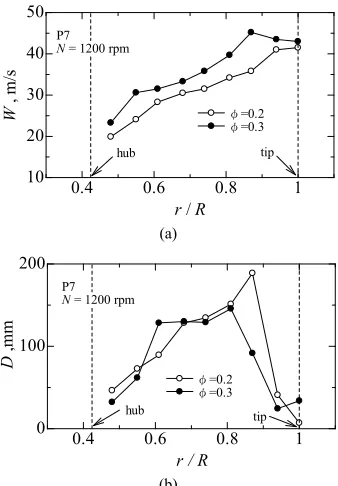
[image:5.595.341.507.84.323.2]The
Figure 10. Figure 10(a) shows the distribution of the
relative velocity, and Figure 10(b) shows the width of
the wake. The measurement point was chosen 30 mm downstream from the trailing-edge section of the fan. The relative velocity of P7 at the blade tip side is the slowest among the three fans because of low solidity (○; 0.7 < r/R < 1.0). Moreover, the distribution of the width of the wake indicates that the wake of P7 becomes the most separated flow because the blade pitch is wide.
The predicted noise levels according to Fukan odel are superimposed on the measured spectra in Fig- ure 11. At the off-design point, the broadband noise level
of P21 distributed 200 Hz to 300 Hz exceeds that of P7.
0.4 0.6 0.8 1 10
20 30 40 50
φ = 0.2
N = 1200 rpm
, m
/s
P7
W P21
hub
r / R
tip
(a)
0.4 0.6 0.8 1 0
100 200
r / R
D
,m
m
φ = 0.2
N = 1200 rpm P7 P21
hub
tip
(b)
Figure 10. Comparison of the span direction distribution of the wake with the impellers having different solidity. (a) Relative velocity; (b) Width of the wake.
102 103 104 40
60 80 100
P7 (90.6 dB) P21 (93.1 dB)
N = 1200 rpm
φ = 0.2
Lp
, d
B
f , Hz P7 (Prediction) P21 (Prediction)
[image:5.595.338.507.380.477.2]420Hz
Figure 11. Comparison of predicted noise levels wi
meas-he broadband noise of P21 at tmeas-he off-design point is one
th ured noise spectra at the off-design point.
T
of the reasons why the fan noise is increased (see Figure 7). The frequency band of the narrowband noise of P21
3.3. The Fan Noise at the Maximum Efficiency Point
re show gure 12. The discrete frequency noise
syn-dional plane, the acoustic no
The noise spectra at the maximum efficiency point a n in Fi
chronized with the blade passing frequency becomes large at the maximum efficiency point. However, ac-cording to the noise characteristics shown in Figure 7,
the dominant factor of the noise level is the broadband noise distributed in the range from 50 Hz to 500 Hz. The symbols in the figure represent the predicted noise levels. The broadband noise of P7 is probably caused by the wake vortices because the predicted noise levels agree with the measured noise levels (○). On the other, the pre-dicted noise levels of P21 did not agree with the meas-ured values (□). Therefore, no vortex is shed in the case of the maximum efficiency point of P21 because the flow from P21 attaches to the blade.
The aerodynamic acoustic source is shown in Figure 13. In the wake field of the meri
ise due to the wake vortex shedding is distributed along the span direction (A in the figure). The distribu-tion of the acoustic sources along the span direcdistribu-tion be-comes one of the major factors. Pairs of the positive and negative acoustic sources are formed because of the tip vortex. In the following discussion, we focus on the analysis of the wake vortex noise at the maximum effi-ciency point.
101 102 103 104 40
60 80 100
P7 ( 89.8 dB ) P21 ( 85.7 dB )
N = 1200 rpm φ = 0.3
LP
,d
B
f ,Hz 140Hz 280Hz 420Hz
[image:6.595.89.256.431.529.2]P7 (prediction) P21 (prediction)
Figure 12. Comparison of predicted noise levels with meas-ured noise spectra at the maximum efficiency point.
B
A Impeller
P7
The measured wake of the rotating blade is compared at the two major operation points in Figure 14. In the
relative velocity shown in Figure 14(a), the velocity at
the maximum efficiency point is faster than that at the off-design point because of the high flow rate. On the other hand, the width of the wake at the maximum effi-ciency point becomes narrower than that of the width at the off-design point in the vicinity of the blade tip side because the relative flow attaches to the blade (see Fig-ure 14(b)). The wake vortex noise is generated from P7
at both operation points; however, the development of the potential of the wake vortex is conserved at each op-eration point. These results indicate that there was little difference in the fan noise of P7 at the off-design point and the maximum efficiency point.
4. Conclusions
N=1200 rpm φ= 0.3
Figure 13. Visualization of the aerodynamic noise source by the source term of Powell and Howe.
ic noise of the fan with the high-so- lid
1) The aerodynam
ity impeller P21 was the lowest among the three fans at the maximum efficiency point, whereas the fan noise of P21 was the highest when the operation point changed to the off-design point;
2) The Karman vortex was shed to the wake at the off- design point of P21; the vortices were one of the major factors for the increase of the fan noise. The broadband noise of P21 was much higher than that of P7 because the relative velocity increased according to the solidity and the noise sources increased because of the number of blades;
0.4 0.6 0.8 1
10 20 30 40 50
r / R
W
,
m
/s
φ=0.2
φ=0.3 P7
N = 1200 rpm
hub tip
(a)
0.4 0.6 0.8 1
0 100 200
D
,m
m
r / R
P7
N = 1200 rpm
φ=0.2
φ=0.3
hub tip
[image:6.595.339.508.452.695.2](b)
Figure 14. Comparison of th an direction distrib tion of the wake at the different operation points. (a) Relative
ve-e sp u
[image:6.595.88.258.572.710.2]rted by a Grant-in-Aid fro
[1] H. Tsubota, “ ent of Ring Fan,”
Komatsu Tech o. 159, 2007, pp.
ing at Design and Off-design
Condi-3) In the case of the fan having the low solidity impel- ler, P7, the broadband noise due to the wake vortex shedding was generated at the maximum efficiency point and the off-design point in the low flow rate domain be- cause the relative flow around the blade separated easily;
4) The wake vortex noise is generated from P7 at both operation points; however, the development of the poten- tial of the wake vortex is conserved at each operation point. These results indicate that there was little differ- ence in the fan noise of P7 at the off-design point and the maximum efficiency point.
5. Acknowledgements
This investigation was suppo m the Harada memorial foundation.
REFERENCES
Research and Developm
nical Report, Vol. 53, N 2-9. (in Japanese)
[2] T. Fukano and C.-M. Jang, “Tip Clearance Noise of Axial Flow Fans Operat
tion,” Journal of Sound and Vibration, Vol. 275, No. 3-5, 2004, pp. 1027-1050.
doi:10.1016/S0022-460X(03)00815-0
[3] Y. Kodama, et al., “A Study of Discrete Frequency on a Jet Fan,” Turbomachinery, Vol. 29, No. 10, 2001, pp Noise
te Frequency Noise Generated by
inarayana, et al., “Strut or Guide Vane Secon-
.
611-618. (in Japanese) [4] S. Sasaki, et al., “Discre
Pseudo Rotor-Stator Interaction of a Propeller Fan,” Tur- bomachinery, Vol. 40, No. 10, 2012, pp. 612-619. (in Japanese)
[5] B. Lakshm
dary Flows and Their Effect on Tubomachinery Noise,”
Journal of Aircraft, Vol. 20, No. 2, 1983, pp. 178-186.
doi:10.2514/3.44849
[6] T. Fukano, et al., “Prediction of Sound Pressure Level of
., “Experimental Research into Rela-
l., “Relation between Aerodynamic
rtex Sound,” Journal of the
we, “Theory of Vortex Sound,” Cambridge Noise Generated from Low Pressure Axial and Diagonal Flow Fans,” Transactions of Japan Society of Mechanical Engineering Series B, Vol. 51, No. 466, 1985, pp. 1825- 1832. (in Japanese)
[7] S. Nakashima, et al
tion between Propeller Fan’s Flow Field and Noise: Rela- tionships between Difference of Tip Flow Behavior in Each Operation Point and Its Noise (Fluids Engineer- ing),” Transactions of Japan Society of Mechanical En- gineering Series B, Vol. 76, No. 767, 2010, pp. 1042- 1047. (in Japanese)
[8] H. Hamakawa, et a
Noise and Velocity Fluctuation around Rotor Blade of the Axial Flow Fan,” Turbomachinery, Vol. 40, No. 8, 2012, pp. 464-472. (in Japanese)
[9] A. Powell, “Theory of Vo
Acoustic Society of America, Vol. 36, No. 1, 1964, pp. 177-195.
[10] M. S. Ho