151
©IJRASET: All Rights are Reserved
Crime Data Analysis in Python using K - Means
Clustering
Md Abu Saleh
1, Ihtiram Raza Khan
*22Assistant Professor,CSE, School of Engineering Sciences & Technology, Jamia Hamdard (Deemed To Be University), New
Delhi
1CSE, School of Engineering Sciences & Technology, Jamia Hamdard (Deemed To Be University), New Delhi
Abstract: Crime is one of the biggest hurdle in today’s world and its increasing at the fire pace which is a major cause for concern. There is a need to monitor and keep track of all the crimes so that it can be used by police department to investigate the cases easily and quickly. In this experiment, a machine learning K-means algorithm is used to predict and analyze the crime in the town of Chicago. The dataset of crimes in Chicago is available at the kaggle website, that is used as the dataset to make prediction and to visualize the patterns and trends of different crimes. The other purpose of this project is to evaluate how much k – means algorithm is feasible to determine and solve the current problem.
Keyword: Machine Learning, Python, K-means clustering, Supervised Learning, Predictive Modelling
I. INTRODUCTION
Crime – a term which is just like a havoc in today’s world. It is a disastrous act for entire humanity and an obstacle in the way of development. The legal definition of crime introduces us with a vast number of hardships and complexities as it is a social construction that we consider a crime.. It is disputed and contingent dynamically. In other words, crime differs over time and location. It is not a universally accepted factor and it's socially built and altered reality. Crime is just like a toxic which spoils the growth of a nation. Simply, a crime can be defined as a criminal offense against any person or an organization with an intent to harm them directly or indirectly that is illegal and punishable under the country law. Crimes like robberies, looting, sexual harassment, rape, abduction, and killings are one of the major crimes which are happening at a breakneck speed starting from rural to urban areas. As these crimes are lifting high and high so there is a need to control them and thus creating huge pressure on the investigation department. There should be a system which can analyze crime and police department can make use of this technology that can make their task easier to investigate the case on the basis of different trends for years. Crime analysis is a law enforcement technique that involves systematic analysis for trends and patterns identification and analysis.
Trends information can help security agencies even more effectively and efficiently to execute their resources.Crime analysis also plays a vital role in constructing the solution to crime problems and codifying the blueprint of crime prevention. Data analysis engulf the concept of crime analysis process. Crime analysis studies all the history of crime regarding arrest of a criminal, crime history of the criminal, when the police were called for help to identify patterns and trends and to make a decision rapidly [1]. Basically, crime analysis is done on the basis of the collection of raw information about the incident. As data is huge, so they need to be structured on the basis of useful information about the crime incident and that would be used for analysis of crimes. This is helpful for both public welfare and police welfare to make plan and catch the culprit. To achieve this process machine learning and data science could simplify and speed up our task. In this experiment, motive is to make crime prediction as well as to analyze and visualize the crime patterns on the basis of datasets. For this purpose, K - means clustering algorithm which is a predictive modelling technique, is used for classification.
II. LITERATURESURVEY
152
©IJRASET: All Rights are Reserved
[6] asserts an interface that enables users to gather useful information from the National Crime Record Bureau's large crime database and identify crime locations using the clustering method. .Dr. S. Santhosh Baboo and Malathi [7] study focused on creating Indian scenario crime analysis tools using different data mining techniques to enable organizations to wipe down, classify and examine crime data readily and economically in order to detect substantive trends and advancements.
III.INTRODUCTIONTOK-MEANSCLUSTERING
In data mining, we use predictive modelling to make predictions. Predictive modelling is a technique to predict for the future on the basis of the data we already have. This technique is both for supervised and unsupervised learning. For this experiment, it is about supervised learning. Supervised learning is a type of machine learning in which we train the machine using labelled data, that labelled data is our dataset which is already known. dataset which is already known.
K-means clustering make use of unsupervised learning to solve the known problem. It is the process by which various objects are classified to the extent that they are as different from each group, but as similar in each group as possible. In a particular group , the objects should be identical within the group but the properties or attributes of the objects must be heterogenous in comparison to other group. With respect to attributes, we decide which objects should be grouped together and the resulting group formed is called a cluster. A K –means algorithm can be applied to a numerical and continous data with minimal dimension.
Dab =
Here a and b are the co-ordinates, d is the number of dimension and D is the euclidean’s distance [8].
IV.IMPLEMENTATION
A. Dataset
Dataset is taken from the website of Chicago Police Department. Kaggle is one of the top website [9] in the field of data science which provides the full-fledged dataset. This dataset consists of crimes from the year 2012-2017. This data set comprises of robust data, including those of data on the date and time, location of the crime, type of crime, and so forth. For our experiment, we will focus at the type of the crime, time of crime its location ,year and arrest made.
B. Data Preprocessing
Data Preprocessing is a essential stage for converting our dataset into concise format. It tends to improve missing and null values. Scikit Learn (v.0.20.0) – a python library [10] is used for preprocessing the dataset.
1) Null and Missing Values: It preprocess and readjust the dataset by replacing the missing values and transforming string to numeric data type. For missing values, fillna function is used to fill the value as well as dropna function is used to remove the null values and numpy function to transform string to numeric values [11].
2) Normalization: After performing preprocessing, normalization is performed to balance our datasets and to remove redundancy. In scikit learn, nomalize function is used for normalization [10].
C. Implementation of K – means Algorithm to Preprocessed Datasets
An algorithm for implementing k means algorithm to preprocessed dataset can be given as;
1) Take the desired mean value from the cluster. Mean value depends upon the number of cluster to be formed. Number of cluster
to be formed will be exactly depend upon number of mean value to be chosen.
2) Search for nearest neighbour of mean value and put in cluster.
3) This process is repeated until we get the same cluster.
[image:2.595.60.491.651.737.2]D. Model of Crime Analysis System
153
©IJRASET: All Rights are Reserved
The model shown in Figure 1 consists of a crime dataset. As this dataset is huge therefore it consists of some unwanted data which is of no use as well as some missing and null values. To remove redundancy, the dataset undergoes preprocessing operation using scikit learn tool to transform into precise format. Normalization is performed to rescale the dataset. The resultant preprocessed dataset is feeded to K – means clustering technique. After clustering, the crime datas are plotted and on the basis of desired cluster of crime , analysis can be made. The data set I have used is of chicago from the year 2012-2017. The chosen attributes of dataset are Case ID, Type, Time, Location, Year and Arrest made, is shown in Figure 2.
Figure 2: Attributes of Crime Data
E. Analysis and Visualization
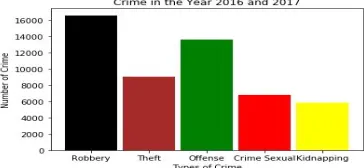
[image:3.595.208.388.192.361.2]The crime happened in the year 2016 and 2017 are shown in the Figure 2. It demonstrates different crime such as robbery, theft, offense, crime sexual and kidnapping that was happened in the respective years. From the presented histogram, robbery is one of the top crime in Chicago.
Figure 3: Crime in the Year 2016 and 2017
So, the top five crimes in the year 2016 and 2017 are listed below:
1) Robbery
2) Offense
3) Theft
4) Sexual Crime
5) Kidnapping
[image:3.595.207.389.441.525.2]154
©IJRASET: All Rights are Reserved
[image:4.595.199.398.129.246.2]The rate of crime has increased in the year 2017 than in 2016.
Figure 5: Location of Crimes
From the above distribution, the top location of crime are:
a) Street
b) Residence
c) Apartment
d) School/Public/Ground
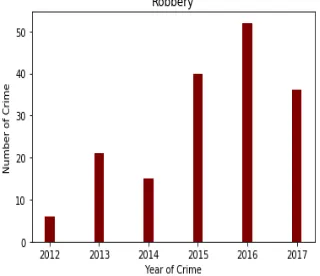
[image:4.595.218.378.376.514.2]From the datasets it was observed that the robbery has increased with rapid pace over the years therefore, analysis is performed over the different cluster of robbery between 2012 and 2017.
Figure 6: Analysis of Crimes based on Robbery Cluster
From the above distribution of robbery cluster, robbery is supreme in 2015 and 2016 and minimal in 2012 and 2014.
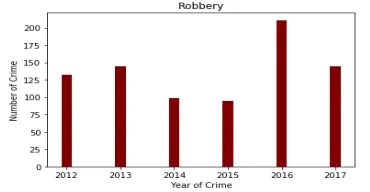
Figure 7: Analysis of Crimes based on Robbery Cluster
155
[image:5.595.207.392.112.208.2]©IJRASET: All Rights are Reserved
Figure 8: Analysis of Crimes based on Robbery Cluster
In Figure 6, robbery was supreme in the 2016 and almost same in the year 2014 and 2015.
Figure 9: Arrest made in the year 2016-17
Above pie-chart distribution, it clearly shows most of the criminals were not arrested. Here ‘True’ indicates criminal was arrested and ‘False’ indicates criminal was not arrested. This shows a huge negative.
V. EXPERIMENTALRESULTS
This experiment has been conducted on Jupyter Notebook in Python Language on Windows 10. Important libraries used are pandas, numpy, seaborn, and matplotlib.pyplot. Datasets has been taken from the website of Kaggle. Analysis of crime dataset has been done by performing k-means clustering technique. Python Scikit learning tool has been used to preprocess the datasets. The crime data analysis has been done from the year 2012 to 2017. Attributes focused for analysis are type, time, location of crime and arrest made. Analysis of crimes are represented through bar graph , histogram and pie chart. It was found that robberies were at its supremacy and most of the criminals were not arrested for their crimes.
VI.CONCLUSION
This paper presents a Crime analysis in a City of Chicago implemented using python and k-means clustering. Few preprocessing are applied to datasets to make them precise to workout faster and easily. Crimes has been analyzed by the help of clusters. Results are to be found to be fine and accurate. Overall, this technique proves to be feasible and model is deployed quickly and efficiently.
REFERENCES
[1] Alkesh Bharati, Dr Sarvanaguru RA.K. “Crime Prediction and Analysis Using Machine Learning.” International Research Journal of Engineering and
Technology vol. 5 (2018): 1037-1042.
[2] Mohamad Ali, Nazlena & Mohd, Masnizah and Lee, Hyowon and Smeaton, Alan and Crestani, Fabio and Mohd Noah, Shahrul Azman and Noah, Mohd.
(2011). I-JEN: Visual Interactive Malaysia Crime News Retrieval System.
[3] Thiprungsri, Sutapat. “Cluster Analysis for Anomaly Detection in Accounting Data : An Audit Approach.”inproceedingsThiprungsri2010ClusterAF. 2010.
[4] De Bruin, J.S,Cocx,T.K,Kosters,W.A.,Laros,J. and Kok,J.N. “Data Mining Approaches to Criminal Carrer Analysis .” Sixth International Conference on Data
Mining . 2006. 171-177.
[5] Al-Janabi, Kadhim B. Swadi. “A Proposed Framework for Analyzing Crime Data Set Using Decision Tree.” Journal of Kufa for Mathematics and Computer
vol. 1 (2011): 8-24.
[6] Gupta, Manish Gupta and B. Ch and M. P. “Crime Data Mining for Indian Police Information System.” 2011.
[7] Malathi. A, Dr. S. Santhosh Baboo. “An Enhanced Algorithm to Predict a Future Crime.” International Journal of Computer Applications, 2011: 1-6.
[8] Dibya Jyoti Bora, Dr. Anil Kumar Gupta. “Effect of Different Distance Measures on the Performance of K-Means Algorithm: An Experimental Study in
Matlab.” International Journal of Computer Science and Information Technologies vol. 5 (2014).
[9] https://www.kaggle.com/
[10] https://scikitlearn.org/stable/modules/preprocessing.html